
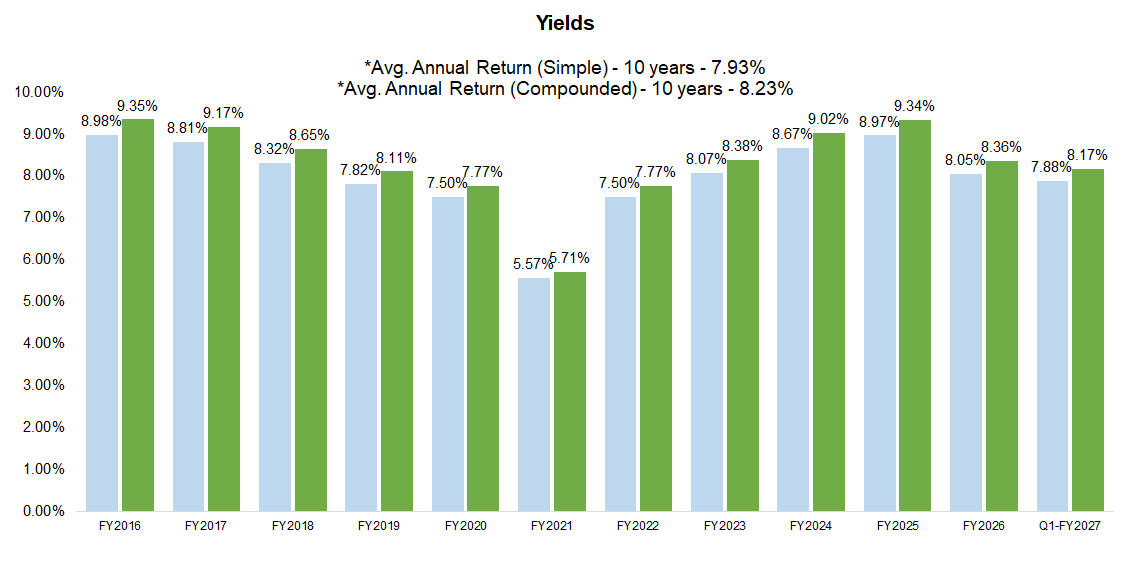
We project a yield of 7.93% in FY2027, vs. 8.36% in FY2026. We are reiterating our overall rating of 2, and risk rating of 2.
Disclosure: AWM Diversified MIC has paid FRC a fee for research coverage and distribution of reports. This fee creates a potential conflict of interest which readers should consider. See last page for other important disclosures, rating, and risk definitions.
| Offering Summary | |
|---|---|
| Issuer | AWM Diversfied MIC |
| Securities Offered (FundSERV Code: BEL 1801) | Class B Non-Voting Shares |
| Unit Price | $100 |
| Minimum Subscription | $10k |
| Distribution to Investors | Monthly, plus potential for year-end top up |
| Redemption Fees | n/a |
| Management Fee | 2% p.a. of share capital + up to 100% of lending/placement fees from borrowers |
| Sales Commissions | up to 5%, none paid since fund inception |
| Auditor | Czechowsky, Graham & Hanevelt CPAs |
| Key Financials (YE: Mar 31st) | FY2022 | FY2023 | FY2024 | FY2025 | FY2026 | FY2027 | FY2028 |
|---|---|---|---|---|---|---|---|
| Mortgage Receivables (Net) | $185,840,848 | $223,206,672 | $243,452,776 | $236,224,110 | $294,782,552 | $307,206,596 | $320,251,841 |
| Debt to Capital | 39% | 41% | 42% | 25% | 34% | 33% | 33% |
| Revenue | $12,723,579 | $18,432,420 | $24,349,104 | $24,907,993 | $23,524,170 | $24,792,519 | $25,405,616 |
| Net Profit (before paying investors) | $8,661,145 | $9,799,201 | $11,721,659 | $13,451,336 | $12,793,057 | $13,650,678 | $13,893,384 |
| Yield (compounded) | 7.77% | 8.38% | 9.02% | 9.34% | 8.36% | 7.93% | 7.65% |
First mortgages in line with the sector, with smaller average loan sizes, and higher LTVs. Impaired mortgages declined significantly as a percentage of receivables in FY2026, but remain above the sector average. However, loan loss allowances remain in line with the sector average, suggesting management expects realized losses to be broadly in line with peers.
The table below compares AWM’s portfolio with other MICs (AUM $100M+) focused on already-built single-family residential units.
| AWM | Average | |
|---|---|---|
| First Mortgage | 74% | 76% |
| B.C. | 16% | 35.7% |
| ON | 48% | 49.3% |
| AB | 37% | 9.5% |
| Others | 0% | 5.5% |
| LTV | 67% | 59% |
| Yield | 8.4% | 8.8% |
| Debt to Capital | 34% | 20% |
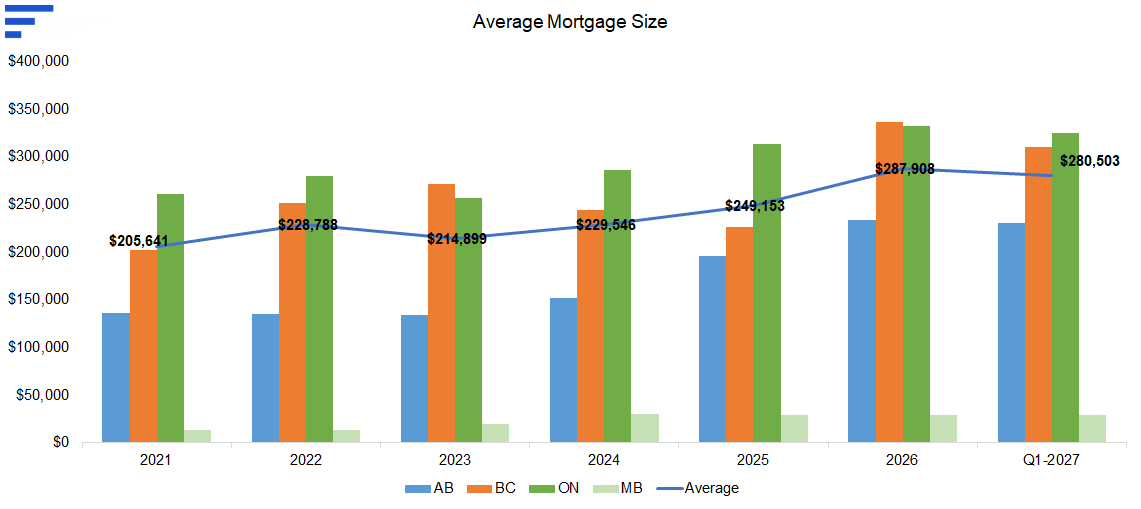
| Average Loan Size | $280,503 | $471,738 |
| Stage Three % of Mortgages | 8.5% | 5.6% |
| Allowances % of Mortgages | 0.8% | 0.8% |
In 2025, Alta West Mortgage Capital Corporation (AWM’s manager) acquired Premiere Home Mortgage for an undisclosed amount. In addition to AWM, the manager currently operates Premiere ($138M in AUM), and First Place MIC ($26M in AUM), as of August 31, 2026.
The sector has also seen other material transactions. In October 2025, Neighbourhood Holdings acquired Fisgard Asset Management for an undisclosed amount, creating one of Canada’s largest alternative mortgage lenders, with over $750M in AUM across 1,550 mortgages.
Our discussions with MIC managers indicate that several are actively pursuing M&A to scale their platforms, capture synergies, and reduce costs across administration, operations, and staffing. We believe these efficiencies could support higher yields and attract additional capital to the sector.
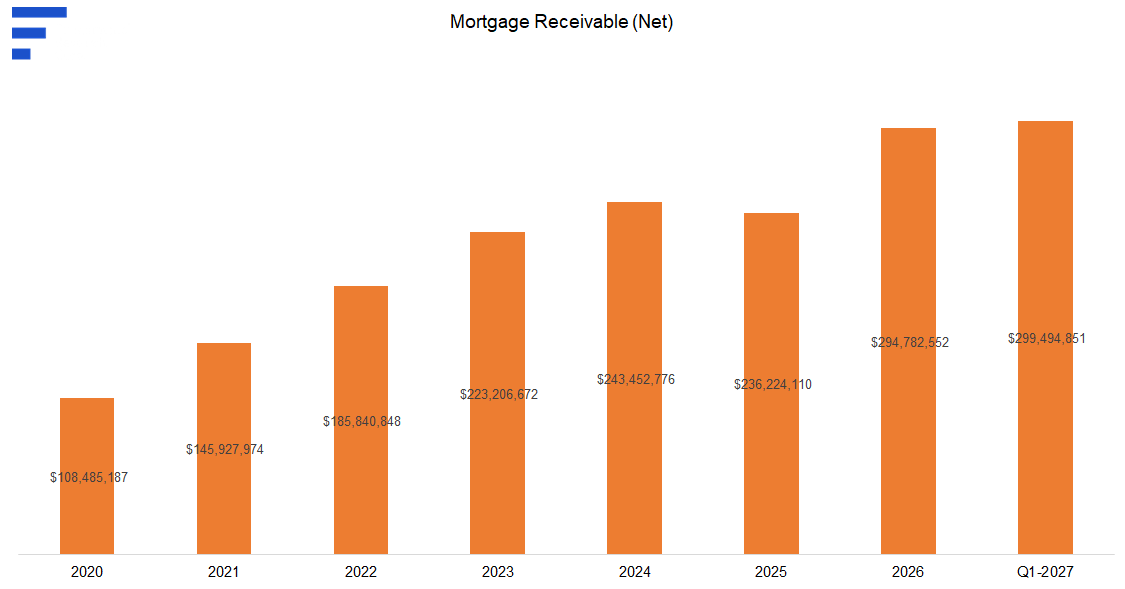
Mortgage receivables ↑25% YoY to a record-high $295M in FY2026, driven by robust originations.
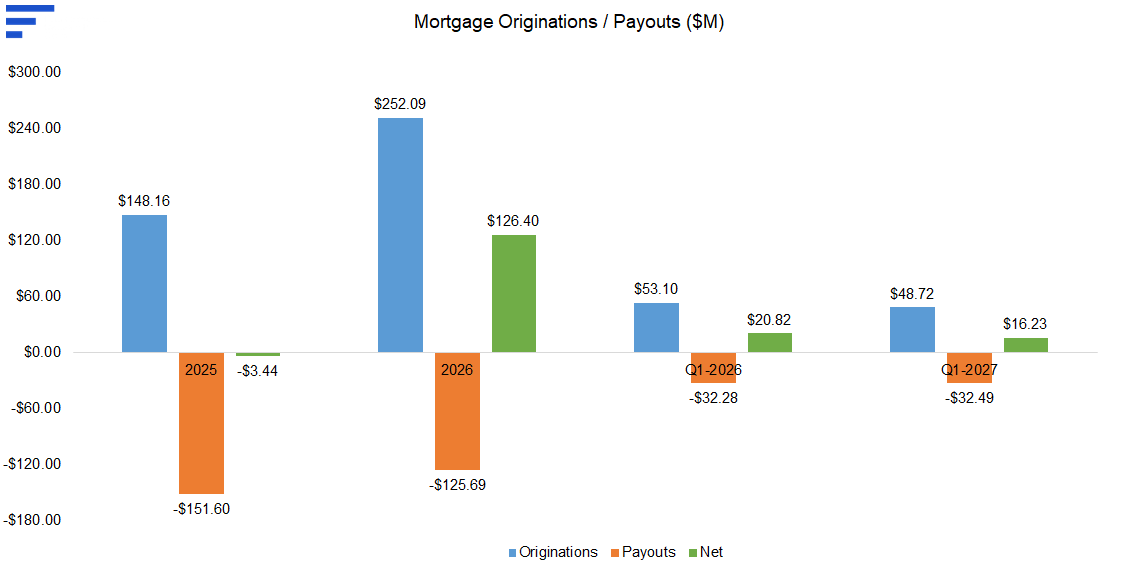
Mortgage advances ↑70% YoY in FY2026, while payouts ↓17% YoY.
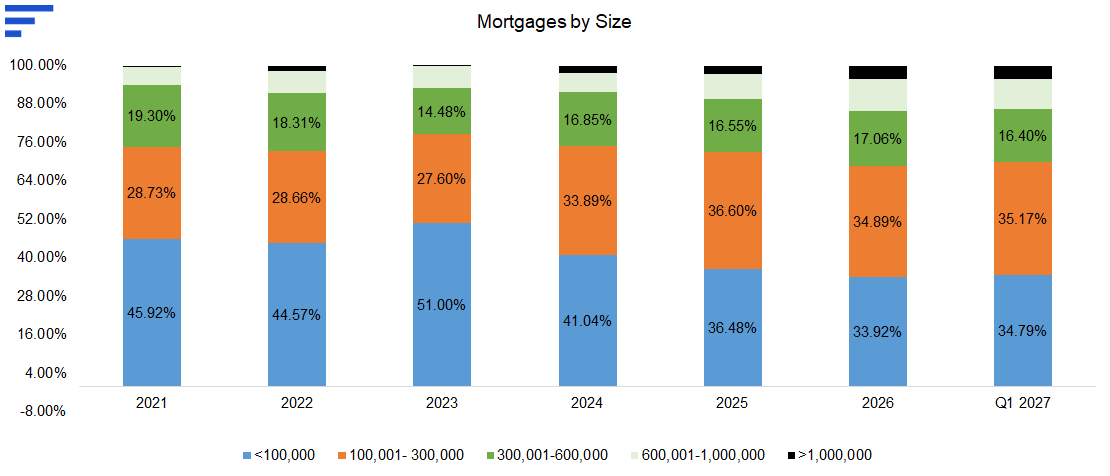
Average mortgage size ↑15% YoY to $287K in FY2026.
At the end of Q1-FY2027, 70% of mortgages were <$300K vs. 81% historically.
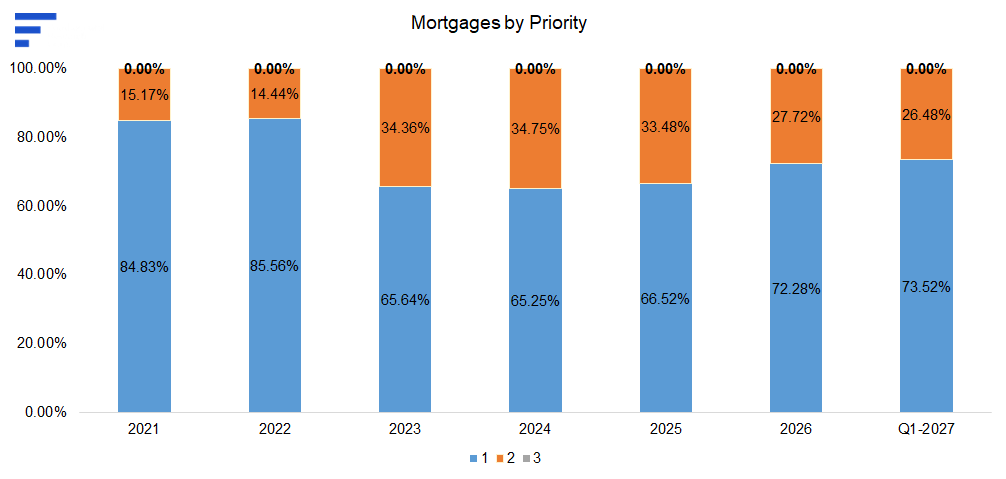
First-mortgage exposure ↑ to 74% vs. 64% historically, implying a lower-risk profile.
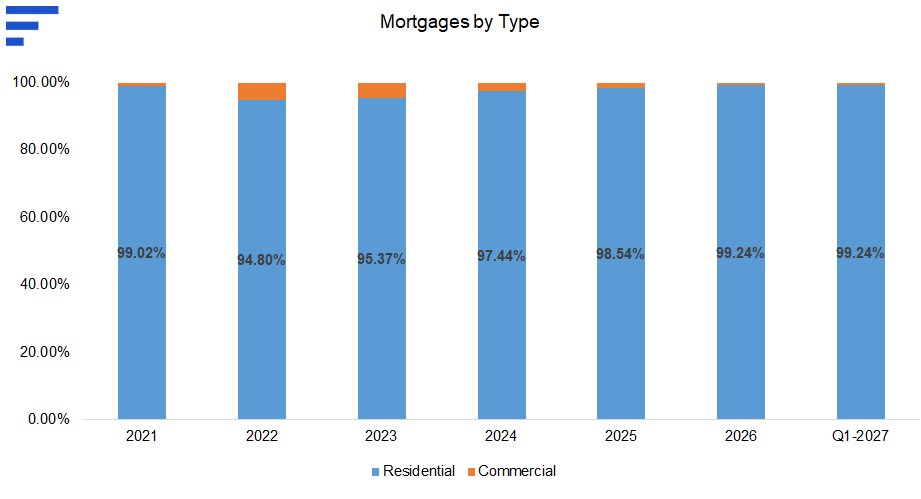
Focus remains on single-family, owner-occupied units.
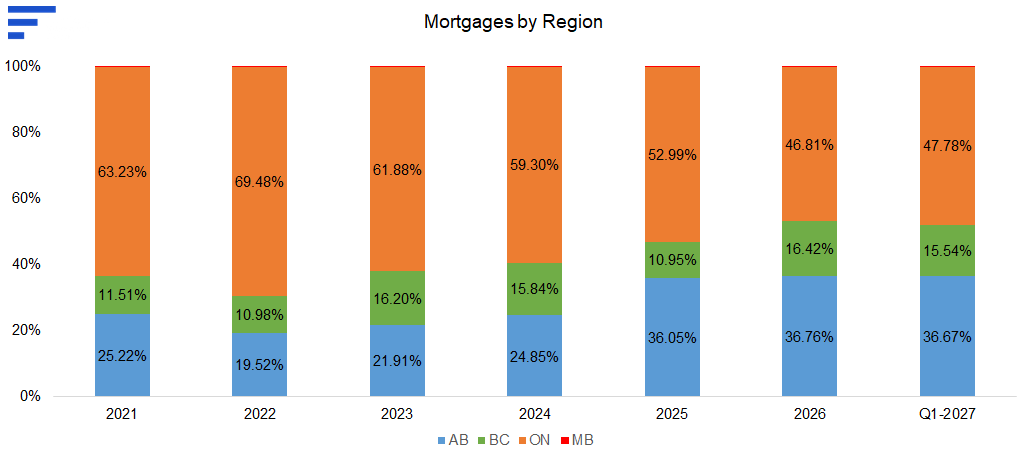
Enhanced geographical diversification by lowering exposure to ON. Also, focus remains on urban areas.
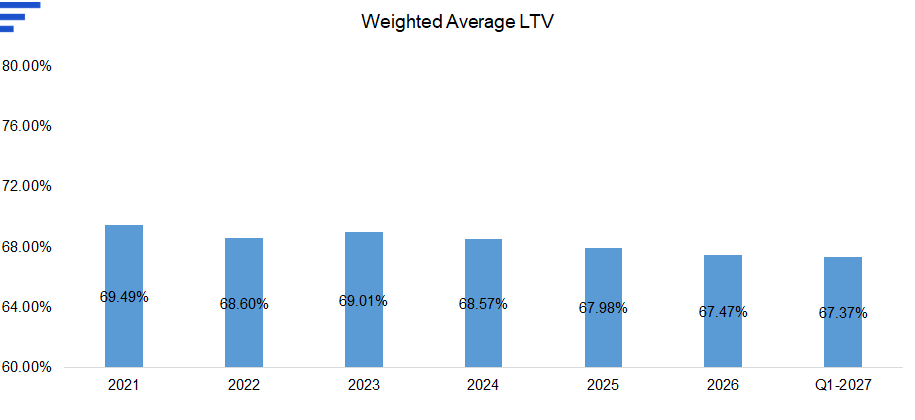
LTV was down slightly.
Impaired mortgages ↓5.3 pp YoY, to 8.5% of total mortgages, but remain above the sector average of 6%. Loan loss allowances ↑6 bps YoY to 0.80%, vs. the sector average of 0.78%.
| 2021 | 2022 | 2023 | 2024 | 2025 | 2026 | |
|---|---|---|---|---|---|---|
| Loan loss allowances (end of period) | $1,797,375 | $1,196,105 | $1,000,272 | $1,670,652 | $1,757,341 | $2,353,696 |
| % of Total Mortages | 1.23% | 0.64% | 0.45% | 0.69% | 0.74% | 0.80% |
| Actual/Realized Losses | $653,370 | $75,258 | $11,523 | $697,497 | $1,106,957 | $1,512,385 |
| % of Total Mortages | 0.51% | 0.05% | 0.01% | 0.30% | 0.46% | 0.57% |
| Impaired Mortgages | $6,732,514 | $7,734,025 | $16,899,428 | $19,879,046 | $32,661,180 | $25,018,137 |
| % of Total Mortages | 4.6% | 4.2% | 7.6% | 8.2% | 13.8% | 8.5% |
In summary, we believe the portfolio’s risk profile has declined, driven by lower impaired mortgages, and higher first-mortgage exposure.
| Parameter | Risk Profile |
|---|---|
| Average Mortgage | ↑ (red) |
| Diversification | ↑ (green) |
| Priority | ↑ (green) |
| Property Type (lower-risk properties) | – |
| LTV | ↓ (green) |
| Impaired (Stage 3) % of Total Mortgages | ↓ (green) |
| Debt to Capital | ↑ (red) |
Investors hold Class B shares, allowing them to request redemptions monthly without incurring fees, or facing a lock-up period. In contrast, it is noteworthy to mention that many MICs typically impose lock-up periods, and early redemption fees. That said, redemptions are not guaranteed.
Net income (before investor distributions) ↓5% YoY to $13M, 8% below our forecast, due to lower than expected lending rates, and higher loan loss provisions. However, yield ↓1 pp YoY to 8.36%, exactly in line with our estimate.
| Income Statement (YE - Mar 31) | 2023 | 2024 | 2025 | 2026 | YoY | Q1-2027 |
|---|---|---|---|---|---|---|
| Interest | $17,602,235 | $22,742,841 | $23,681,668 | $21,600,640 | -9% | $5,701,811 |
| Lender Fees | $830,185 | $1,606,263 | $1,226,325 | $1,923,530 | 57% | $512,059 |
| Revenue | $18,432,420 | $24,349,104 | $24,907,993 | $23,524,170 | -6% | $6,213,870 |
| G&A and Others | $576,830 | $867,055 | $693,706 | $642,627 | -7% | $134,182 |
| Manager's fees | $2,465,432 | $2,849,176 | $3,145,530 | $3,558,351 | 13% | $911,173 |
| Interest | $5,775,267 | $7,543,336 | $6,449,420 | $4,499,531 | -30% | $1,211,282 |
| Interest (Investors) | $9,776,858 | $11,660,381 | $13,171,484 | $13,663,400 | 4% | $3,447,711 |
| Loan loss provision | -$184,310 | $1,367,878 | $1,168,001 | $2,030,604 | 74% | |
| Expenses | $18,410,077 | $24,287,826 | $24,628,141 | $24,394,513 | -1% | $5,704,348 |
| Net Income (Loss) - before distributions | $9,799,201 | $11,721,659 | $13,451,336 | $12,793,057 | -5% | $3,957,233 |
| Net Income (after distributions) | $22,343 | $61,278 | $279,852 | -$870,343 | N/A | $509,522 |
| % of Mortgage Receivables (net) | 2023 | 2024 | 2025 | 2026 | Q1-2027 |
|---|---|---|---|---|---|
| Revenues | 9.01% | 10.44% | 10.90% | 10.18% | 9.99% |
| Less: | |||||
| G&A and Others | 0.28% | 0.37% | 0.30% | 0.28% | 0.22% |
| Manager's fees | 1.21% | 1.22% | 1.38% | 1.54% | 1.46% |
| Interest | 2.82% | 3.23% | 2.82% | 1.95% | 1.95% |
| Loan loss provision | -0.09% | 0.59% | 0.51% | 0.88% | 0.00% |
| Net Income (before distributions) | 4.79% | 5.02% | 5.89% | 5.54% | 6.36% |
| Investors' Returns (% of Invested Capital) | 8.01% | 8.55% | 8.62% | 8.10% | 8.0% |
| Yield (Simple) | 8.07% | 8.67% | 8.97% | 8.05% | 7.88% |
| Yield (Compounded) | 8.38% | 9.02% | 9.34% | 8.36% | 8.17% |
Note that the above figures may be slightly different from the figures reported by the MIC due to the difference in the method of calculation. We used the average of the opening balance, and year-end balance of mortgages outstanding, and invested capital, to arrive at the above figures.
Dividends are paid monthly.
$300M in mortgages at the end of Q1-FY2027, ↑27% since FY2025-end. Additionally, debt-to-capital ↑9 pp to 34%, within the typical 20–40% range for peers.
| Balance Sheet (YE - Mar 31) | 2023 | 2024 | 2025 | 2026 | Q1-2027 |
|---|---|---|---|---|---|
| Cash and Equivalents | $13,321,354 | $3,241,559 | $6,984,528 | $4,846,639 | $3,315,600 |
| Interest and other receivables | $1,620,149 | $2,013,407 | $8,779,045 | $14,301,867 | $15,513,346 |
| Prepaid | $158,521 | $93,230 | |||
| Mortgage Receivables (net) - Div 3 | $22,734,760 | $46,301,679 | $50,357,217 | ||
| Mortgage Receivables (net) | $223,206,672 | $243,452,776 | $213,489,350 | $248,480,873 | $249,289,637 |
| Total Assets | $238,306,696 | $248,800,972 | $251,987,683 | $313,931,058 | $318,475,800 |
| A/P | $1,314,026 | $1,681,723 | $1,345,136 | $1,577,943 | $473,665 |
| Debt | $104,595,783 | $104,359,173 | $62,067,252 | $92,137,081 | $94,027,248 |
| Debt - Div 3 | $17,858,065 | $36,758,026 | $40,150,210 | ||
| Due from Div 3 | $4,876,695 | $9,543,653 | $10,207,007 | ||
| Related Parties | $434,169 | $248,151 | $572,709 | $388,893 | |
| Total Liabilities | $106,343,978 | $106,289,047 | $86,719,857 | $140,405,596 | $144,858,130 |
| Share Capital | $131,109,227 | $141,597,156 | $164,073,205 | $173,201,770 | $173,293,393 |
| Retained Earnings (Defecit) | $853,491 | $914,769 | $1,194,621 | $323,692 | $324,277 |
| Total SE | $131,962,718 | $142,511,925 | $165,267,826 | $173,525,462 | $173,617,670 |
| Total Liabilities and SE | $238,306,696 | $248,800,972 | $251,987,683 | $313,931,058 | $318,475,800 |
| Debt to Capital | 41% | 42% | 25% | 34% | 34% |
*MICs generally do not hold significant cash, and instead use excess cash to pay down debt. In our discussions with management, the high cash position at year-end was merely due to timing differences, as the MIC had to hold cash to fund mortgages.
With rates peaking last year, we expect yields to decline in FY2027. Specifically, we are projecting a yield of 7.93% in FY2027 vs. 8.36% in FY2026.
| Key Financials (YE: Mar 31st) | FY2024 | FY2025 | FY2026 | FY2027 | FY2028 |
|---|---|---|---|---|---|
| Mortgage Receivables (Net) | $243,452,776 | $236,224,110 | $294,782,552 | $307,206,596 | $320,251,841 |
| Debt to Capital | 42% | 25% | 34% | 33% | 33% |
| Revenue | $24,349,104 | $24,907,993 | $23,524,170 | $24,792,519 | $25,405,616 |
| Net Profit (before paying investors) | $11,721,659 | $13,451,336 | $12,793,057 | $13,650,678 | $13,893,384 |
| Yield (compounded) | 9.02% | 9.34% | 8.36% | 7.93% | 7.65% |
Our FY2027 yield estimate varies between 6.84% and 8.58%, as loan loss provisions and lending rates vary.
| FY2027E Yield | YoY Decline in the Weighted Average Lending Rate in FY2027E | |||||
|---|---|---|---|---|---|---|
| 0.00% | 0.25% | 0.45% | 0.70% | 0.95% | ||
| Loan Loss Provisions % of Receivables (FY2027E) | 0.00% | 9.29% | 8.94% | 8.65% | 8.30% | 7.94% |
| 0.25% | 8.93% | 8.58% | 8.29% | 7.94% | 7.58% | |
| 0.50% | 8.57% | 8.21% | 7.93% | 7.57% | 7.22% | |
| 1.00% | 7.84% | 7.48% | 7.20% | 6.84% | 6.49% | |
| 2.00% | 6.38% | 6.03% | 5.74% | 5.39% | 5.03% | |
AWM continues to deliver strong portfolio growth, while its improving risk profile, and higher first-mortgage exposure provide greater resilience despite elevated impaired mortgages. With rates in 2027 expected to remain materially below recent highs, we expect improving mortgage origination activity, and lower default risk, supporting the portfolio’s overall credit quality.
| FRC Rating | |
|---|---|
| Expected Yield (FY2027E) | 7.93% |
| Rating | 2 |
| Risk | 2 |
We believe the MIC is exposed to the following key risks:
| Income Statement (YE - Mar 31) | 2023 | 2024 | 2025 | 2026 | 2027E | 2028E |
|---|---|---|---|---|---|---|
| Interest | $17,602,235 | $22,742,841 | $23,681,668 | $21,600,640 | $23,057,043 | $23,627,223 |
| Lender Fees | $830,185 | $1,606,263 | $1,226,325 | $1,923,530 | $1,735,476 | $1,778,393 |
| Revenue | $18,432,420 | $24,349,104 | $24,907,993 | $23,524,170 | $24,792,519 | $25,405,616 |
| G&A and Others | $576,830 | $867,055 | $693,706 | $642,627 | $636,732 | $668,569 |
| Manager's fees | $2,465,432 | $2,849,176 | $3,145,530 | $3,558,351 | $3,820,393 | $4,011,413 |
| Interest | $5,775,267 | $7,543,336 | $6,449,420 | $4,499,531 | $5,380,191 | $5,462,500 |
| Interest (Investors) | $9,776,858 | $11,660,381 | $13,171,484 | $13,663,400 | $13,582,424 | $13,823,917 |
| Loan loss provision | -$184,310 | $1,367,878 | $1,168,001 | $2,030,604 | $1,304,525 | $1,369,751 |
| Expenses | $18,410,077 | $24,287,826 | $24,628,141 | $24,394,513 | $24,724,266 | $25,336,149 |
| Net Income (Loss) - before distributions | $9,799,201 | $11,721,659 | $13,451,336 | $12,793,057 | $13,650,678 | $13,893,384 |
| Net Income (after distributions) | $22,343 | $61,278 | $279,852 | -$870,343 | $68,253 | $69,467 |
| Balance Sheet (YE - Mar 31) | 2023 | 2024 | 2025 | 2026 | 2027E | 2028E |
|---|---|---|---|---|---|---|
| Cash and Equivalents | $13,321,354 | $3,241,559 | $6,984,528 | $4,846,639 | $4,717,572 | $1,073,787 |
| Interest and other receivables | $1,620,149 | $2,013,407 | $8,779,045 | $14,301,867 | $15,016,960 | $15,767,808 |
| Prepaid | $158,521 | $93,230 | ||||
| Mortgage Receivables (net) - Div 3 | $22,734,760 | $46,301,679 | $46,301,679 | $46,301,679 | ||
| Mortgage Receivables (net) | $223,206,672 | $243,452,776 | $213,489,350 | $248,480,873 | $260,904,917 | $273,950,162 |
| Total Assets | $238,306,696 | $248,800,972 | $251,987,683 | $313,931,058 | $326,941,128 | $337,093,436 |
| A/P | $1,314,026 | $1,681,723 | $1,345,136 | $1,577,943 | $1,656,840 | $1,739,682 |
| Debt | $104,595,783 | $104,359,173 | $62,067,252 | $92,137,081 | $95,000,000 | $95,000,000 |
| Debt - Div 3 | $17,858,065 | $36,758,026 | $36,758,026 | $36,758,026 | ||
| Due from Div 3 | $4,876,695 | $9,543,653 | $9,543,653 | $9,543,653 | ||
| Related Parties | $434,169 | $248,151 | $572,709 | $388,893 | $388,893 | $388,893 |
| Total Liabilities | $106,343,978 | $106,289,047 | $86,719,857 | $140,405,596 | $143,347,412 | $143,430,254 |
| Share Capital | $131,109,227 | $141,597,156 | $164,073,205 | $173,201,770 | $183,201,770 | $193,201,770 |
| Retained Earnings (Defecit) | $853,491 | $914,769 | $1,194,621 | $323,692 | $391,945 | $461,412 |
| Total SE | $131,962,718 | $142,511,925 | $165,267,826 | $173,525,462 | $183,593,715 | $193,663,182 |
| Total Liabilities and SE | $238,306,696 | $248,800,972 | $251,987,683 | $313,931,058 | $326,941,128 | $337,093,436 |
| Debt to Capital | 41% | 42% | 25% | 34% | 33% | 33% |
Even though the Manager has rights to 100% of lender fees, they have historically paid a portion of the fees to the fund, which we view positively from an investor perspective. We also understand that there is no guarantee that management will do so going forward.
| Cash Flow (YE - Mar 31) | 2027E | 2028E |
|---|---|---|
| Net Income (Loss) | $68,253 | $69,467 |
| Non-Cash Items | ||
| Change in WC | -$636,196 | -$668,006 |
| Cash from Operating Activities | -$567,943 | -$598,539 |
| Equity | $10,000,000 | $10,000,000 |
| Debt | $2,862,919 | $0 |
| Cash from Financing Activities | $12,862,919 | $10,000,000 |
| Increase in mortgage loans (net) | -$12,424,044 | -$13,045,246 |
| Cash from Investing Activities | -$12,424,044 | -$13,045,246 |
| FRC Distribution of Ratings | |||
|---|---|---|---|
| Rating - 1 | 0% | Risk - 1 | 0% |
| Rating - 2 | 34% | Risk - 2 | 10% |
| Rating - 3 | 45% | Risk - 3 | 42% |
| Rating - 4 | 8% | Risk - 4 | 31% |
| Rating - 5 | 4% | Risk - 5 | 7% |
| Rating - 6 | 1% | Suspended | 9% |
| Rating - 7 | 0% | ||
| Suspended | 9% | ||
Sid Rajeev, B.Tech, MBA, CFA — Head of Research, Fundamental Research Corp.
The full report — the designed PDF with all charts and the complete disclosure — remains available as published, free of charge with a free account. This page is the same analysis in the form a search engine, an AI assistant and a phone screen can read.
Disclosures. Fees ranging between $10,000 and $20,000 have been paid to FRC by AWM Diversified MIC to commission this report, research coverage, and distribution of reports. This fee creates a potential conflict of interest which readers should consider. The analyst and Fundamental Research Corp. “FRC” do not own any shares of the subject company, do not make a market or offer shares for sale of the subject company, and do not have any investment banking business with the subject company. Rating – 2: Very Good Return to Risk Ratio. A “+” indicates the rating is in the top third of the category, A “-“ indicates the lower third and no “+” or “-“ indicates the middle third of the category. Fundamental Research Corp. Risk Rating Scale: 2 (Below Average Risk). ALWAYS TALK TO YOUR FINANCIAL ADVISOR BEFORE YOU INVEST.
M&A Momentum Among MICs Could Boost Yields and Attract Capital
Paused · 9:51 left · FRC · read by an AI voice


Discussion
Comments reflect the views of individual users, not FRC. Nothing posted in the comments section — by users or otherwise — should be taken as investment advice.