
We are continuing to run our valuation models assuming Tesla will capture 40% of the global EV market (12% of global auto sales) by 2030. Our revised DCF valuation is $157/share (previously $207/share), which is 3% below the current share price of $162.
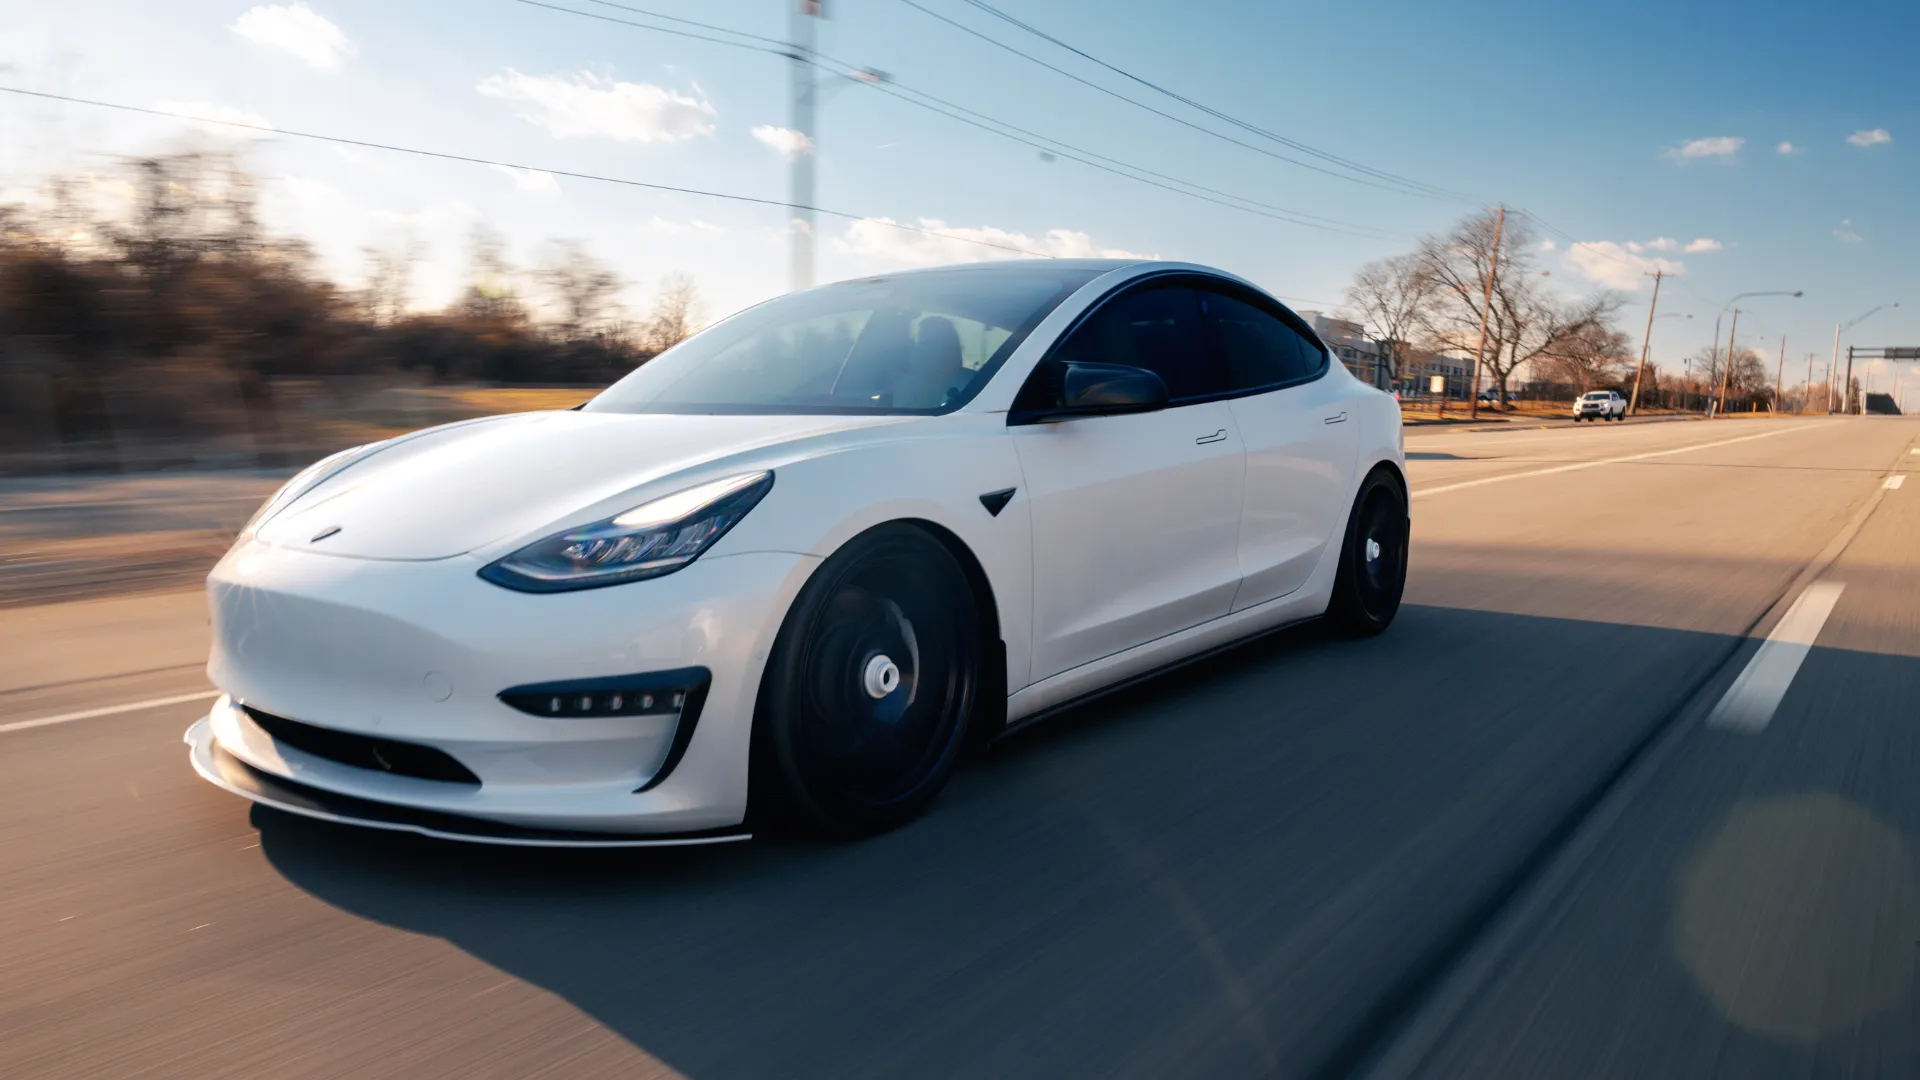
Based on our revised fair value estimate of $157/share, we believe the shares are fully valued.
Paused · 7:11 left · FRC · read by an AI voice
Disclosure: See the disclosures at the end of this report, and the last page of the PDF, for important disclosures, rating, and risk definitions.
All figures in US$ unless otherwise specified.
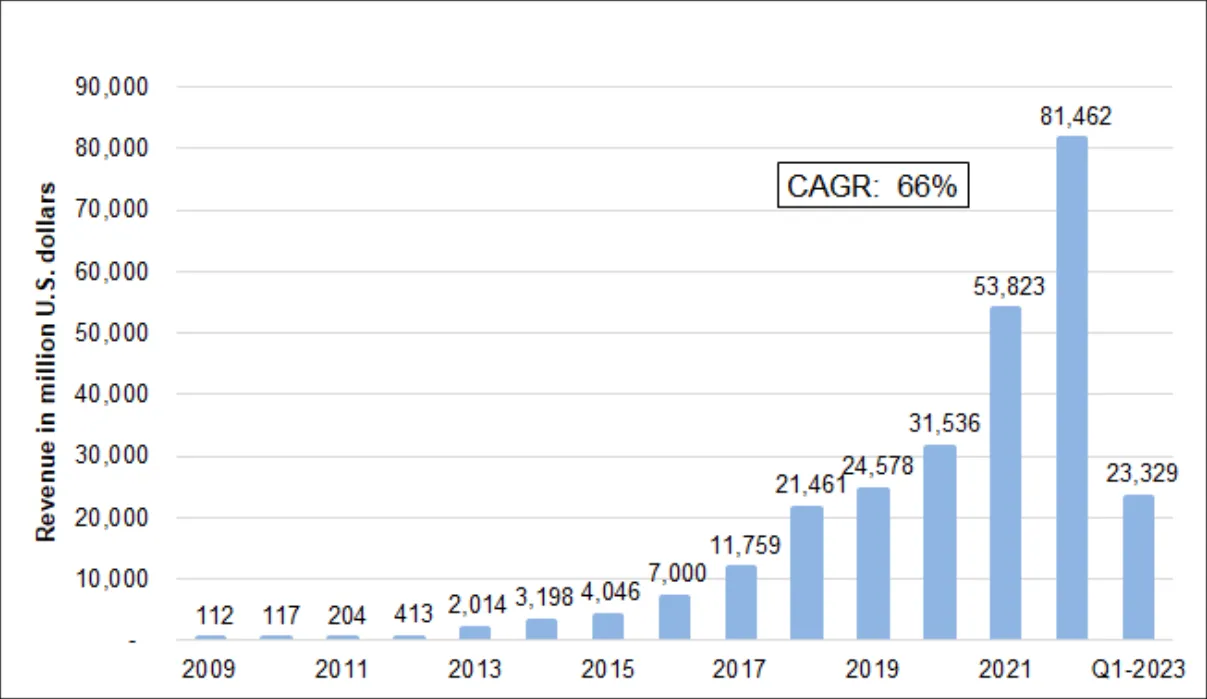
Founded in 2003. Then, started generating meaningful revenue in 2009. From 2009 to 2022, vehicle sales grew at a CAGR of 75%. In Q1-2023, sales were up 36% YoY, to 423M units. Also, from 2009 to 2022, revenue grew 66% p.a.
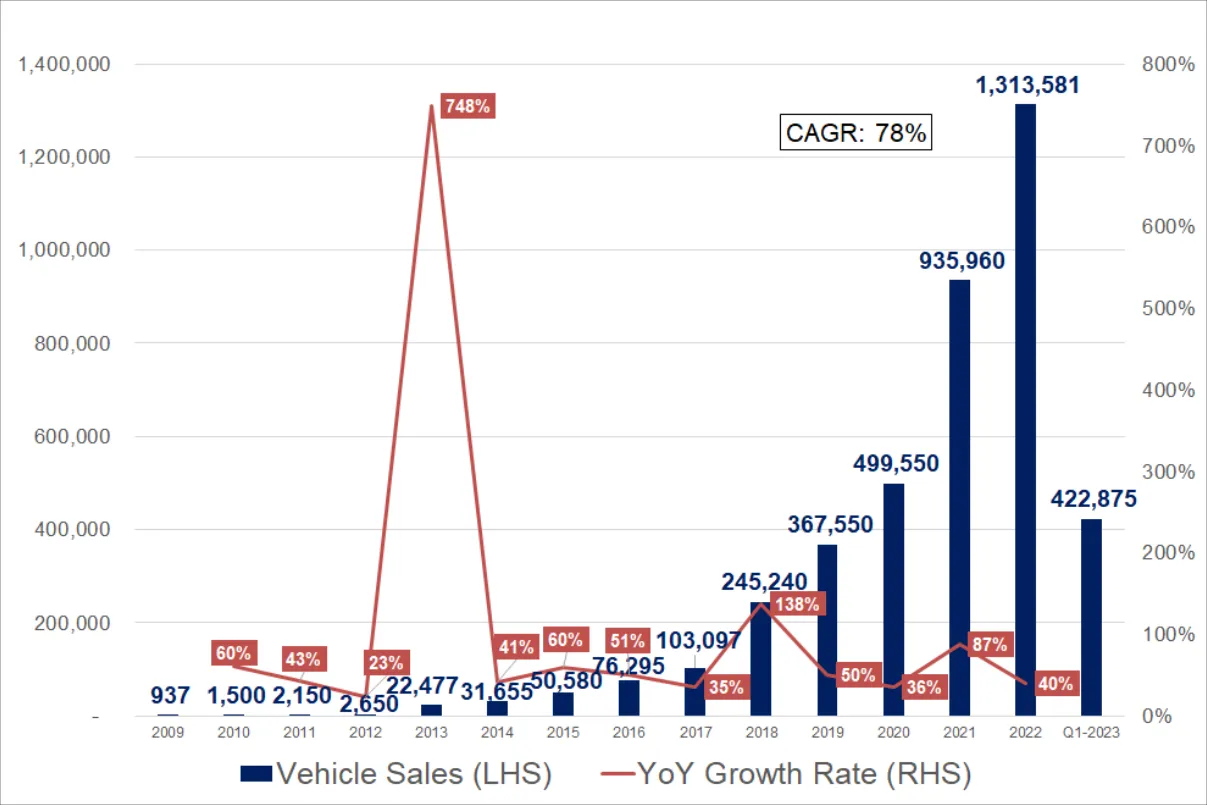
In 2022, Tesla’s sales were 13% (9% in 2021) of the world’s largest car manufacturer (Toyota), and 33% (14% in 2021) of the fifth largest (Hyundai/KOSE: A005380).
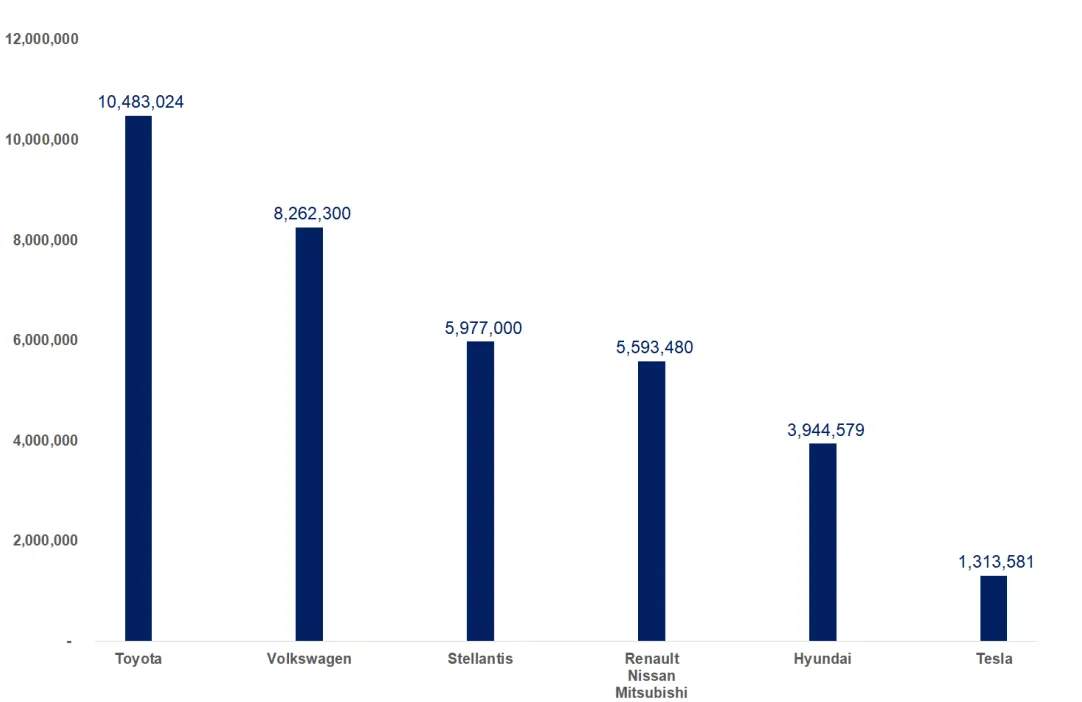
Additionally, Tesla’s revenue is lower than the top five legacy automakers.
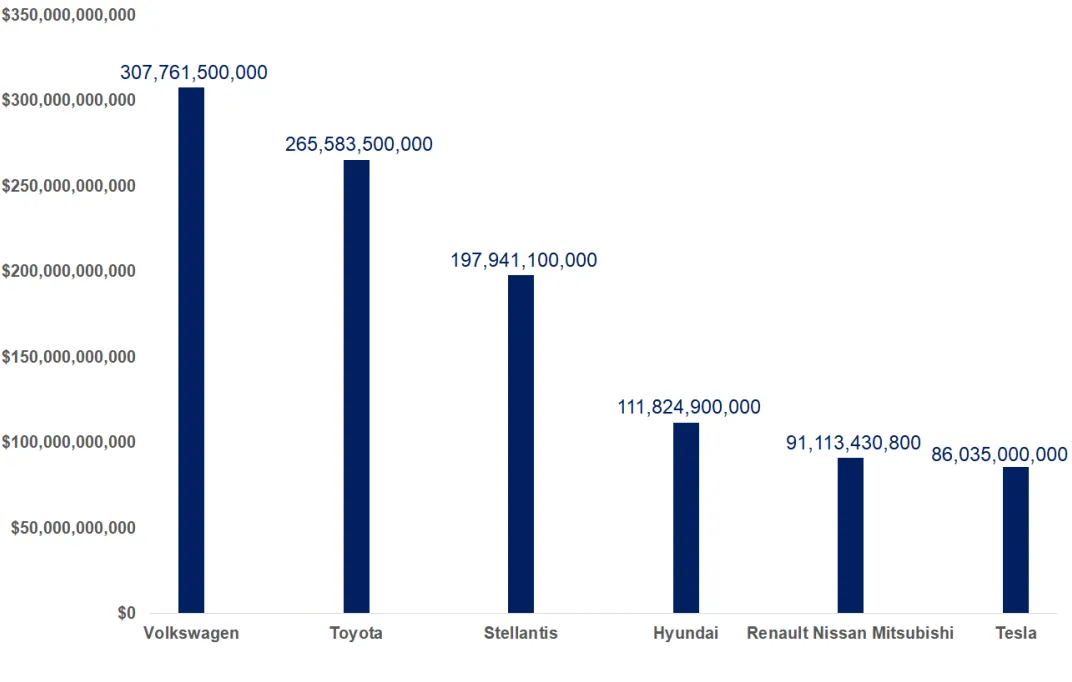
However, Tesla’s Enterprise Value (EV) is significantly higher – 1.6x that of Toyota.
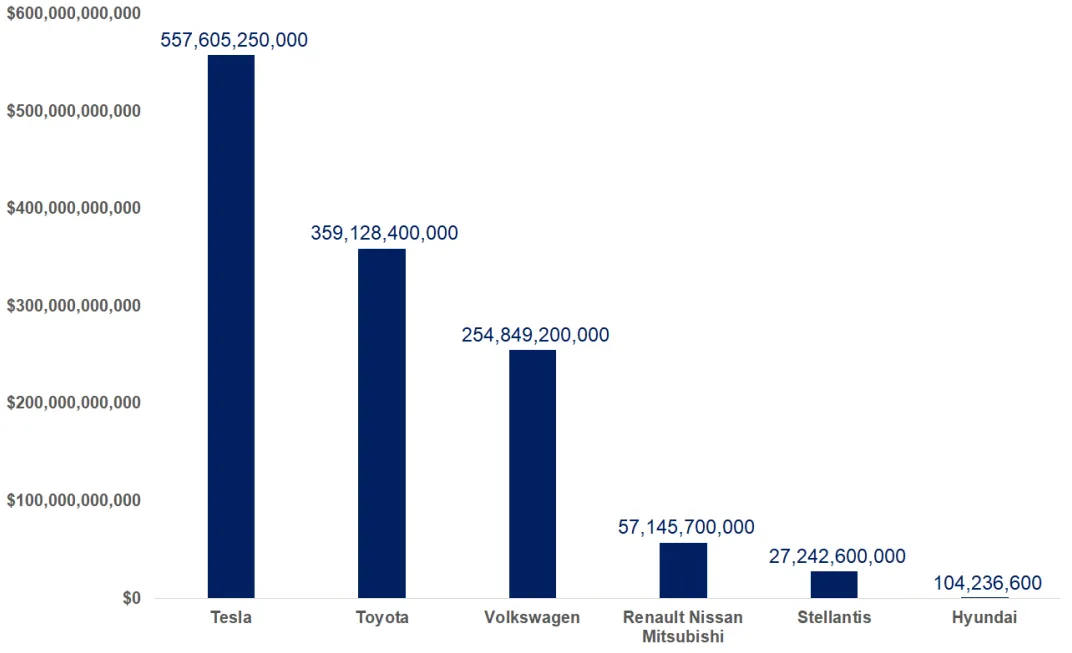
Tesla’s valuation multiples are significantly higher as well.
| Comparables | EV/R (forward) | P/E (forward) |
|---|---|---|
| Hyundai | 0.90x | 4.97x |
| Renault Nissan Mitsubishi | 0.68x | 6.49x |
| Stellantis | 0.14x | 3.14x |
| Toyota | 1.33x | 10.49x |
| Volkswagen | 0.78x | 3.99x |
| Average | 0.73x | 6.03x |
| Tesla | 6.48x | 45.36x |
Tesla became the largest car manufacturer by MCAP in 2020.
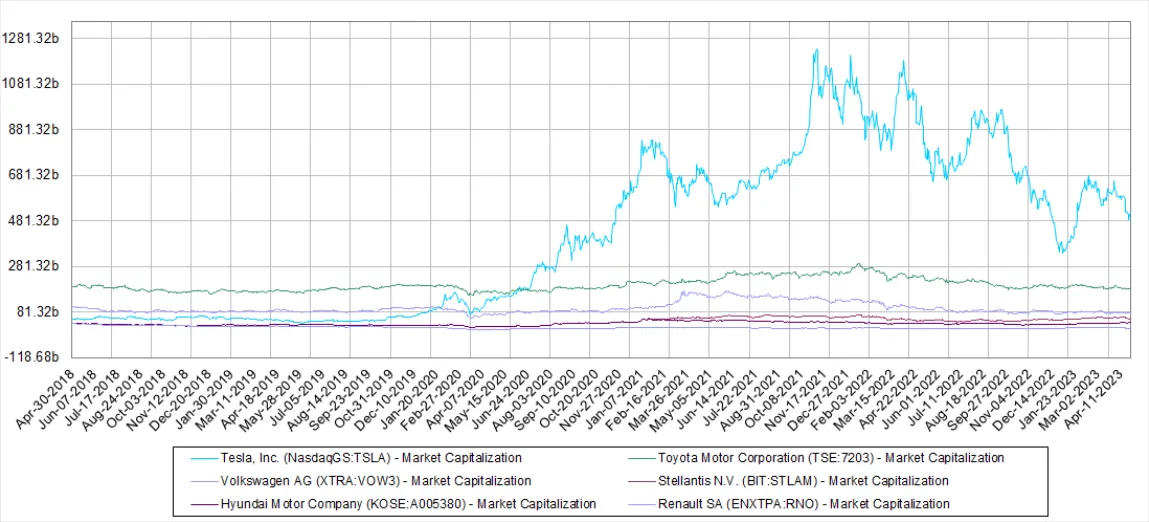
All of the leading players are investing heavily in the EV space.
| Manufacturer | CAPEX Budgets | New EV Models |
|---|---|---|
| Toyota | $35B: 2022-2030 | 30 by 2030 |
| Volkswagen | $200B: 2023-2028 | 10 by 2026 |
| Stellantis | $36B: 2021-2025 | 25 by 2030 |
| Nissan, Mitsubishi, Renault | $26B: 2022-2030 | 35 by 2030 |
| Hyundai | $16B: 2022-2030 | 17 by 2030 |
| Tesla | $8B: 2023-2025 | Launch a compact car or hatchback in 2024 |
In the following sections, we reviewed Tesla’s key operating metrics.
Tesla has higher than average margins, lower debt levels, and higher profitability ratios. However, Tesla gross margins have been trending lower (25% in 2021, to 19% in Q1-2023). We are expecting margins to shrink further as Tesla has been lowering vehicle prices.
| Last 12 Months | Toyota | Volkswagen | Renault Nissan Mitsubishi | Hyundai | Stellantis | Average | Tesla |
|---|---|---|---|---|---|---|---|
| Operating Metrics | |||||||
| Gross Margin | 17.2% | 17.7% | 16.3% | 20.2% | 19.7% | 19.0% | 23.1% |
| EBITDA Margin | 11.9% | 12.5% | 6.9% | 7.7% | 14.1% | 12.1% | 19.4% |
| Capital Structure | |||||||
| Debt/Capital | 50.0% | 53.5% | 55.2% | 55.1% | 27.3% | 41.9% | 10.2% |
| Current Ratio | 1.1x | 1.2x | 1.7x | 1.3x | 1.3x | 1.4x | 1.6x |
| EBIT Interest Coverage | 22.2x | 52.2x | 5.6x | 21.4x | 20.6x | 21.4x | 80.2x |
| Profitability Ratios | |||||||
| ROE | 9.0% | 9.8% | 2.9% | 10.9% | 26.1% | 8.2% | 28.0% |
| ROA | 2.4% | 2.6% | 1.3% | 2.5% | 7.3% | 2.2% | 10.4% |
| ROC | 3.0% | 3.9% | 1.8% | 3.6% | 13.9% | 3.1% | 16.4% |
As a result, we are lowering our base-case DCF valuation from $207/share to $157/share.
| STATEMENTS OF OPERATIONS (US$) YE Dec 31 | 2023E | 2024E | 2025E | 2026E | 2027E | 2028E | 2029E | 2030E |
|---|---|---|---|---|---|---|---|---|
| Global EV Sales Projections | 11,671,517 | 13,225,662 | 14,986,752 | 16,982,344 | 19,243,662 | 21,806,091 | 24,709,726 | 28,000,000 |
| Tesla Market Share | 14% | 18% | 19% | 22% | 25% | 30% | 34% | 40.0% |
| Tesla Vehicle Sales | 1,624,338 | 2,314,491 | 2,820,069 | 3,715,792 | 4,896,019 | 6,451,114 | 8,500,146 | 11,200,000 |
| Average Price Per Vehicle | $62,015 | $55,814 | $49,674 | $44,210 | $39,347 | $35,019 | $31,167 | $27,738 |
| Revenue | 100,733,676,756 | 129,180,272,047 | 140,084,634,442 | 164,275,257,787 | 192,643,257,618 | 225,910,007,421 | 264,921,451,619 | 310,669,617,204 |
| Total Revenues | 100,733,676,756 | 129,180,272,047 | 140,084,634,442 | 164,275,257,787 | 192,643,257,618 | 225,910,007,421 | 264,921,451,619 | 310,669,617,204 |
| COGS | 81,255,361,533 | 104,201,395,661 | 112,997,241,670 | 132,510,257,664 | 155,392,893,903 | 182,227,035,863 | 213,695,052,363 | 250,597,147,608 |
| Gross Profit | 19,478,315,223 | 24,978,876,386 | 27,087,392,772 | 31,765,000,123 | 37,250,363,715 | 43,682,971,558 | 51,226,399,256 | 60,072,469,596 |
| R&D | 2,921,250,000 | 2,841,965,985 | 2,801,692,689 | 3,285,505,156 | 3,852,865,152 | 4,518,200,148 | 5,298,429,032 | 6,213,392,344 |
| SG&A | 4,225,050,000 | 6,459,013,602 | 7,004,231,722 | 8,213,762,889 | 9,632,162,881 | 11,295,500,371 | 13,246,072,581 | 15,533,480,860 |
| EBITDA | 12,332,015,223 | 15,677,896,798 | 17,281,468,361 | 20,265,732,078 | 23,765,335,682 | 27,869,271,039 | 32,681,897,643 | 38,325,596,392 |
| D&A | - | - | - | - | - | - | - | - |
| EBIT | 12,332,015,223 | 15,677,896,798 | 17,281,468,361 | 20,265,732,078 | 23,765,335,682 | 27,869,271,039 | 32,681,897,643 | 38,325,596,392 |
| Net interest and other income | 63,000,000 | 63,000,000 | 63,000,000 | 63,000,000 | 63,000,000 | 63,000,000 | 63,000,000 | 63,000,000 |
| EBT | 12,395,015,223 | 15,740,896,798 | 17,344,468,361 | 20,328,732,078 | 23,828,335,682 | 27,932,271,039 | 32,744,897,643 | 38,388,596,392 |
| Income tax expense | 1,239,501,522 | 1,574,089,680 | 3,642,338,356 | 4,269,033,736 | 5,003,950,493 | 5,865,776,918 | 6,876,428,505 | 8,061,605,242 |
| Unusual/Non-recurring expense | - | - | - | - | - | - | - | - |
| Net Income (Net Loss) | 11,155,513,701 | 14,166,807,119 | 13,702,130,005 | 16,059,698,342 | 18,824,385,189 | 22,066,494,120 | 25,868,469,138 | 30,326,991,150 |
| EPS | 3.52 | 4.47 | 4.32 | 5.07 | 5.94 | 6.96 | 8.16 | 9.57 |
Currently, Tesla accounts for 13% of global EV sales, or 2% of global vehicle sales. We are continuing to assume Tesla will capture 40% of the global EV market, and 12% of the global auto market by 2030.
| DCF Model | 2023E | 2024E | 2029E | 2030E | Terminal |
|---|---|---|---|---|---|
| EBIT(1-tax) | 8,701,213,701 | 14,110,107,119 | 25,818,699,138 | 30,277,221,150 | |
| Non-Cash Expenses | - | - | - | - | |
| Change in Working Capital | (2,860,141,522) | (3,448,924,408) | (7,532,637,050) | (5,696,130,318) | |
| Cash from Operations | 5,841,072,179 | 10,661,182,710 | 18,286,062,088 | 24,581,090,831 | |
| CAPEX | (3,927,000,000) | (6,000,000,000) | (4,818,166,667) | (4,818,166,667) | |
| Free Cash Flow | 1,914,072,179 | 4,661,182,710 | 13,467,895,422 | 19,762,924,164 | |
| Present Value | 1,832,225,453 | 4,209,309,530 | 9,088,352,117 | 12,581,451,516 | 431,963,168,713 |
| DCF Model | |
|---|---|
| Discount Rate | 6.0% |
| Terminal Growth | 3.0% |
| Present Value | 484,406,292,194 |
| Cash - Debt | 13,372,000,000 |
| Fair Value | 497,778,292,194 |
| Shares O/S | 3,169,504,301 |
| DCF Value per Share (US$) | $157.05 |
Our valuation ranges between $32 and $332 per share, when we adjust our 2030 EV-market share forecast from 15% to 75% (2% to 12% of global auto sales).
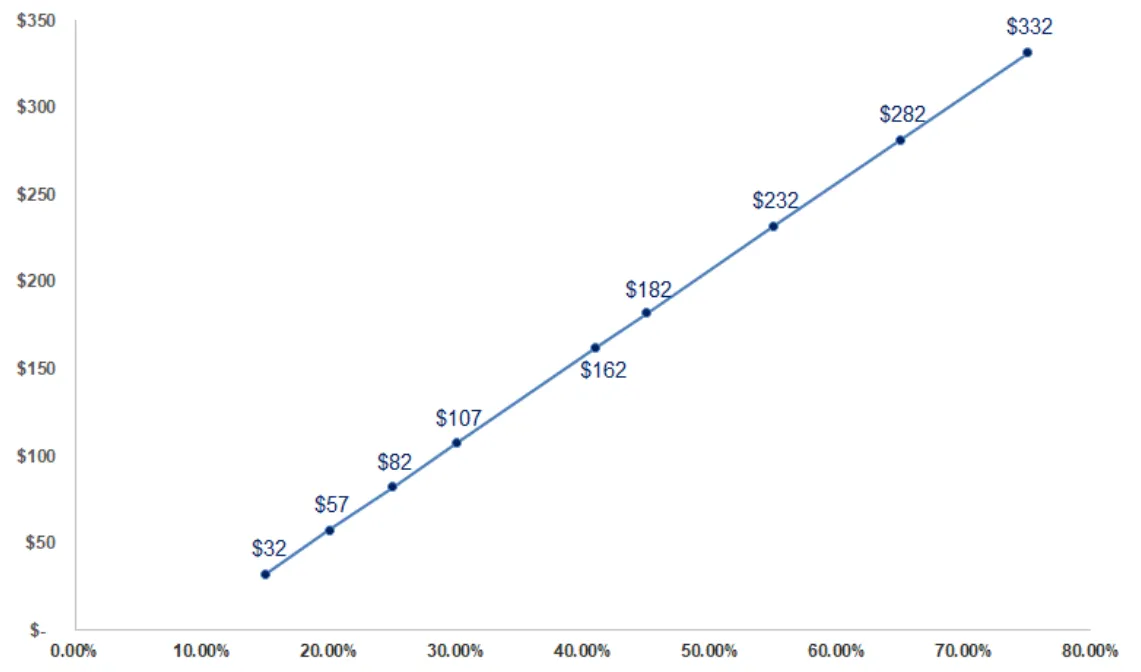
Our valuation is solely based on the vehicle business, and does not account for any upside from Tesla’s semi/autonomous robotaxi initiatives, as they are in early stages. Our valuation also does not account for any monetization potential for the data collected by Tesla on its drivers.
Sid Rajeev, B.Tech, CFA, MBA — Head of Research, Fundamental Research Corp.
Alexis Cabel, BAEcon — Equity Analyst, Fundamental Research Corp.
The full report — the designed PDF with all charts and the complete disclosure — remains available as published, free of charge with a free account. This page is the same analysis in the form a search engine, an AI assistant and a phone screen can read.
Disclosures. No fees were paid by TSLA to FRC. The analyst and Fundamental Research Corp. “FRC” does not own any shares of the subject company, does not make a market or offer shares for sale of the subject company, and does not have any investment banking business with the subject company. The distribution of FRC’s ratings are as follows: BUY (65%), HOLD (4%), SELL / SUSPEND (31%). ALWAYS TALK TO YOUR FINANCIAL ADVISOR BEFORE YOU INVEST.
Good report and valuation
hello this is a test
Discussion
Comments reflect the views of individual users, not FRC. Nothing posted in the comments section — by users or otherwise — should be taken as investment advice.