

Disclosure: Olympia Financial Group Inc. has paid FRC a fee for research coverage and distribution of reports. This fee creates a potential conflict of interest which readers should consider. See last page for other important disclosures, rating, and risk definitions.
Price and Volume (1-year)
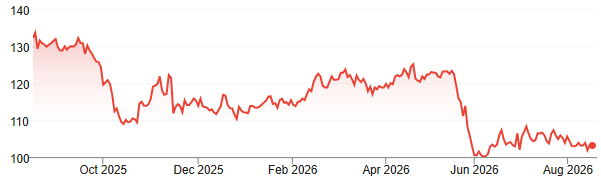
* Olympia Financial Group has paid FRC a fee for research coverage and distribution of reports. See last page for other important disclosures, rating, and risk definitions. All figures in C$ unless otherwise specified.
The leading Canadian custodian/ administrator of alternative investments
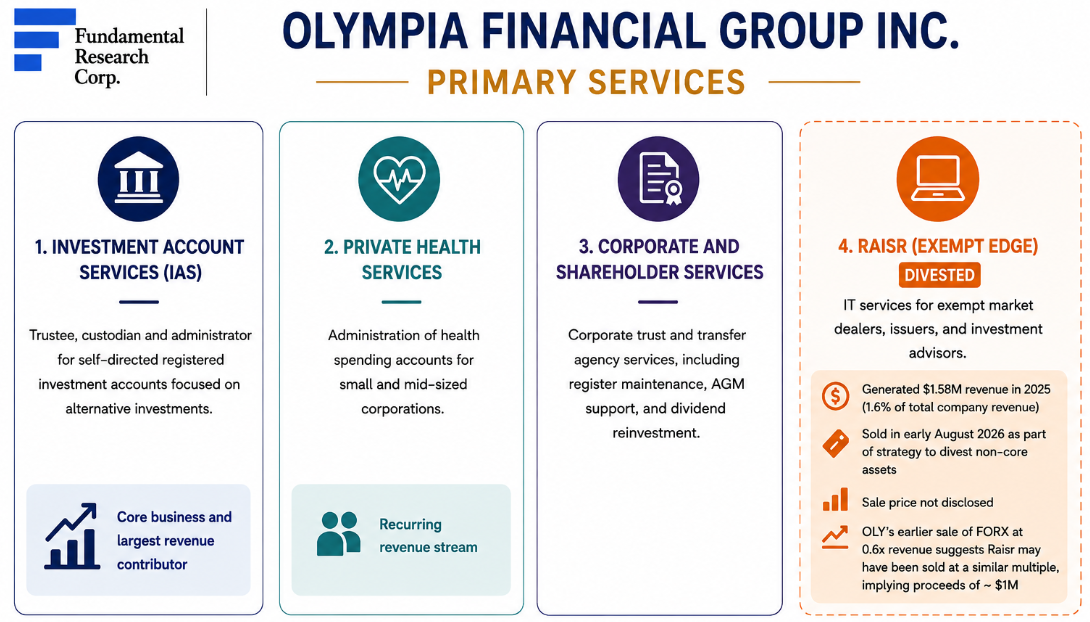
OLY’s platform supports a broad range of investments typically not offered by banks or traditional trading platforms
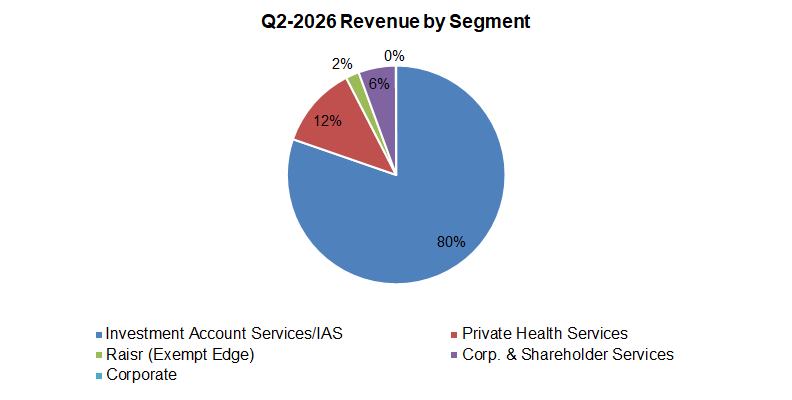
In Q2-2026, the revenue mix remained stable: 80% from IAS, 12% from private health services, and 8% from other services
Source: Company / FRC
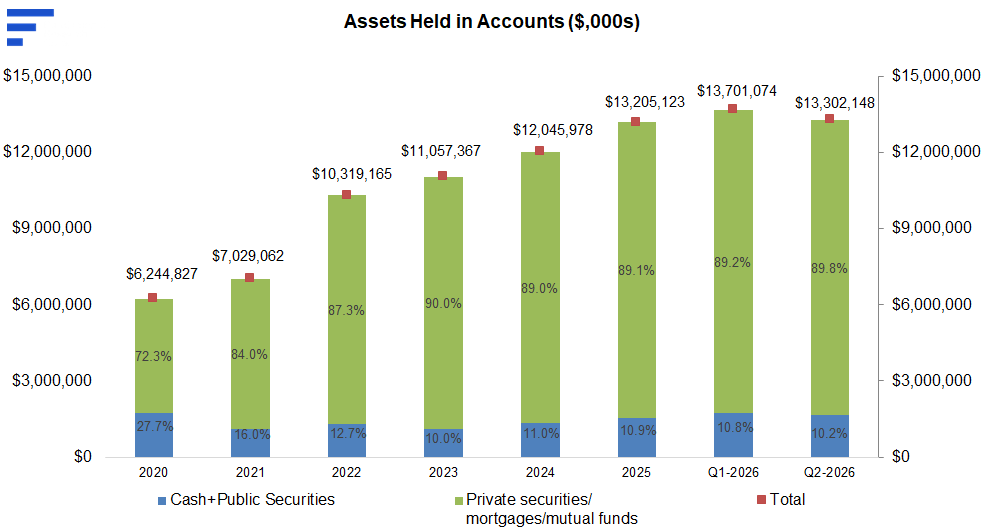
Client assets: ↓3% QoQ to $13.3B; ↑3% YoY; 3% < forecast
Lowering our 2026 year-end estimate, from $14.08B to $13.66B
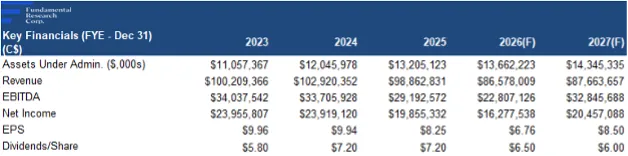
Financials (Year-End: Dec 31st)
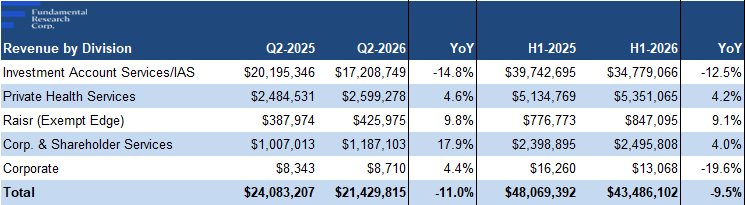
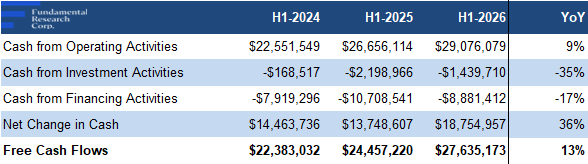
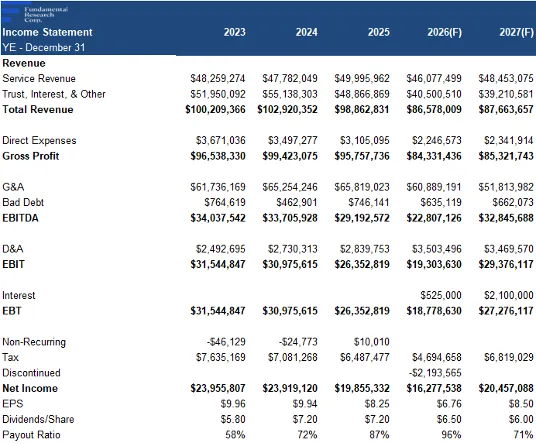
Q2 revenue: ↓11% YoY; ↓4% vs. our estimate, primarily driven by lower interest on unallocated client capital (↓ 20% YoY)
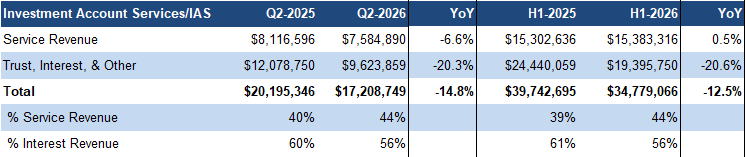
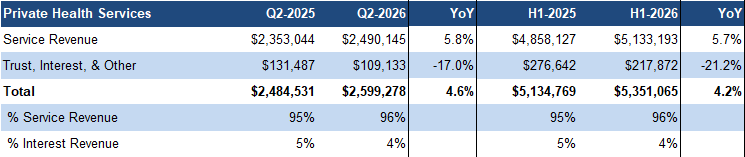
Core services revenue (IAS + Private Health): ↓4% YoY, ending several quarters of YoY growth, due to lower client assets
*The primary source of revenue in the “Trust, Interest, & Other” category is the interest earned on placing undeployed client capital in cash accounts at major Canadian banks.
*Service revenue includes annual and transaction fees
*‘Trust, interest, and other’ primarily includes interest revenue

G&A expenses down 3% YoY
Source: FRC / Company
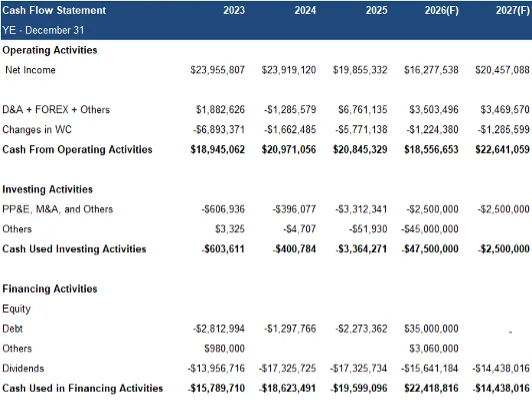
Subsequent to the quarter-end, OLY entered a reorganization agreement to terminate its management agreements for ~$50M ($45M cash + $5M shares), funded primarily through a credit facility. Management expects the transaction to reduce annual executive compensation from ~$18M to $3–$4M, generating ~$15M in recurring annual savings.
Major reorganization to drive significant cost Savings
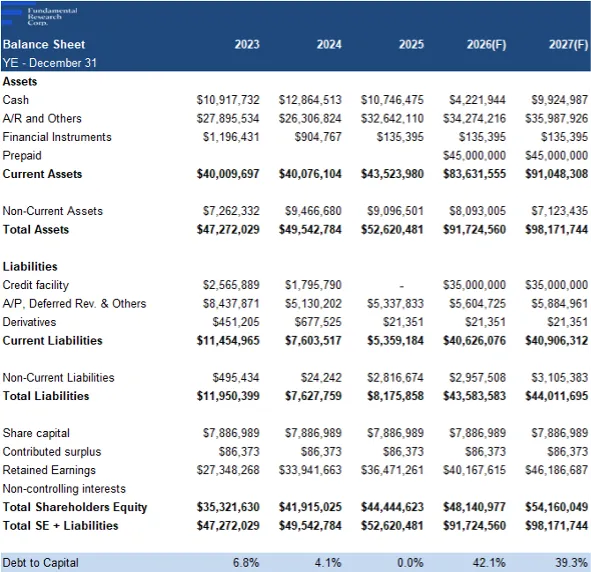
While leverage will increase, we believe the debt is manageable given OLY’s previously debt-free balance sheet. We view the transaction as highly positive, and have raised our EPS forecasts after factoring in incremental interest costs. The transaction remains subject to shareholder, court, TSX, and regulatory approvals, with the expected impact incorporated into our Q4 - 2026 estimates.
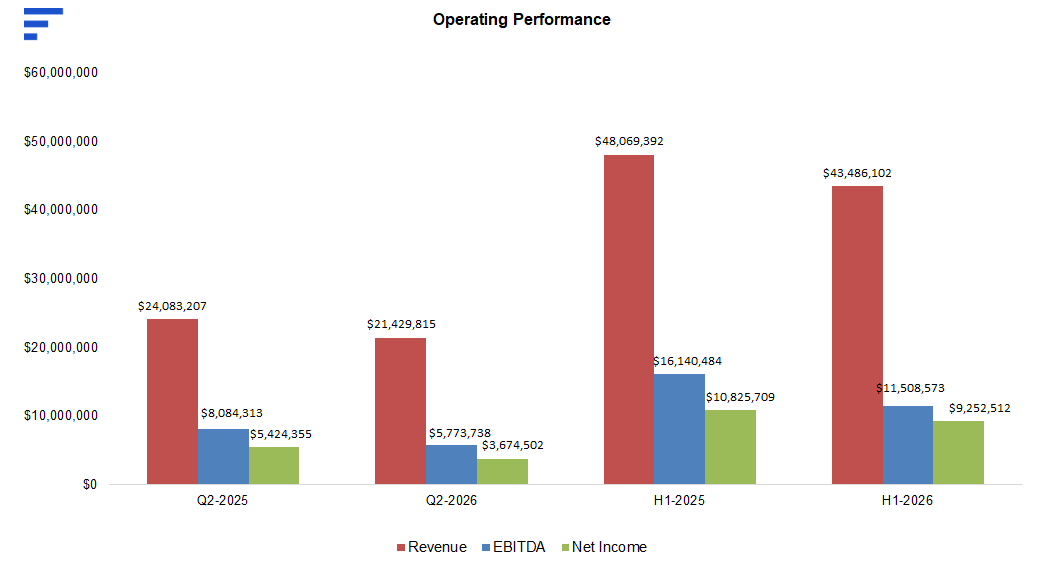
Q2 EPS: ↓32% YoY, mainly due to softer interest revenue, partly offset by lower G&A; 7% below our estimate
Source: Company/FRC
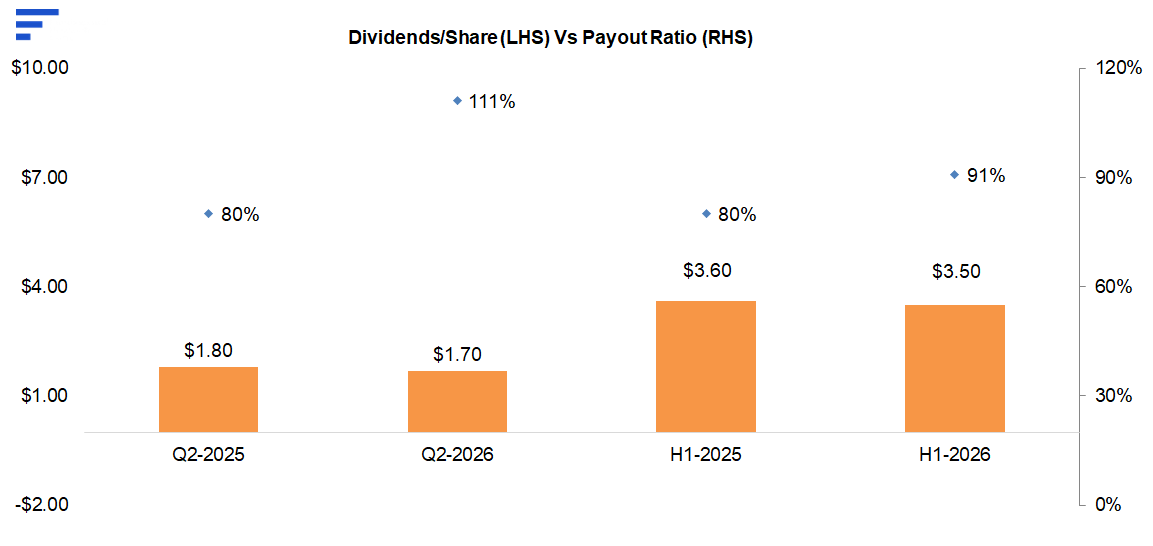
Dividend cut: ↓17% to $0.50/share monthly ($6.00 annualized), reflecting a more conservative outlook, following a soft Q2
We believe the caution is largely tied to lower interest income on unallocated client capital, a cyclical factor that is largely outside management’s control
Source: Company/FRC
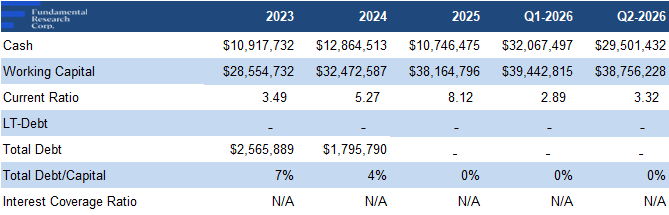
Strong, debt-free balance sheet
Post-reorganization leverage: Debt-to-capital is expected to rise to ~40% following the ~$50M management-agreement termination transaction, still within the 40%–60% range of comparables
FRC Projections and Valuation
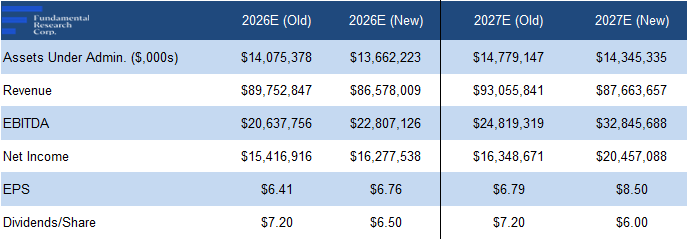
Forecasts: ↓ revenue estimates, but ↑ EPS estimates, reflecting the significant recurring cost savings from the reorganization
Source: FRC
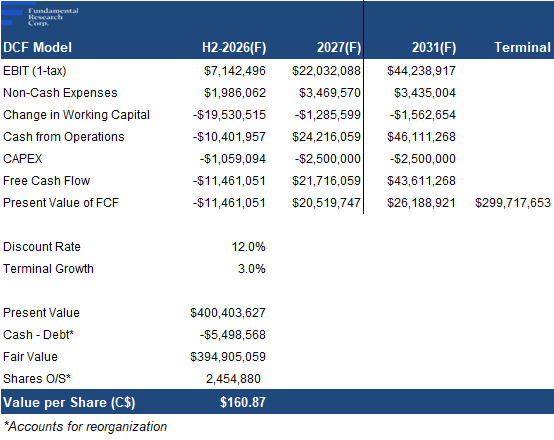
As a result, our DCF valuation increased from $149 to $161/share
Source: FRC/S&P Capital IQ
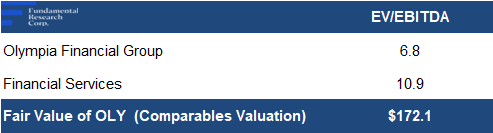
Our comparables valuation increased from $167 to $172/share
We reiterate our BUY rating, and adjust our fair value estimate from $158.24 to $166.48/share (the average of our DCF and comparables valuations), implying an expected return of 67% (including dividends) in the next 12 months.
We view the ~$15M in recurring annual cost savings from the reorganization as a significant positive, more than offsetting the incremental interest costs. While the decline in client assets warrants monitoring, we believe the shares remain attractively valued at 6.8x EV/EBITDA, well below the sector average of 10.9x.
Risks
We believe the company is exposed to the following key risks (not exhaustive):
Maintaining our risk rating of 3 (Average)
APPENDIX
.webp&w=128&q=75)
.webp&w=128&q=75)
.webp&w=128&q=75)


Discussion
Comments reflect the views of individual users, not FRC. Nothing posted in the comments section — by users or otherwise — should be taken as investment advice.