Disclosure: Builders Capital Mortgage Corp. has paid FRC a fee for research coverage and distribution of reports. See last page for other important disclosures, rating, and risk definitions.
The analyst’s rating and fair value are one click away. Free FRC account, no credit card.
Already have an account?
Price and Volume (1-year)
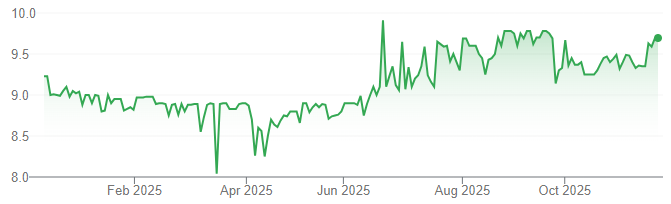
* Builders Capital has paid FRC a fee for research coverage and distribution of reports. See last page for other important disclosures, rating, and risk definitions.
Portfolio Update
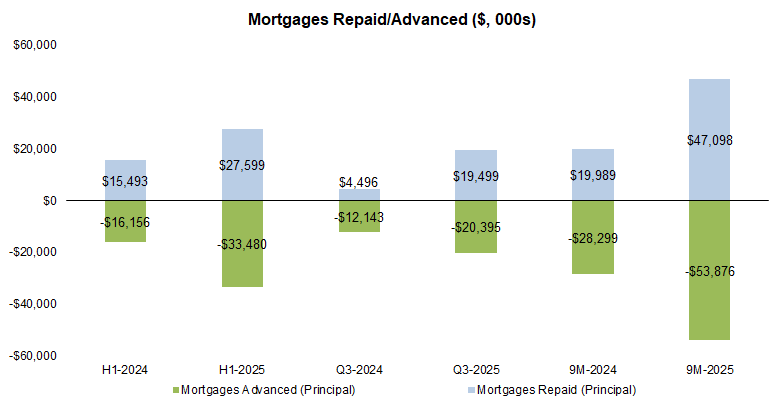
Mortgage advancements increased 68% YoY to $20M, the highest Q3 on record
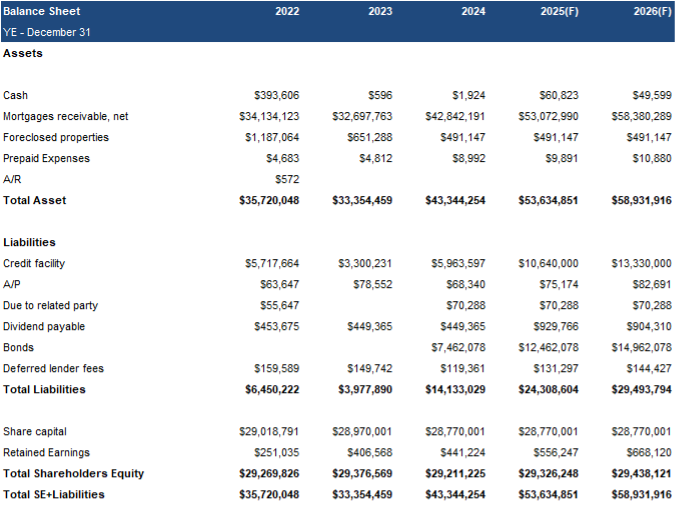
As a result, receivables (net) grew 8% QoQ to $52M
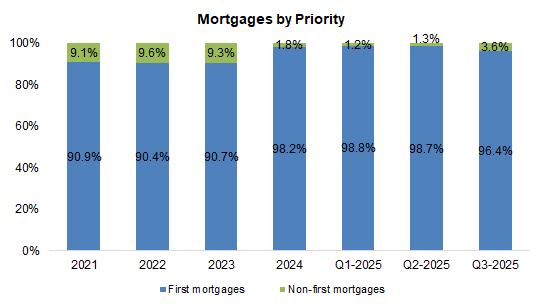
First mortgages fell 2 pp, implying slightly higher risk, but remain above the five-year average of 94%, with the portfolio still concentrated in AB and B.C.
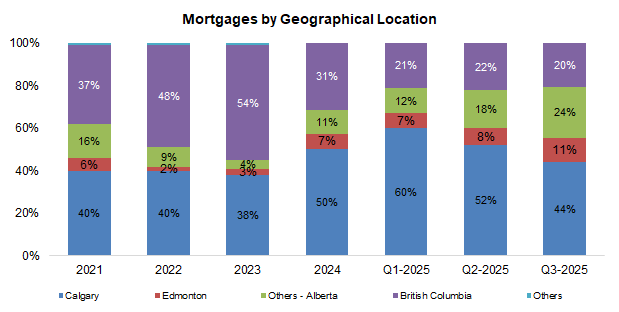
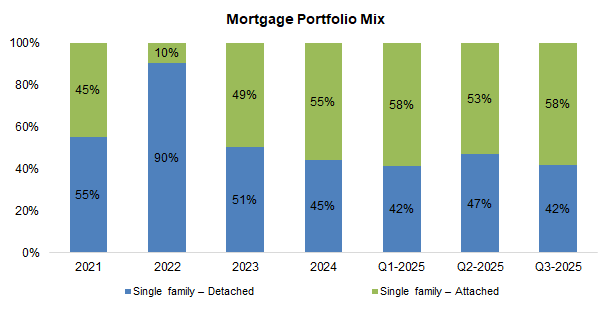
Remains focused on single-family units (construction
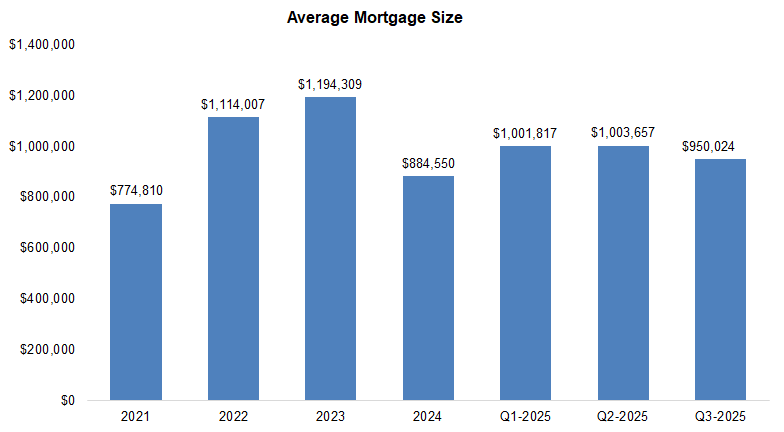
The average mortgage size fell 5% QoQ to $0.95M vs. the five-year average of $0.99M
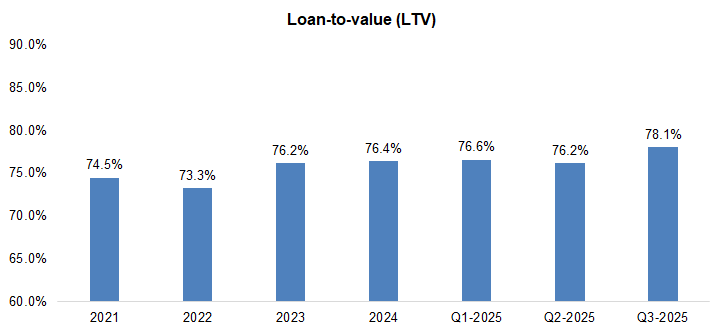
LTV rose 2 pp to 78%, above the five-year average of 75%, indicating higher risk
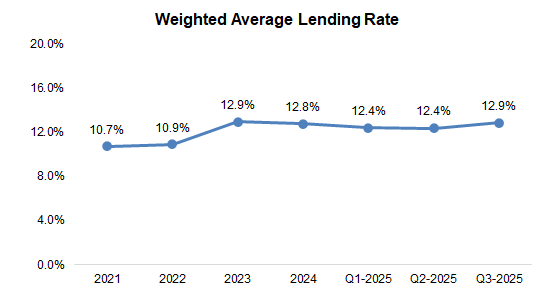
Turnover of a few low interest loans pushed BCF’s average lending rate up 0.5 pp, despite declining market rates
Source: FRC / Company
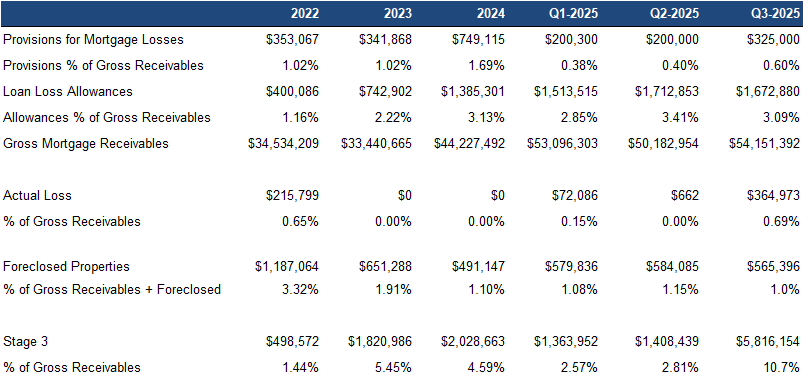
Stage three mortgages (impaired) increased 313% QoQ to 11% of mortgages
However, allowances fell 32 bp to 3.09% of receivables, indicating management does not expect incremental losses
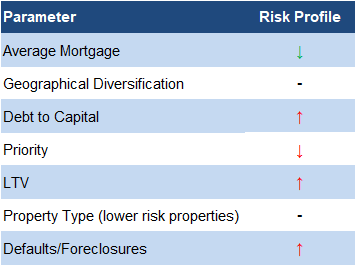
*Red (green) indicates an increase (decrease) in risk level.
Source: FRC
In summary, we believe the portfolio’s risk profile has increased, with one green and four red signals
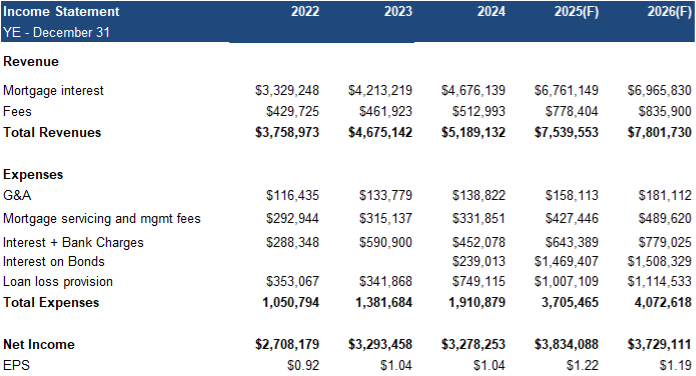
Financials
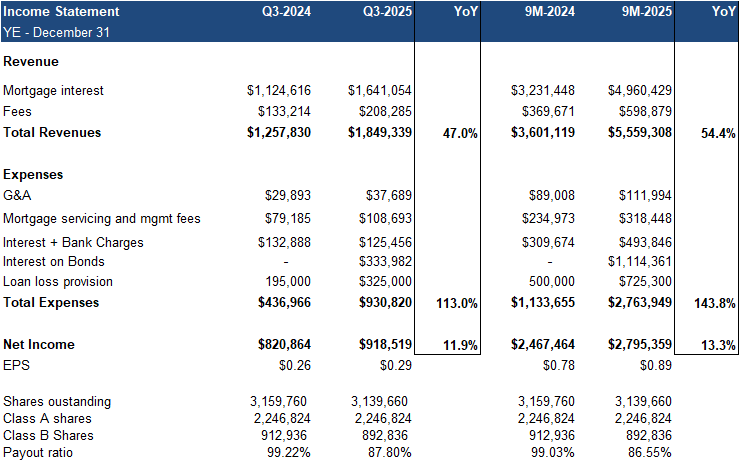
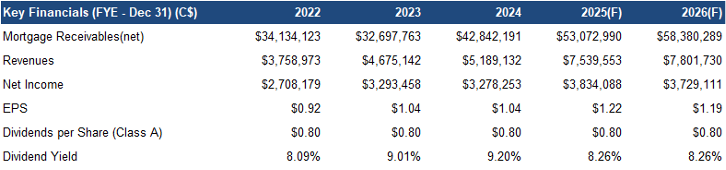
Q3 revenue rose 47% YoY, driven by higher receivables
EPS increased 12% YoY
Both revenue and EPS beat our estimates by 1%, driven by higher-than-expected lending rates
Source: FRC / Company
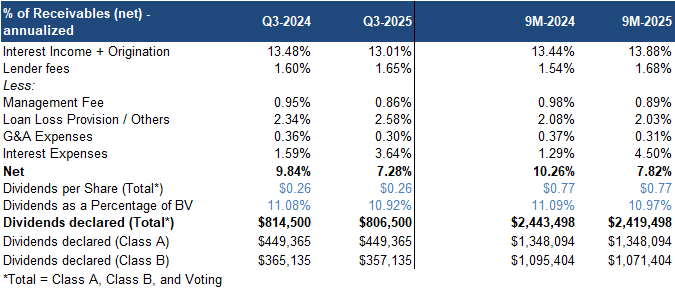
Dividends remained unchanged at 11% of shareholders’ equity
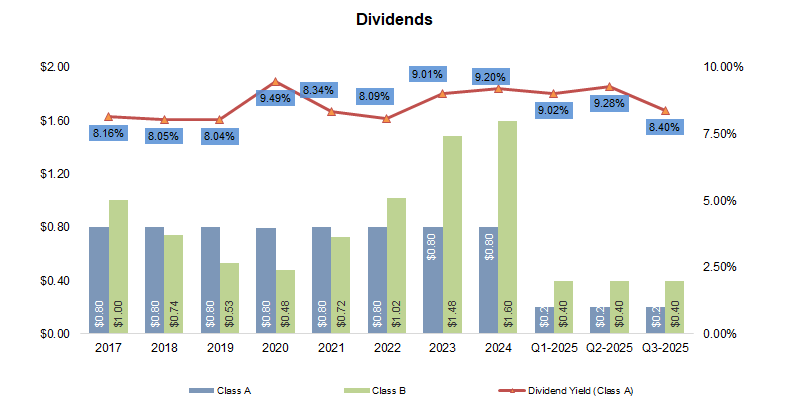
*Yields were calculated based on the average share price for the given time period.
Note: Class A non-voting common shares are publicly listed, while Class B non-voting common shares are held by management and private investors. In terms of dividend distribution, Class A shares (public investors) rank first, followed by Class B shares. Class A shares will be paid $0.80 per share, before dividends are paid on Class B shares.
Dividends for Class A investors remained unchanged at $0.80/share, implying a yield of 8.26%
Source: FRC / Company
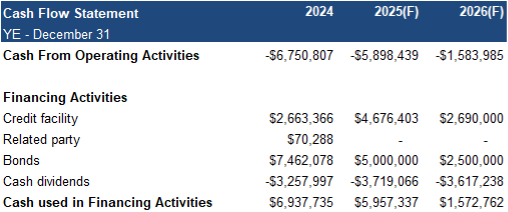
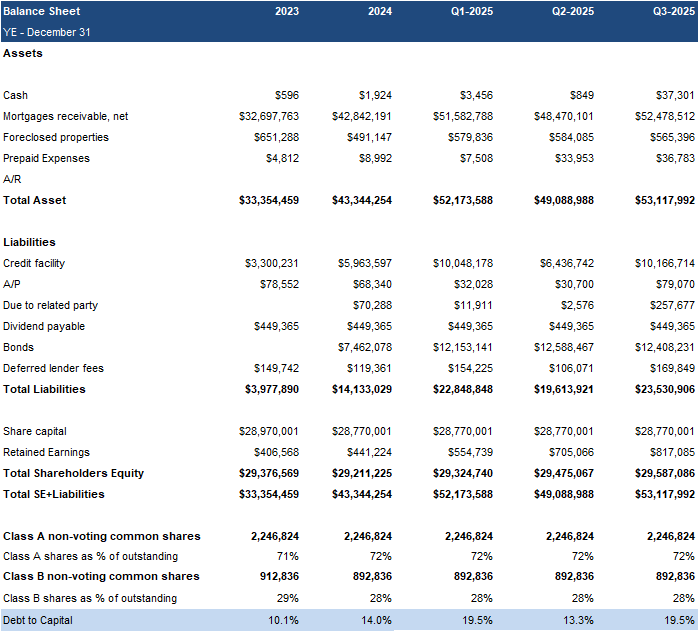
Debt-to-capital increased 6 pp to 20%, driven by higher mortgage advancements
At the end of Q3, BCF had raised $12M of an ongoing $50M unsecured bond financing
FRC’s Projections and Valuation
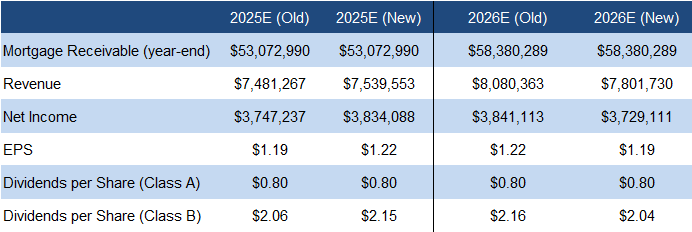
We are raising our 2025 EPS estimate due to higher-than-anticipated lending rates, partially offset by higher loan loss provisions
Source: FRC
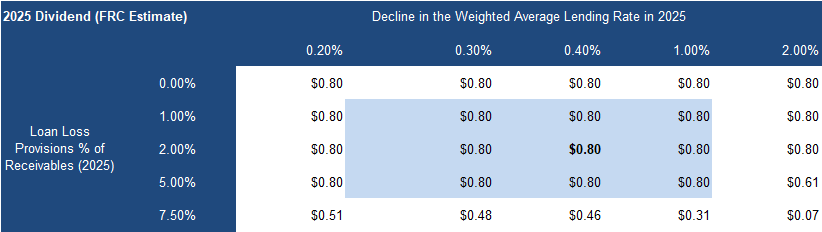
We believe the MIC can comfortably distribute its stated $0.80/share annual dividend
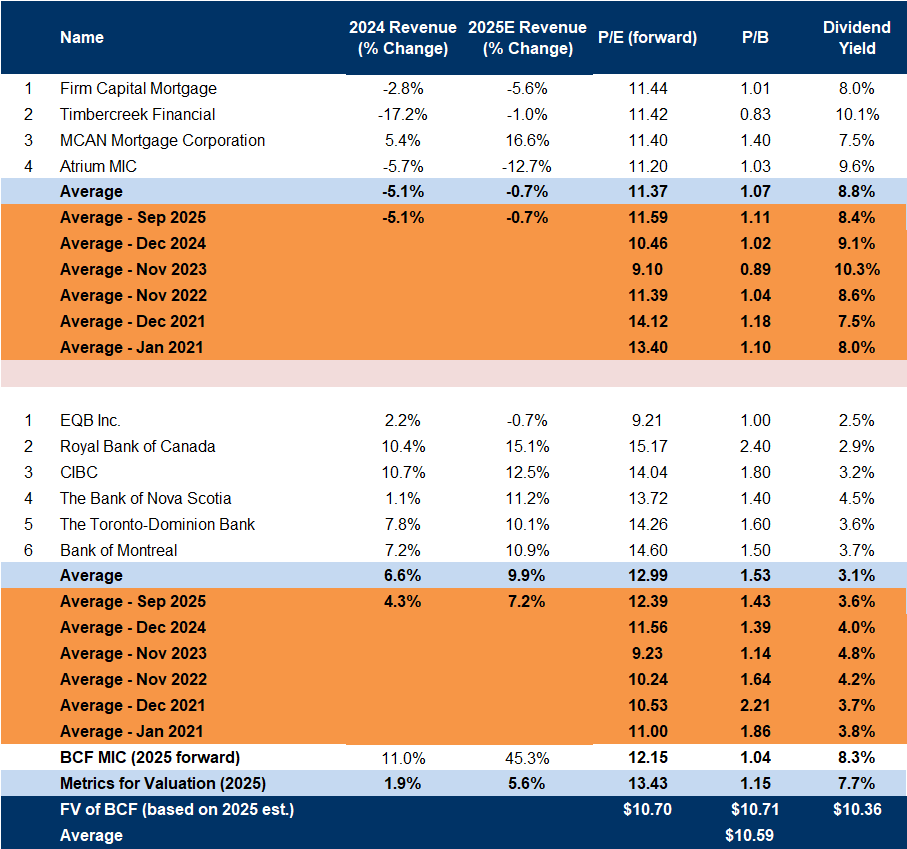
Source: S&P Capital IQ / FRC
On average, MICs and banks are expected to report 6% revenue growth this year vs 2% in 2024
Since September 2025, MIC multiples are down 4%
As a result, our fair value estimate dropped to $10.59/share from $10.93/share, even with a higher EPS forecast
We are reiterating our BUY rating, and adjusting our fair value estimate from $10. 93 to $ 10.59 /share, implying an expected return of 18 % (including dividends) in the next 12 months.
Q3 was a record quarter for BCF, with strong growth in mortgage advancements, net receivables, revenue, and EPS, while the $0.80/share dividend remains well-supported. Despite rising stage three mortgages, easing rates and a potential residential real estate recovery in 2026 suggest positive momentum for MIC stocks.
Risks
Maintaining our risk rating of 3
APPENDIX