Disclosure: Yorkton Equity Group Inc. has paid FRC a fee for research coverage and distribution of reports. See last page for other important disclosures, rating, and risk definitions.
The analyst’s rating and fair value are one click away. Free FRC account, no credit card.
Already have an account?
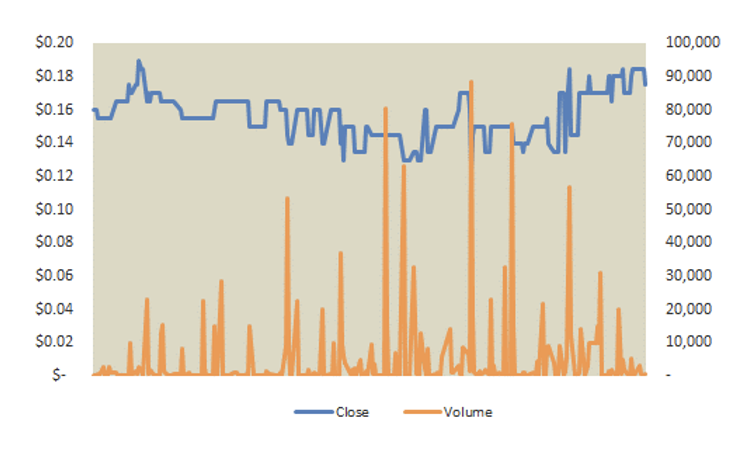
Price and Volume (1-year)
30+ year track record in real estate. The CEO owns 73% of YEG’s equity. Building a portfolio capable of potentially generating steady cash flows, and capital gains
YEG focuses on multi-family rental properties capable of potentially generating steady cash flows, and capital gains. Management’s key objectives include:
YEG’s portfolio includes 11 projects (unchanged QoQ), including 10 residential projects totaling 518 units, and one commercial spanning 28,036 sq. ft
YEG owns 100% equity in its projects. At the end of Q2, YEG owned $128M in real estate investments, up 32% YoY, primarily driven by acquisitions
Property valuations increased by 1% QoQ, or $1.4M in Q2 (nil in Q1), attributed to increased residential rent and occupancy. We continue to anticipate property valuations increasing by 5.5% across 2024 and 2025, driven by lower cap rates
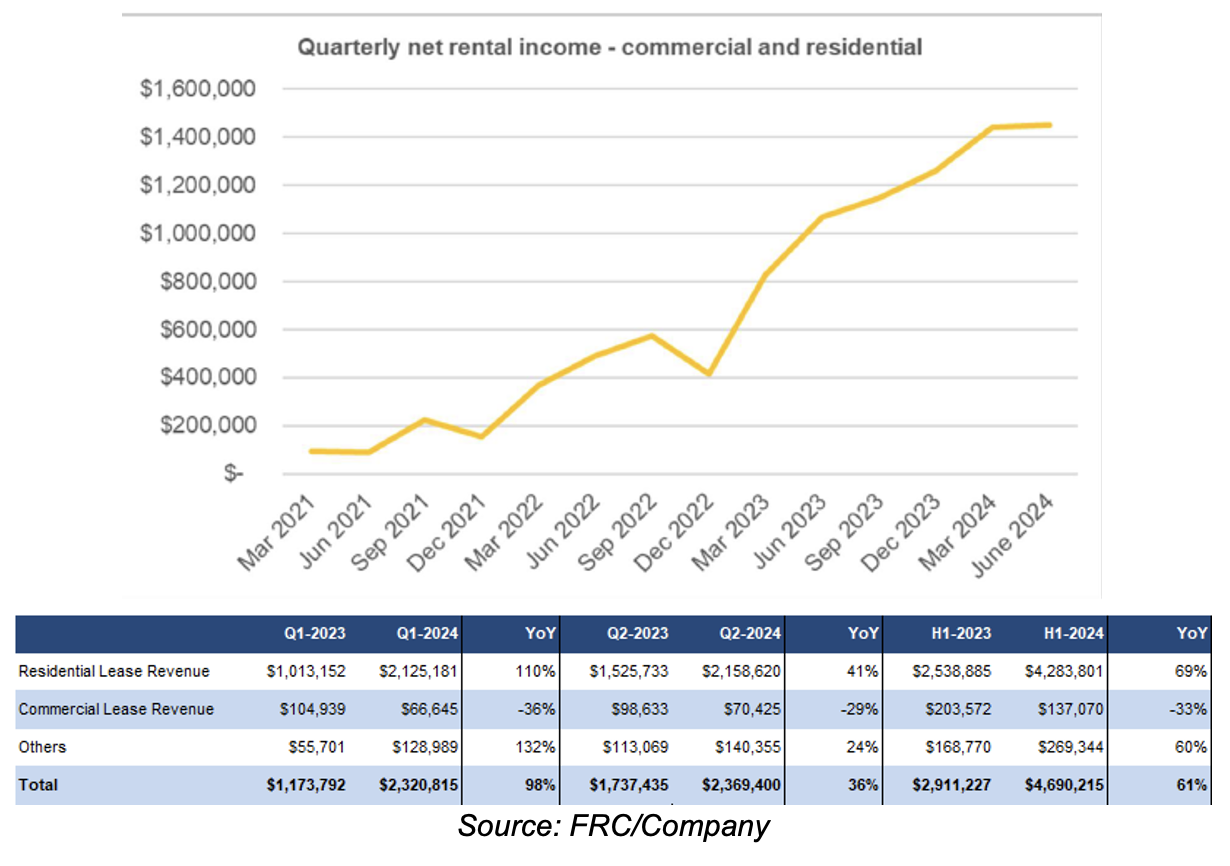
Q2 revenue was up 2% QoQ, and 36% YoY. The following sections summarize YEG’s projects (no material changes QoQ). In Q2-2024, residential rental revenue accounted for 91% of revenue (88% in Q2-2023)
10 residential projects totaling $5.7M in NOI, valued at $116M, or $254k/unit. Three residential projects in Edmonton, totaling 375 units valued at $82M, or $218k/unit
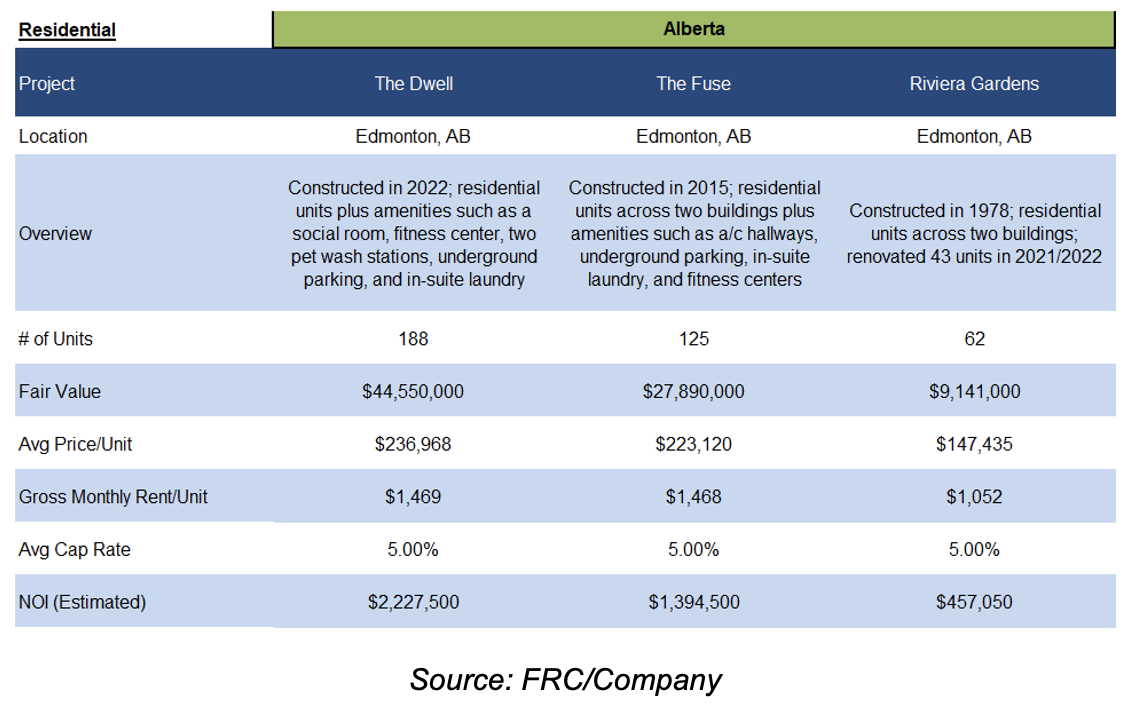
The average cap rate is 5%. Four residential projects in Fort St. John, B.C., totaling 83 units valued at $13M, or $151k/unit
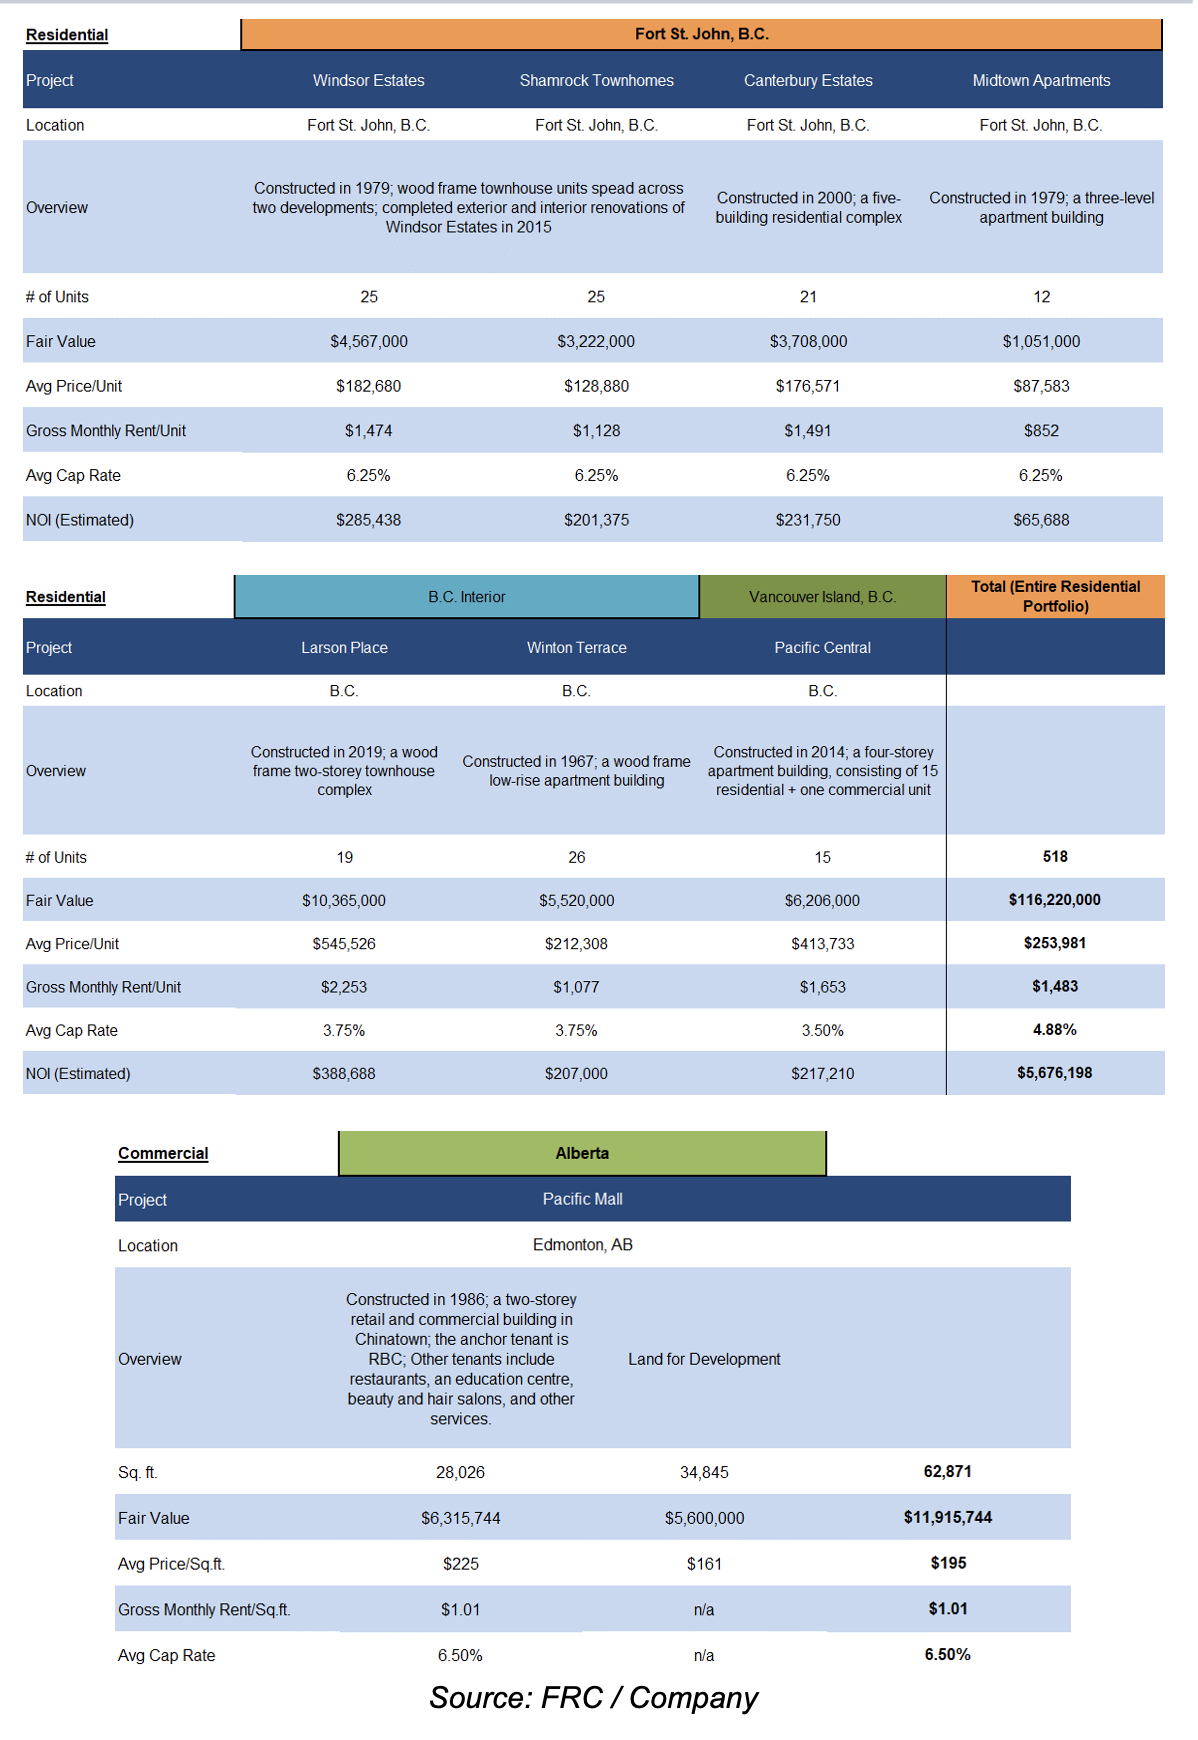
Three residential projects in interior B.C., totaling 60 units valued at $22M, or $368k/unit. The average cap rate is 3.7%
One commercial/retail project in Edmonton, with RBC (TSX: RY) as the anchor tenant
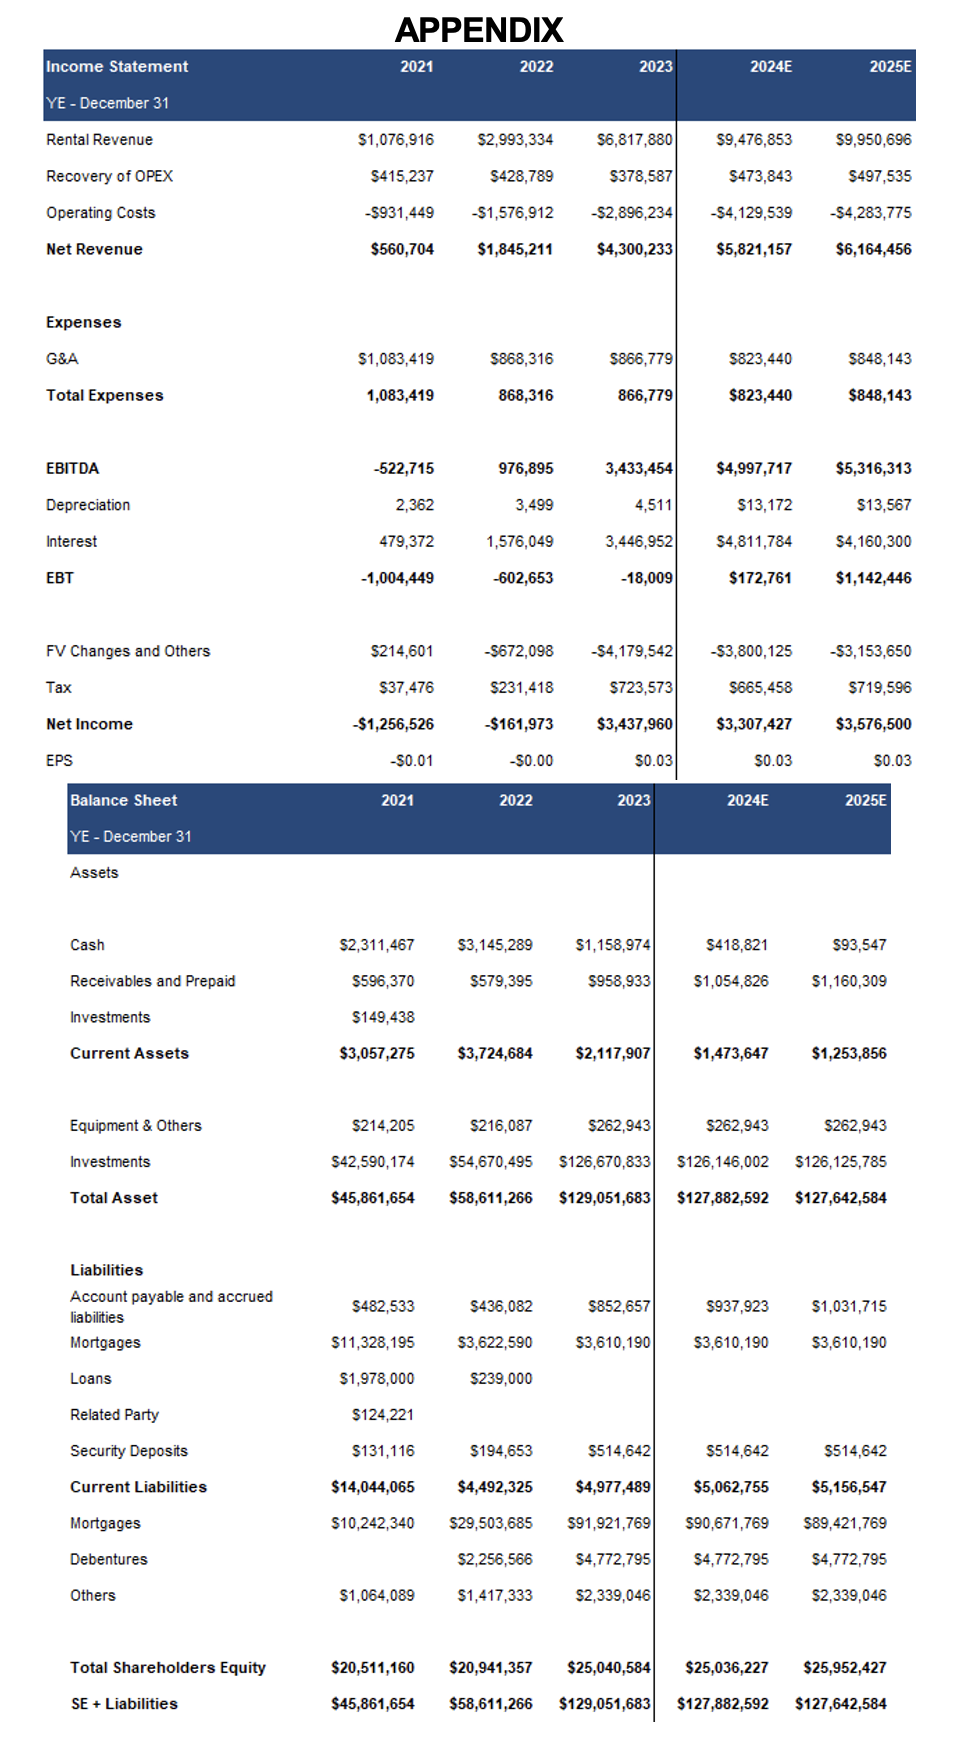
Q2 revenue and EBITDA were in line with our estimates. Revenue was up 36% YoY, primarily driven by property acquisitions
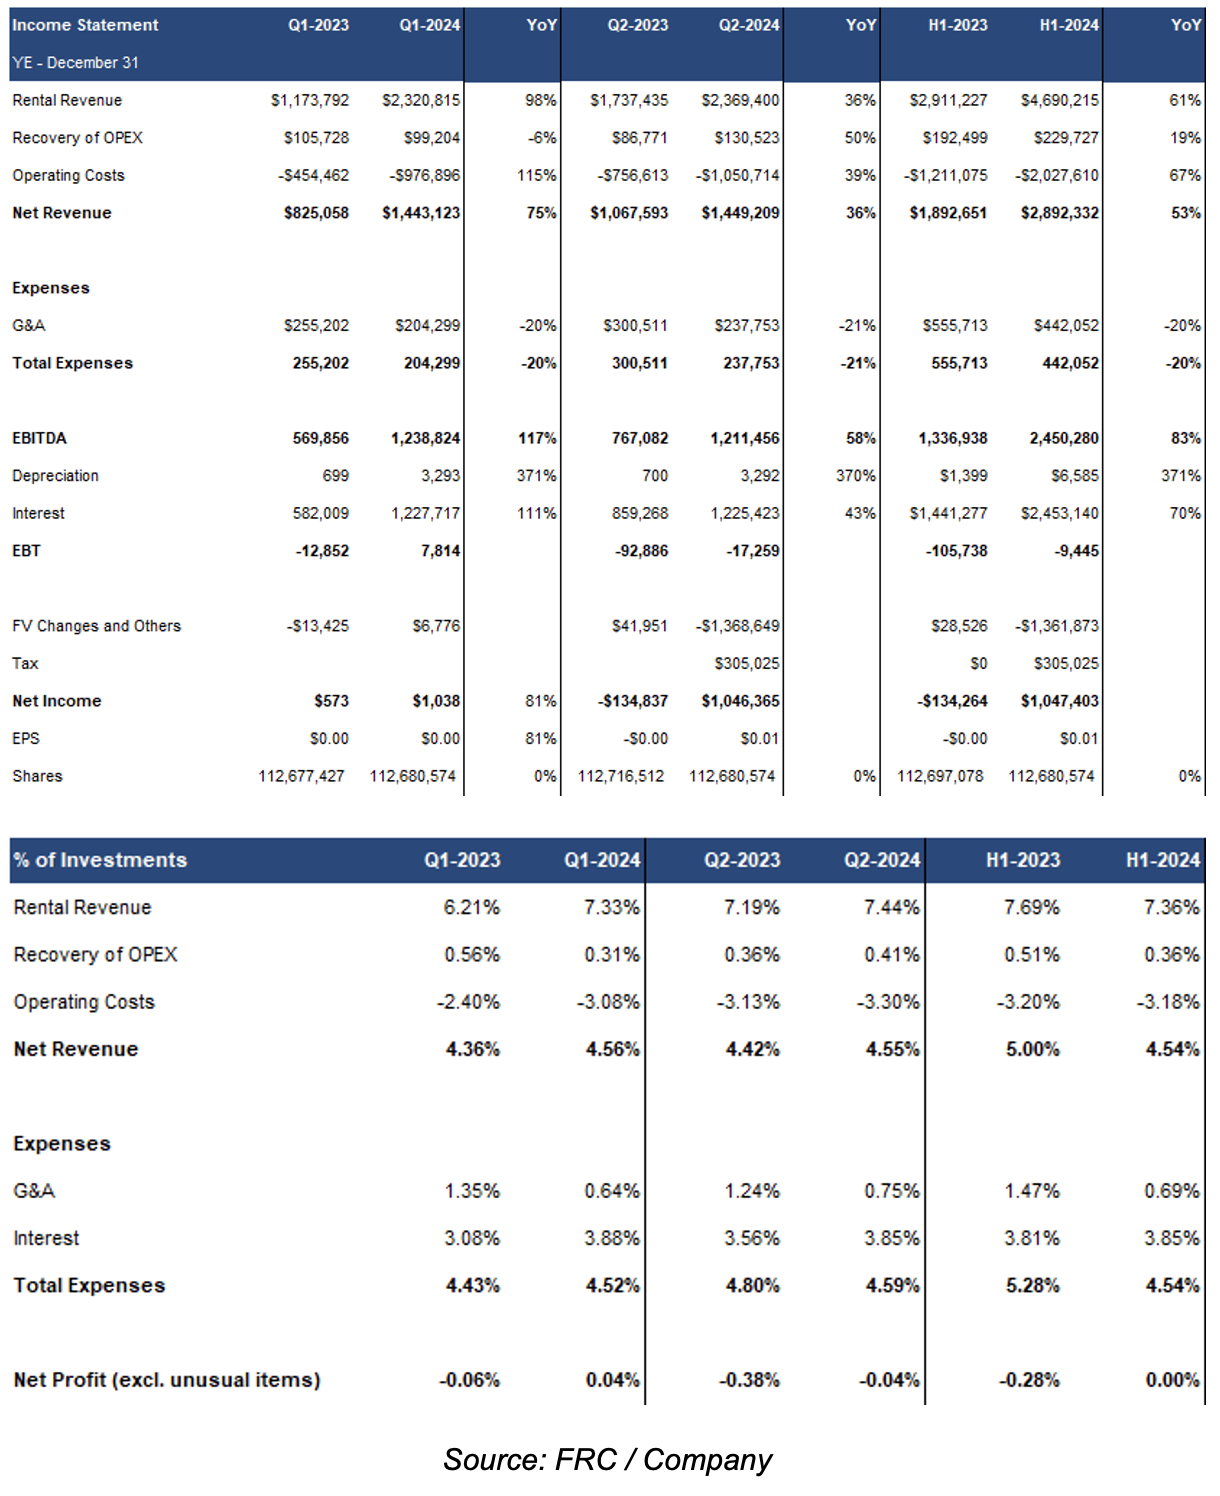
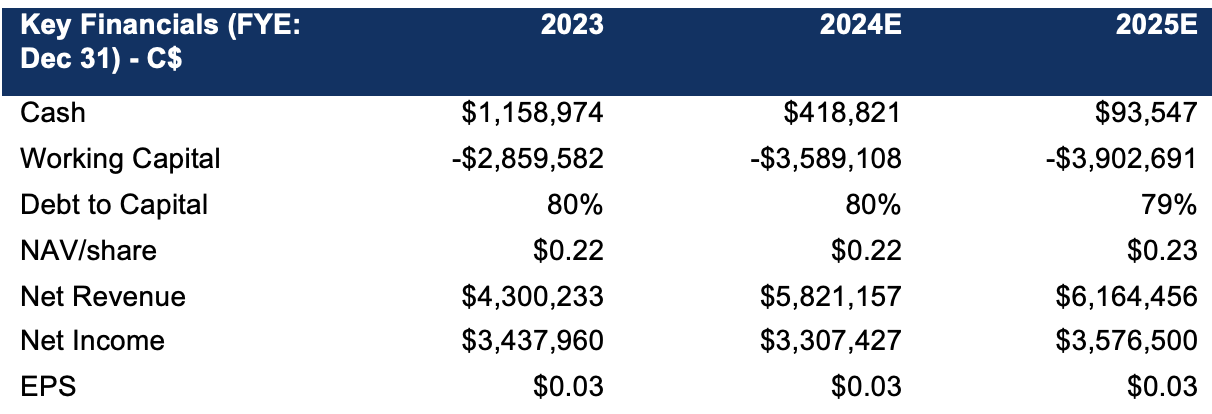
EBITDA was up 58% YoY. EPS turned positive (from -$0.001 to $0.01), but was 8% lower than our estimate due to higher interest expenses
Net profit improved YoY from -0.38% to -0.04% of investments
While gross margins align with the sector average, EBITDA margins are notably higher, primarily attributed to relatively low G&A expenses
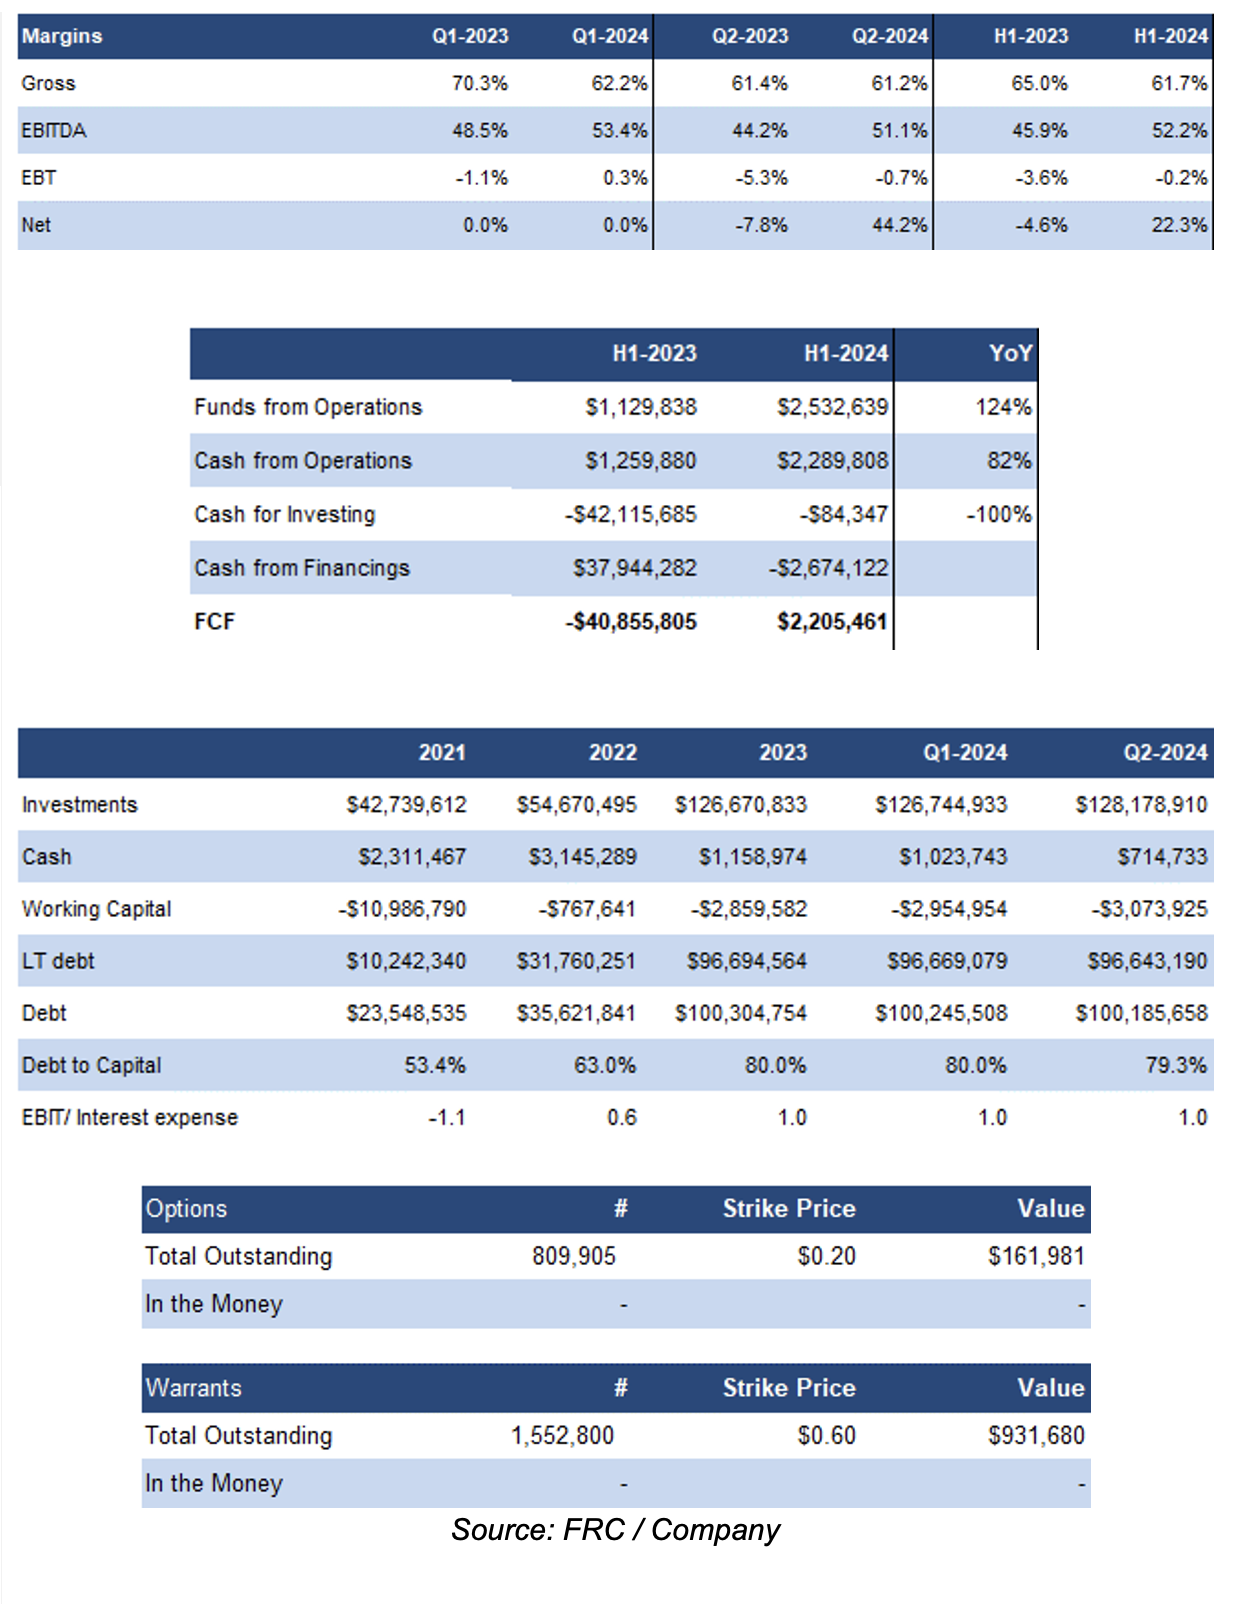
Debt to capital was 79% at the end of Q2 vs the sector average of 52%. As equity builds through potential gains in property valuations, and equity financings, Yorkton's debt to capital should trend lower
None of the outstanding options/warrants are in-the-money
Given the increase in rent and occupancy in Q2, we are raising our 2024 EBITDA estimate while lowering our EPS estimate, as interest expenses were higher than anticipated in H1
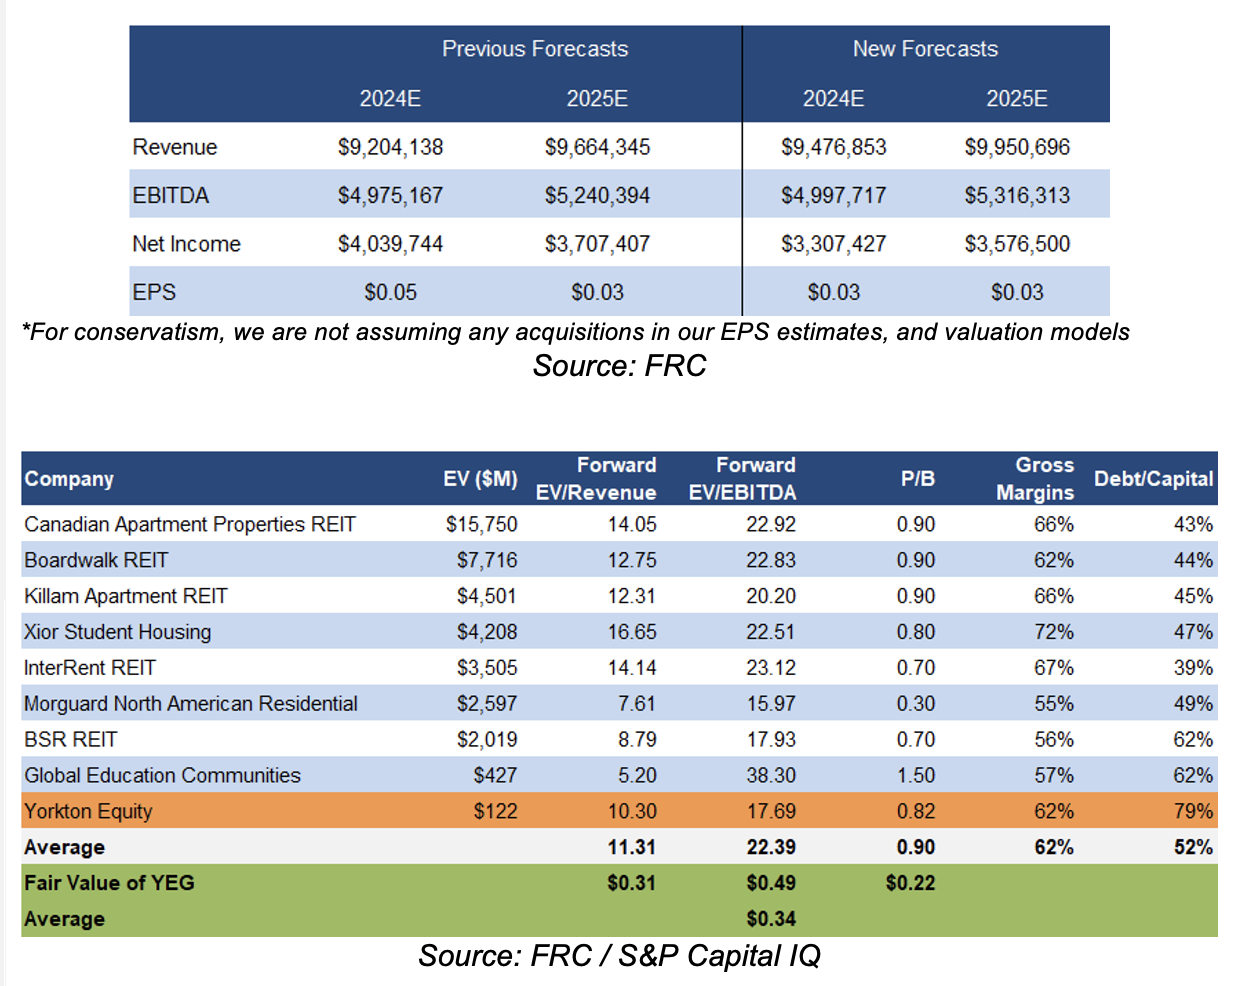
YEG’s forward EV/Revenue is 10.3x (previously 9.9x) vs the sector average of 11.3x (previously 10.7x)
Applying sector averages to our revenue and EBITDA estimates, we are arriving at a fair value estimate of $0.34/share (previously $0.30/share
We are reiterating our BUY rating, and adjusting our fair value estimate from $0.30 to $0.34/share. We believe that higher rent/occupancy will drive YoY revenue growth in the coming quarters. Additionally, given the expected downward trend in interest rates, we project lower cap rates and significant property value appreciation in the coming 12 months.
We are maintaining our risk rating of 3 (Average)
We believe the company is exposed to the following key risks: