Disclosure: Unknown Company has paid FRC a fee for research coverage and distribution of reports. See last page for other important disclosures, rating, and risk definitions.
The analyst’s rating and fair value are one click away. Free FRC account, no credit card.
Already have an account?
* AWM Diversified MIC has paid FRC a fee for research coverage and distribution of reports. See last page for other important disclosures, rating, and risk definitions.
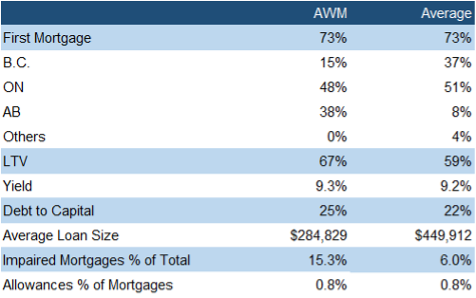
AWM’s yield is in line with the sector average
Smaller average loan sizes, and higher LTVs
Higher proportion of impaired mortgages, though loan loss allowances remain in line with the sector average, reflecting management’s confidence in only limited incremental losses
The table below compares AWM’s portfolio with other MICs (AUM $100M+) focused on already-built single-family residential units.
Source: FRC / Various
Portfolio Details (YE – March 31st)
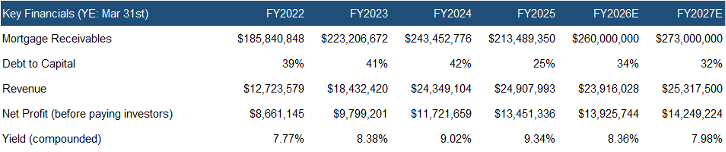
Mortgage receivables fell 12% YoY to $213M in FY2025 on softer originations, but rose 13% YTD to $242M in H1 FY2026 on stronger activity
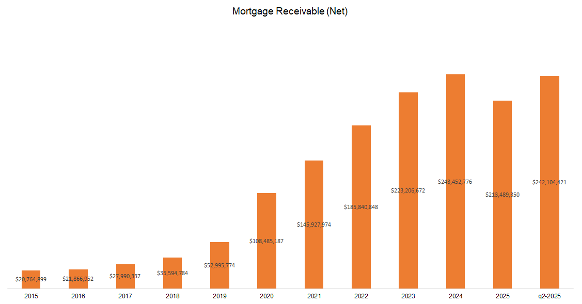
Mortgage receivables fell 12% YoY to $213M in FY2025 on softer originations, but rose 13% YTD to $242M in H1 FY2026 on stronger activity
In FY2025, mortgage advancements were down 28% YoY; payouts were up 17% YoY
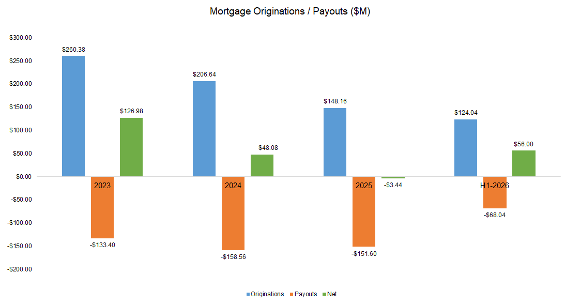
In H1-FY2026, mortgage advancements were up 45% YoY; payouts were down 27% YoY
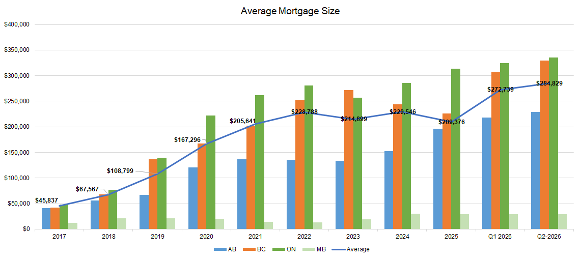
In FY2025, the average mortgage size declined 9% YoY, but rebounded by 36% YTD in H1-FY2026 to $285K
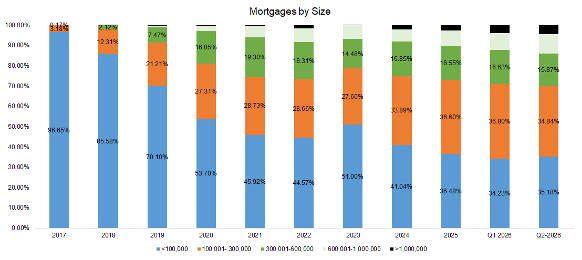
70% of mortgages are <$300k vs the historic average of 82%
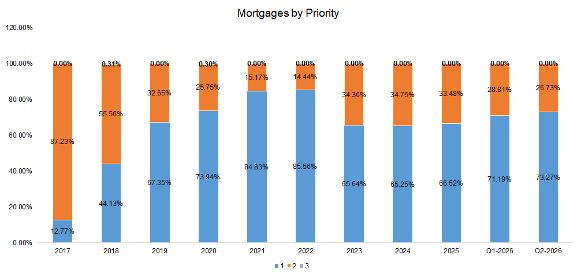
First mortgage exposure rose to 73% vs the historical average of 64%
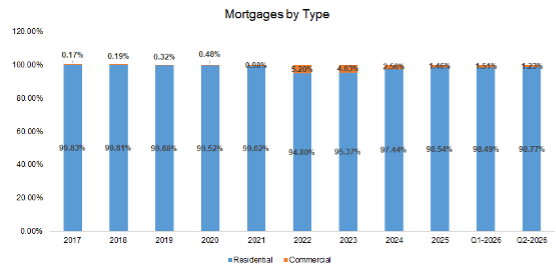
Focus remains on single family, owner occupied units
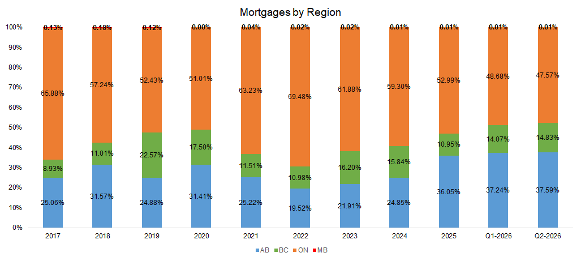
Enhanced geographical diversification by lowering exposure to ON
Focus remains on urban areas
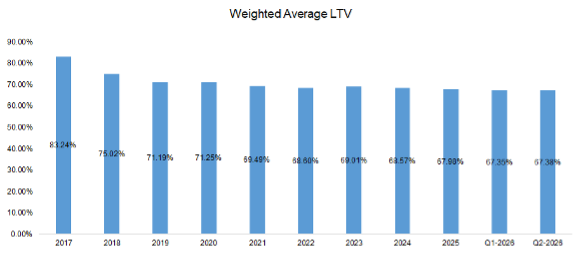
LTV was down slightly

Source: Company / FRC
Impaired mortgages increased 7 pp YoY to 15% of total mortgages vs the sector average of 6%
Loan loss allowances were increased by 12 bps to 0.81%, aligning with the sector average, reflecting management’s confidence in limited incremental losses
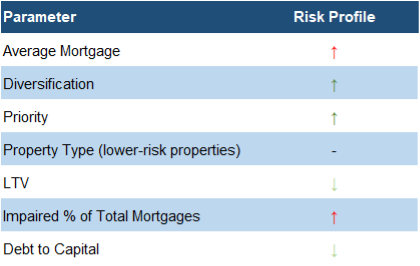
• red (green) indicates an increase (decrease) in risk level
Source: FRC
In summary, we believe the portfolio’s risk profile has decreased, despite higher impaired mortgages, driven by four green vs two red signals
Financials
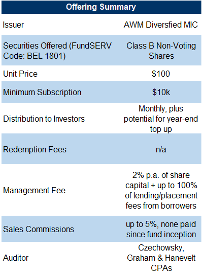
Investors hold Class B shares, allowing them to request redemptions monthly without incurring fees, or facing a lock-up period. It is noteworthy that many MICs typically impose lock-up periods, and early redemption fees. That said, redemptions are not guaranteed.
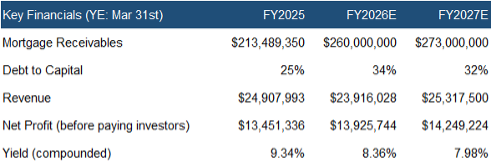
Net income (before investor distributions) rose 15% YoY to $13.45M, nearly matching our estimate of $13.48M
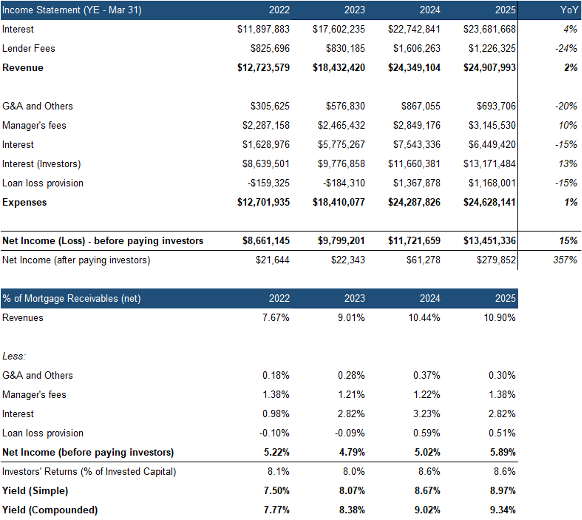
Note that the above figures may be slightly different from the figures reported by the MIC due to the difference in the method of calculation. We used the average of the opening balance, and year-end balance of the mortgages outstanding, and invested capital, to arrive at the above figures.
Source: FRC
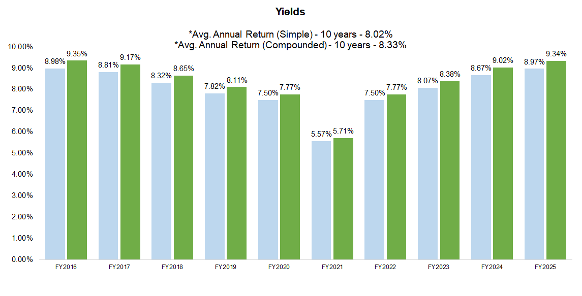
The yield increased by 0.32 pp YoY to 9.34% vs our forecast of 9.39%
Dividends are paid monthly
$213M in mortgages at the end of FY2025, down 12% YoY
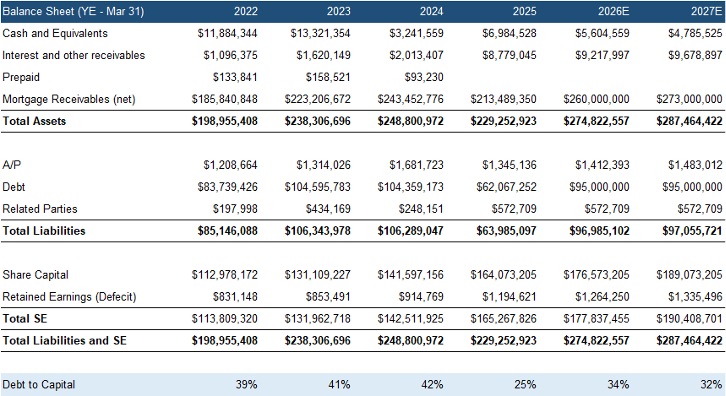
Debt to capital decreased by 17 pp to 25%, which we note is on the lower-end among comparables
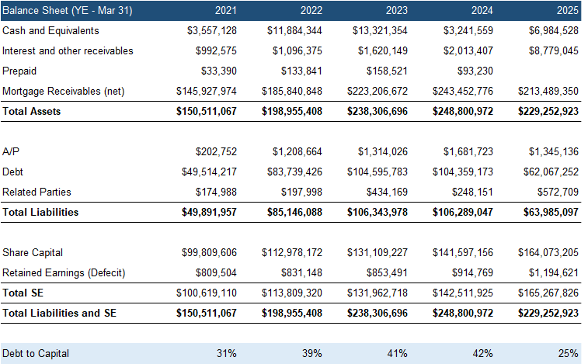
*MICs generally do not hold significant cash, and instead use excess cash to pay down debt. In our discussions with management, the high cash position at year-end was merely due to timing differences, as the MIC had to hold cash to fund mortgages.
Source: Company / FRC
FRC Rating
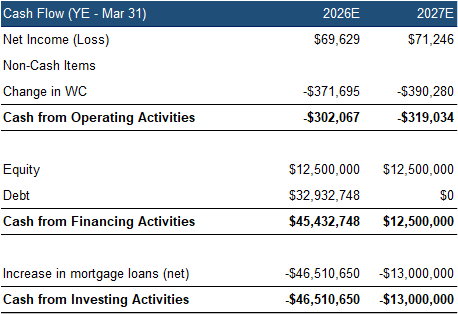
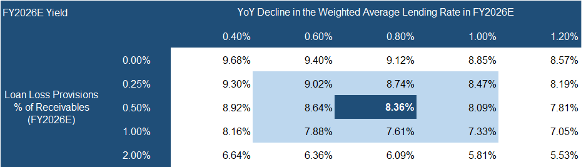
With rates expected to trend downward, we foresee yields declining in FY2026, and FY2027
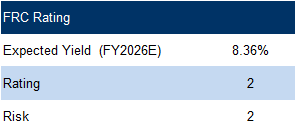
We are reiterating our overall rating of 2, and risk rating of 2.
Our estimate for the FY2026 yield varies between 7.33% and 9.02%, as loan loss provisions and lending rates vary
We find high-yielding funds, like AWM, increasingly attractive in the current declining rate environment. This is because MIC lending rates are less elastic, meaning their yields tend to decline less in a falling rate environment, and rise more slowly in a rising rate environment. Given the BoC’s rate cuts, yields are set to decline. However, we believe the risk of higher default rates is easing, and the mortgage origination market is likely to gain momentum in 2026.
Risks
We believe the MIC is exposed to the following key risks:
• Rapid sourcing and timely replacement are vital for short-term loans
• Lower housing prices will result in higher LTVs
• As with all MICs, there is no guarantee on shareholders’ principal
• The MIC utilizes leverage, amplifying exposure to adverse events
• Second mortgages carry higher risk
APPENDIX
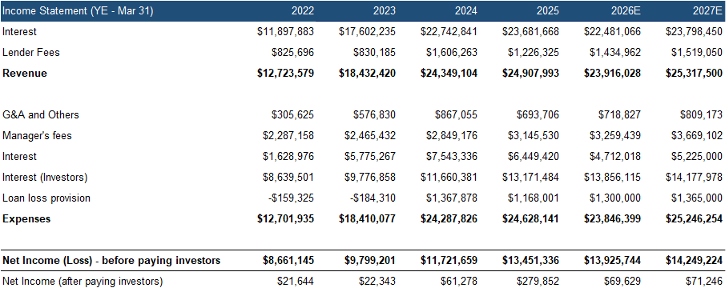
• Even though the Manager has rights to 100% of lender fees, they have historically paid a portion of the fees to the fund, which we believe is a good sign for investors. We also understand that there is no guarantee that management will do so going forward.