

Disclosure: Builders Capital Mortgage Corp. has paid FRC a fee for research coverage and distribution of reports. This fee creates a potential conflict of interest which readers should consider. See last page for other important disclosures, rating, and risk definitions.
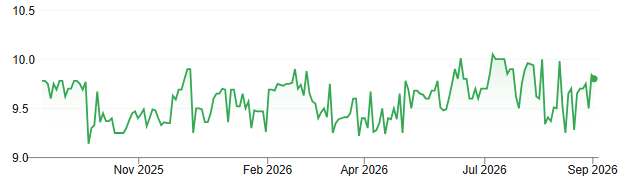
Price and Volume (1-year)
* Builders Capital has paid FRC a fee for research coverage and distribution of reports. See last page for other important disclosures, rating, and risk definitions. All figures are in C$.
Portfolio Update
Mortgage advancements ↓ 4% YoY to $32M
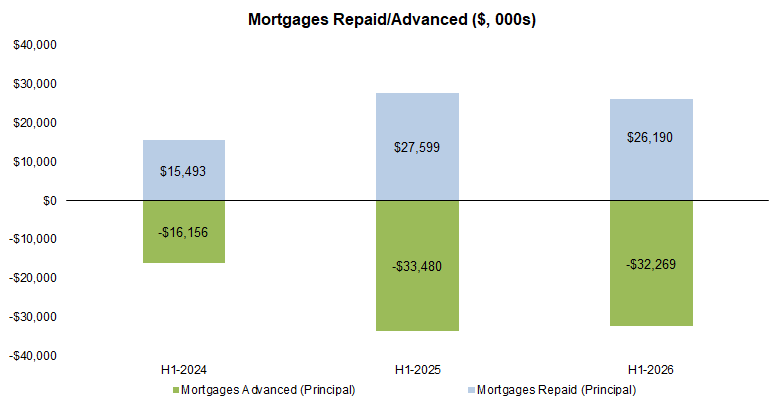
Repayments ↓ 5% YoY to $26M
As a result, net receivables ↑ 12% YTD to $54M, 5% above our estimate
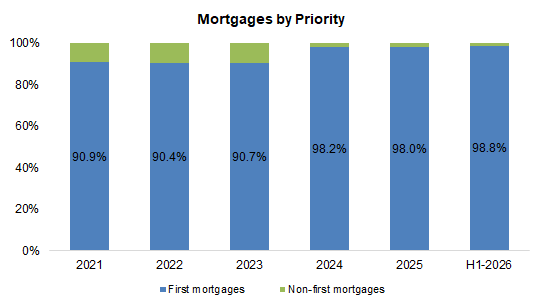
First-mortgage exposure ↑ 0.8 pp YTD to 98.8%, vs. 5-year average of 94%, indicating lower risk
Source: FRC / Company
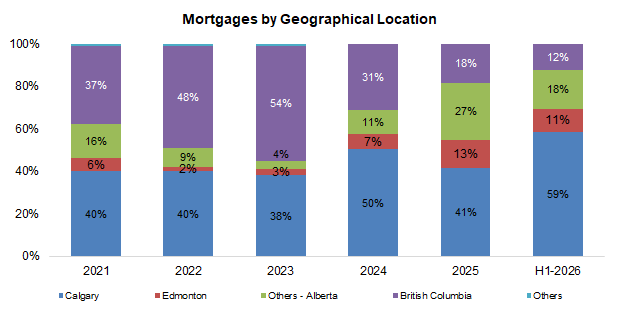
B.C. exposure ↓ as management sees better opportunities in Alberta
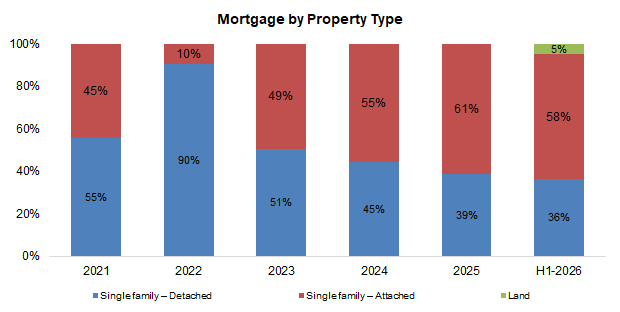
Remains focused on single-family units (construction)
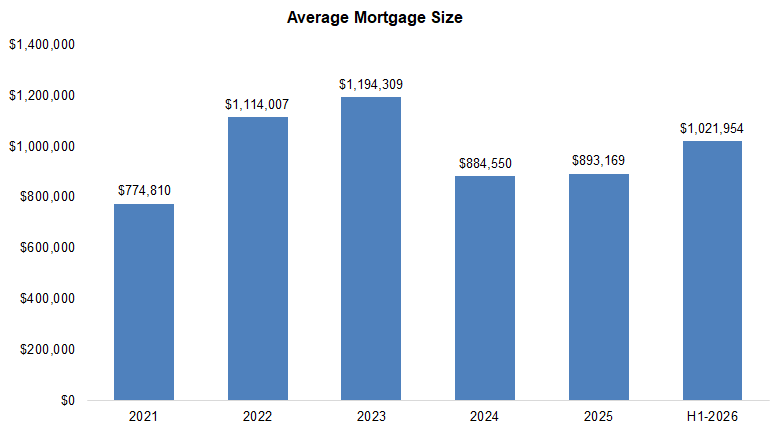
Average mortgage size ↑ 14% YTD to $1.02M, vs. 5-year average of $1.0M
Source: FRC / Company
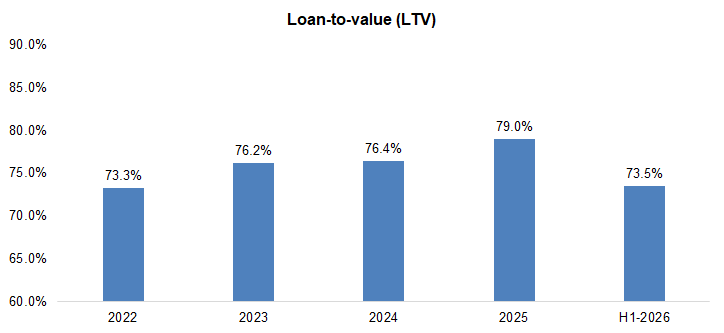
LTV ↓ 5.5 pp YTD to 73.5%, below the 5-yr avg. of 76%, indicating lower risk; the decline followed the write-off of a stage 3 mortgage
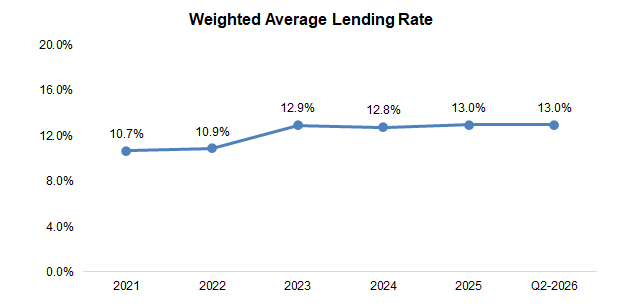
Lending rates remained relatively flat, given no material change in market rates
Source: FRC / Company
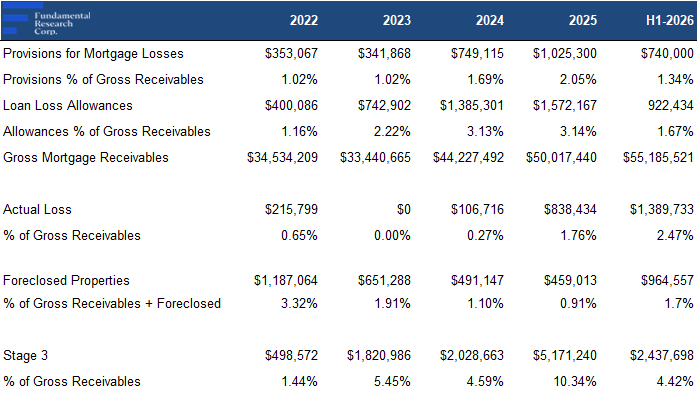
Major positive and key takeaway of the quarter: Stage 3 (impaired) mortgages ↓ 53% YTD to 4% of total mortgages, driving a 41% ↓ in allowances to 1.7% of mortgages outstanding
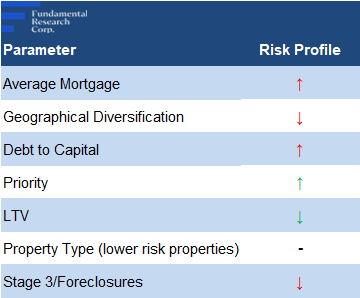
*Red (green) indicates an increase (decrease) in risk level.
Source: FRC
On a YTD basis, we believe the portfolio’s risk profile has decreased, driven by higher first-mortgage exposure, lower LTV, and fewer stage 3 mortgages
Financials
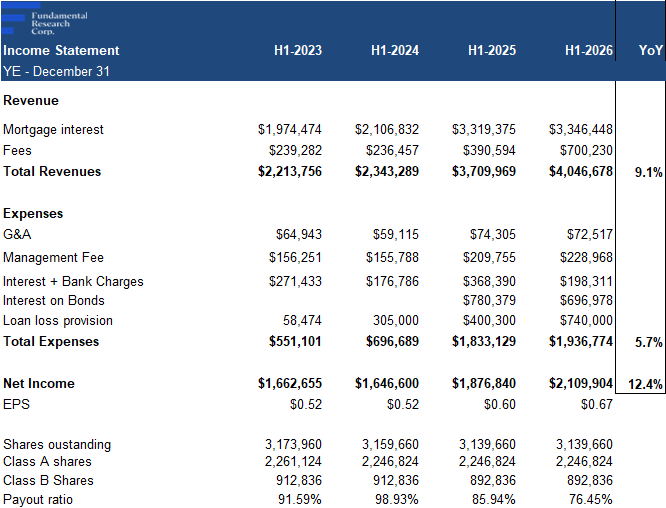
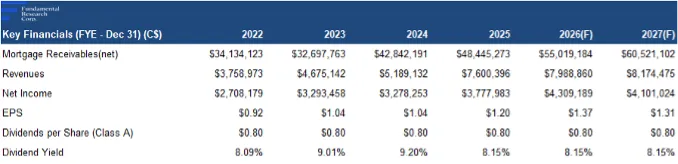
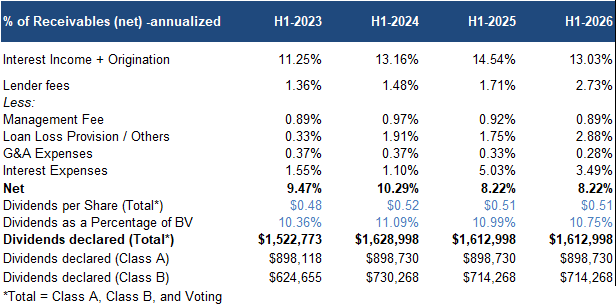
H1-2026 revenue ↑ 9% YoY, driven by higher receivables; 7% above our estimate
EPS ↑ 12% YoY, 11% above our estimate
Source: FRC / Company
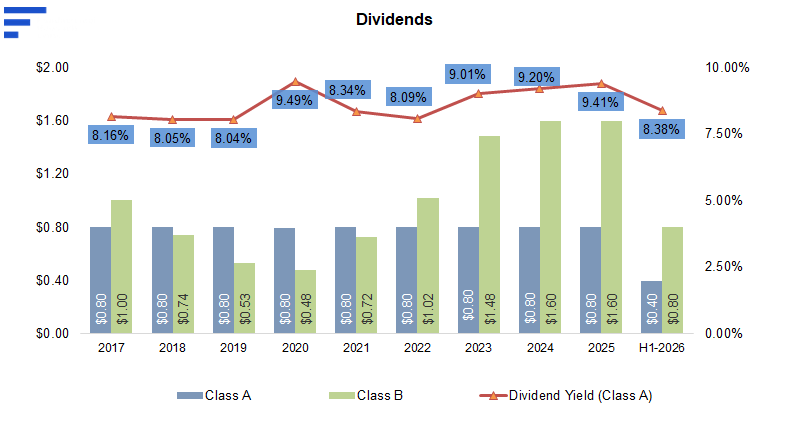
Dividends remained stable
* Yields were calculated based on the average share price for the given time period.
Note: Class A non-voting common shares are publicly listed, while Class B non-voting common shares are held by management and private investors. In terms of dividend distribution, Class A shares (public investors) rank first, followed by Class B shares. Class A shares will be paid $0.80 per share, before dividends are paid on Class B shares.
Dividends for Class A investors remained unchanged at $0.80/share, implying a yield of 8.16%
Source: FRC / Company
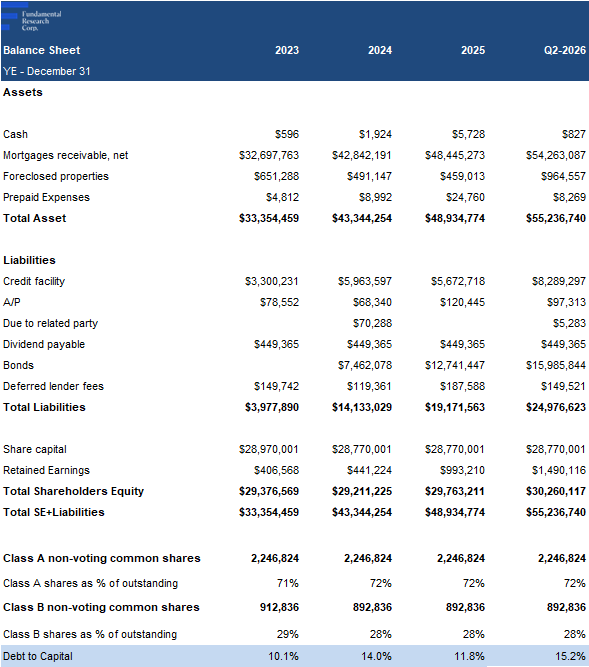
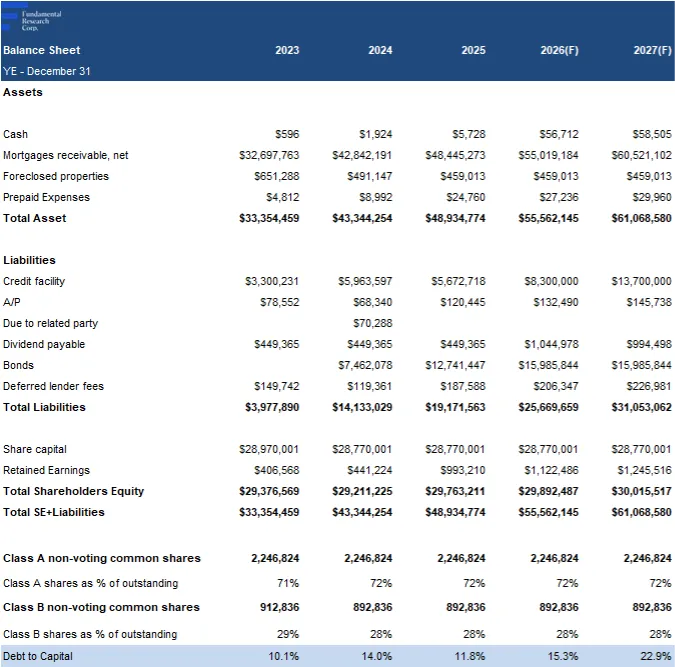
Debt-to-capital ↑ 3.4 pp YoY to 15%, driven by higher mortgage receivables
FRC’s Projections and Valuation
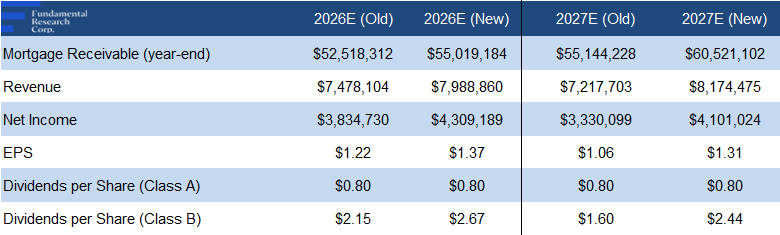
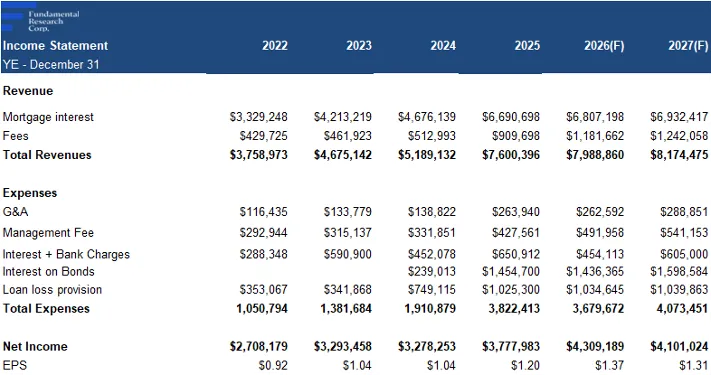
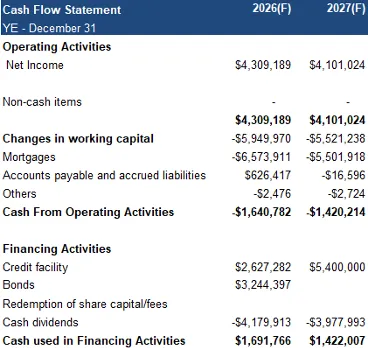
As H1 results beat our estimates, we are raising our 2026 and 2027 forecasts
Source: FRC
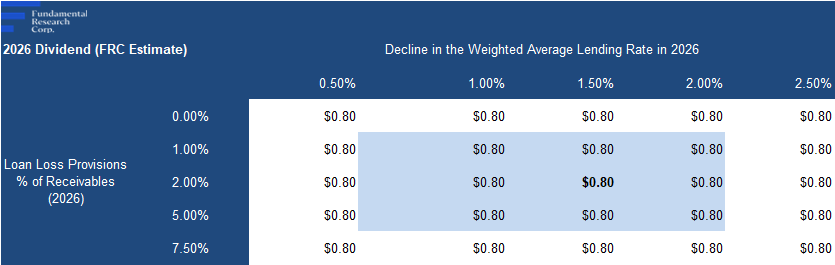
We believe the MIC can comfortably distribute its stated $0.80/share annual dividend
Source: S&P Capital IQ / FRC
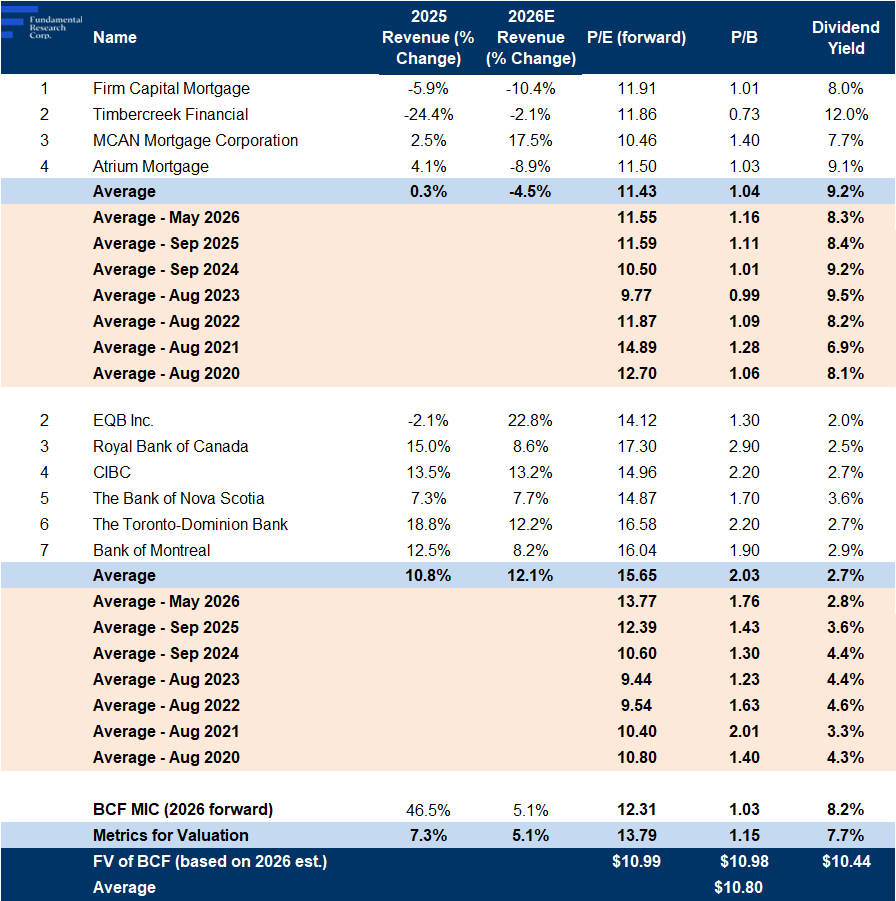
As shown in the table, MICs are expected to report ↓5% revenue growth in 2026, pressured by slower receivables growth amid commercial real estate softness, and lower rates, vs. ↑12% growth for banks, supported by stronger loan growth, and diversified businesses
Sector multiples are down 7% since our May 2026 report
Our fair value estimate declined from $10.89 to $10.80/share, driven by lower sector multiples, partially offset by our higher revenue and EPS estimates
We reiterate our BUY rating, and adjust our fair value estimate from $10.89 to $10.80/share, implying an expected return of 18% (including dividends) in the next 12 months.
BCF delivered a strong H1, with sharply lower credit risk, and an improving rate outlook supporting a recovery in mortgage originations. Following the beat, we raise our forecasts, and believe the valuation gap, and 8.2% dividend yield offer attractive upside potential.
Risks
The following, we believe, are the key risks of the company:
Maintaining our risk rating of 3 (Average)
APPENDIX
Discussion
Comments reflect the views of individual users, not FRC. Nothing posted in the comments section — by users or otherwise — should be taken as investment advice.