Disclosure: Enterprise Group, Inc. has paid FRC a fee for research coverage and distribution of reports. See last page for other important disclosures, rating, and risk definitions.
The analyst’s rating and fair value are one click away. Free FRC account, no credit card.
Already have an account?
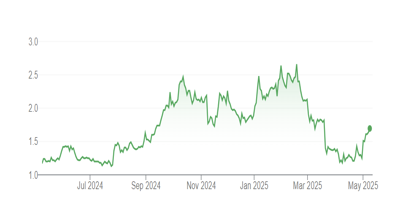
Price and Volume (1-year)
Enterprise vs Larger Players
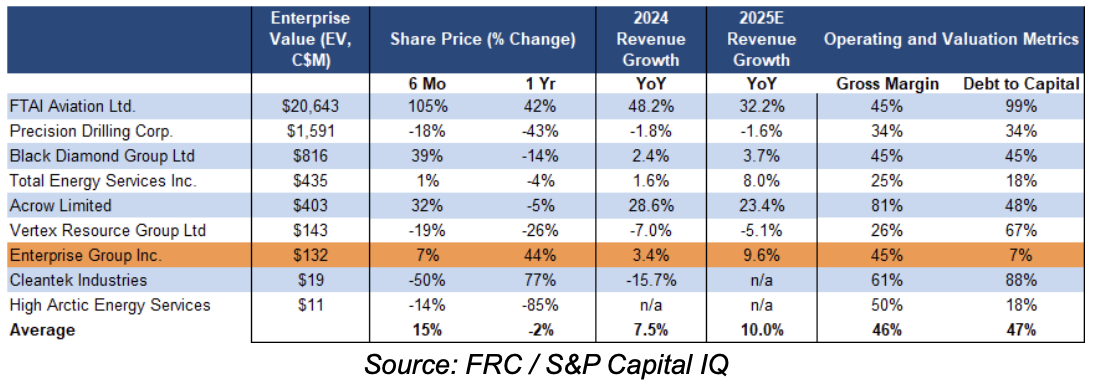
E is up 44% YoY, making it the second-best performing stock on our list of oilfield services companies. Ranked third in 2024 revenue growth, with the same position projected for 2025
Gross margins in line; debt-to-capital notably below the sector average
Financials
Q1-2025 revenue and EPS were down YoY due to a large one-time client gas project that boosted Q1-2024.
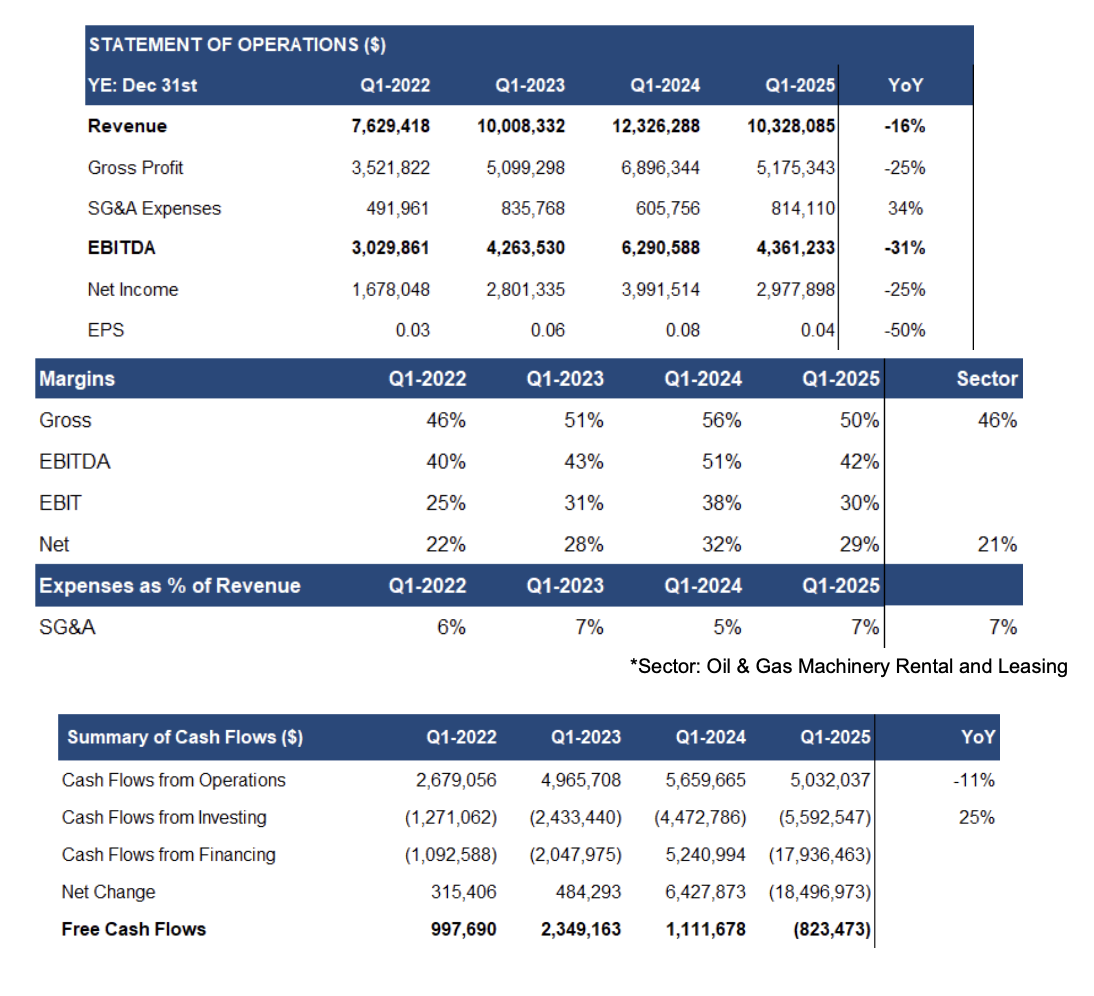
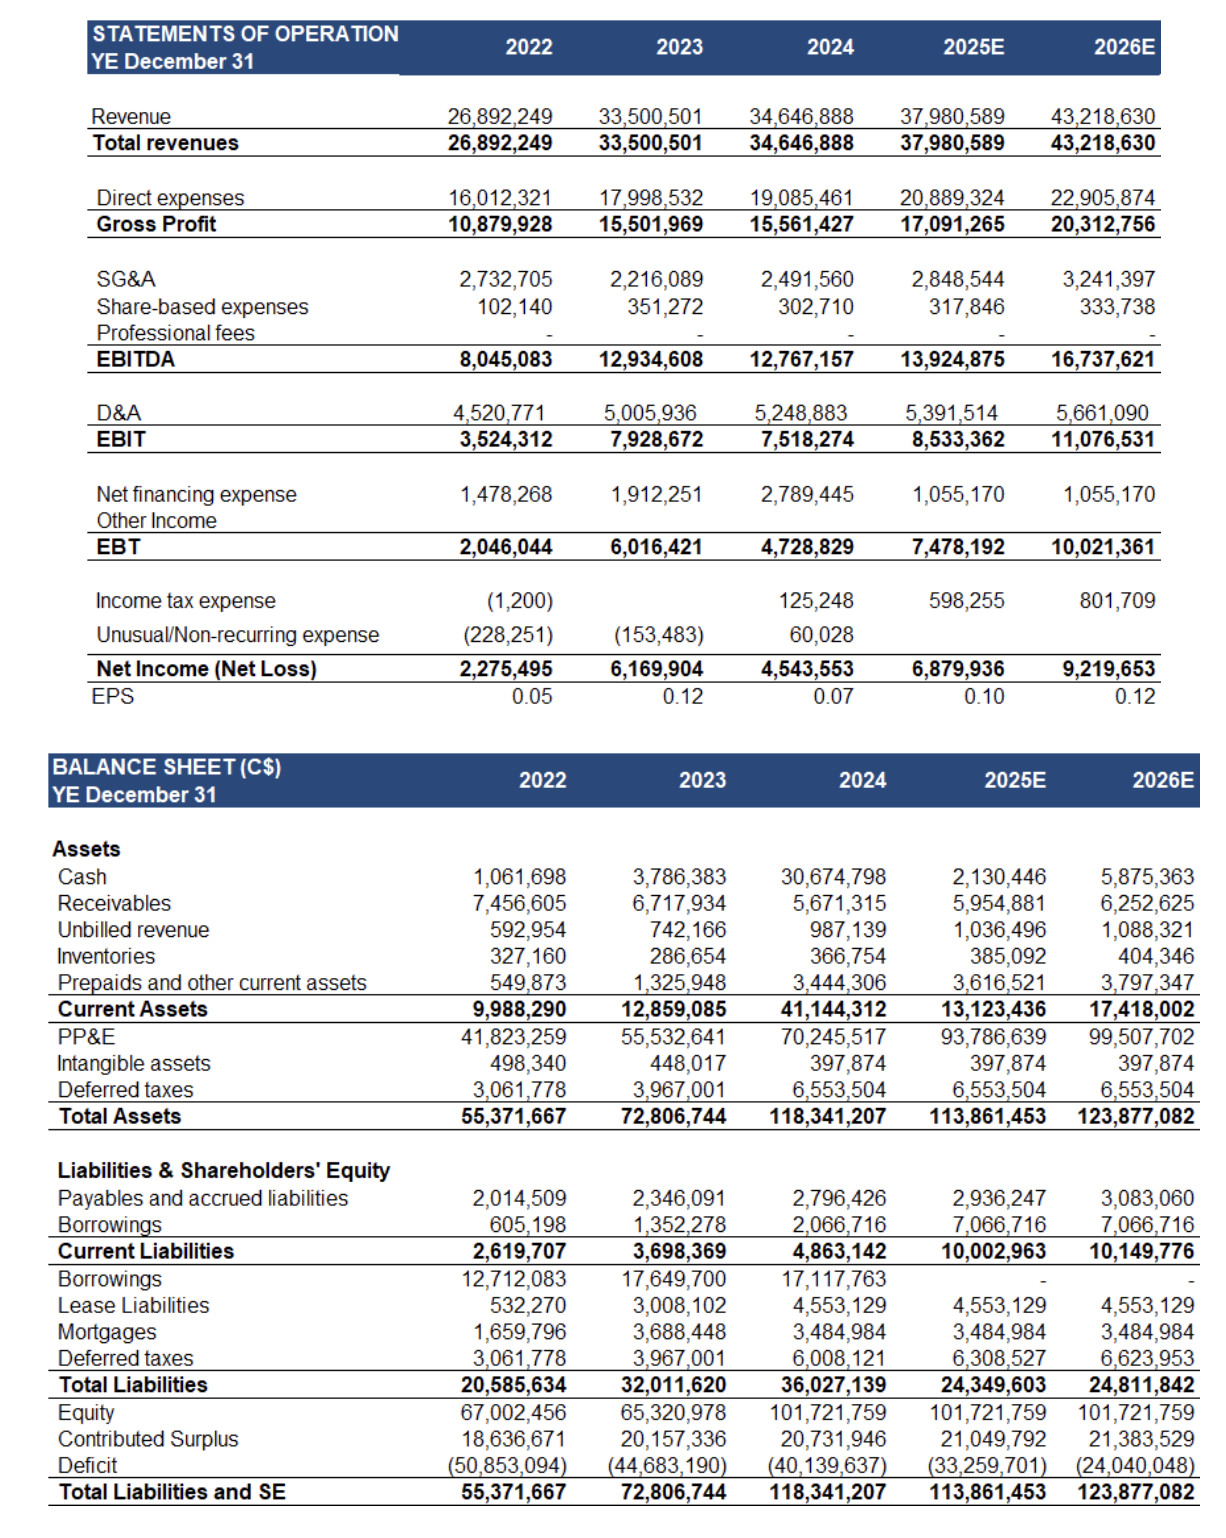
Q1 revenue declined 16% YoY, missing our estimate by 11%. Gross margins decreased 6 pp YoY to 50%, in line with our estimate, and above the historical average of 47%, and sector average of 46%
G&A expenses rose 36% YoY, and were 4% higher than our estimate. With expenses outpacing revenue, EPS fell 50% YoY to $0.04 vs our forecast of $0.06
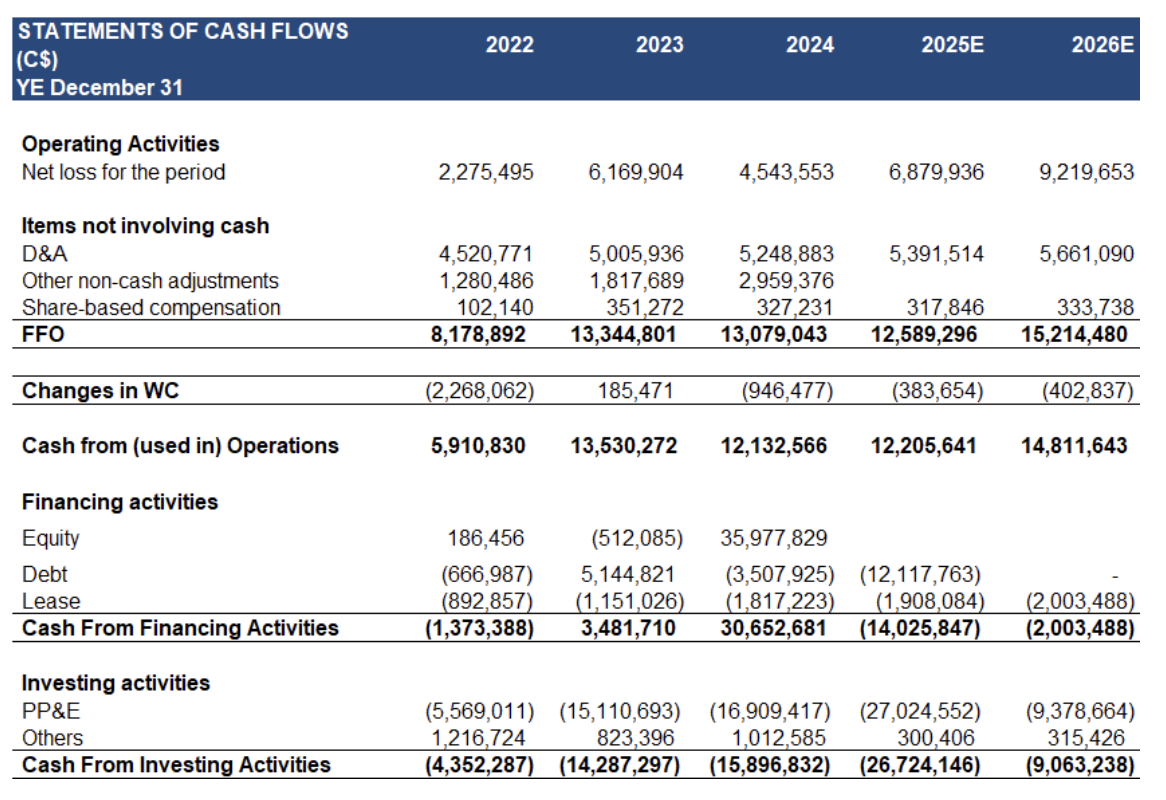
CAPEX increased 25% YoY to $6M, driven by heightened client demand necessitating new equipment purchases. Debt/capital declined QoQ (from 28% to 7%), reflecting the repayment of significant debt with
Appendix