
Namib Minerals
FRC CoverageNamib Minerals
FRC CoverageYour view on NAMM
Overview
What the company does, where it operates, and who runs it.
*Namib Minerals has paid FRC a fee for research coverage and distribution of reports.
About Namib Minerals
- Industry
- Gold
- Sector
- Basic Materials
- CEO
- Tulani Sikwila
- Headquarters
- KY
- Industry
- Gold
- Sector
- Basic Materials
- CEO
- Tulani Sikwila
- Headquarters
- KY
Namib Minerals operates as a gold producer in Africa and Democratic Republic of Congo. The company owns three gold mines (one active) in Zimbabwe, Africa. The company was incorporated in 2024 and is based in Grand Cayman, Cayman Islands.
Sign in to view
Sign in to view
Research Reports
FRC analyst coverage and recommendations.
Analyst Notes
Ongoing commentary and updates from FRC analysts.
Stock Data
Price chart, volume, and trading data.
Fair Value
What FRC thinks it is worth vs. the current price.
FRC's fair value estimate for Namib Minerals, and the rating behind it. NAMM last traded at $0.82, 0.3× trailing earnings — the estimate is read against that market price. Set by FRC's analysts in their research on the company: the current estimate, the rating, and when it was last revised. Included with a free account.
Financial Ratios
Profitability, returns, valuation, and leverage ratios.
Valuation, profitability, liquidity and leverage ratios for Namib Minerals. Starting points for Namib Minerals: P/E 0.3, EPS $3.07, beta -0.06 — an Gold name. P/E, P/B, EV/EBITDA, margins, return on equity, current ratio and debt coverage, each shown against the company's own history.
Dividend Analysis
Yield, payout ratio, and dividend coverage metrics.
Dividend history, yield and payout sustainability for Namib Minerals. Namib Minerals does not currently pay a regular dividend, so this section tracks capacity rather than history. Per-share payments, yield over time, payout ratio and growth streak, with coverage measured against free cash flow.
Earnings Analysis
EPS history, beat rate, and upcoming earnings reports.
Reported vs. expected earnings history for Namib Minerals. Trailing twelve-month EPS for Namib Minerals stands at $3.07. EPS surprises by quarter, revenue against estimates, and the upcoming reporting date.
Financial Statements
Income statement, balance sheet, and cash flow statements.
Income statement, balance sheet and cash flow history for Namib Minerals. Annual and quarterly filings with period-over-period comparison, so you can trace how revenue, margins and cash generation have moved.
Comparables
List of peer companies in the same industry.
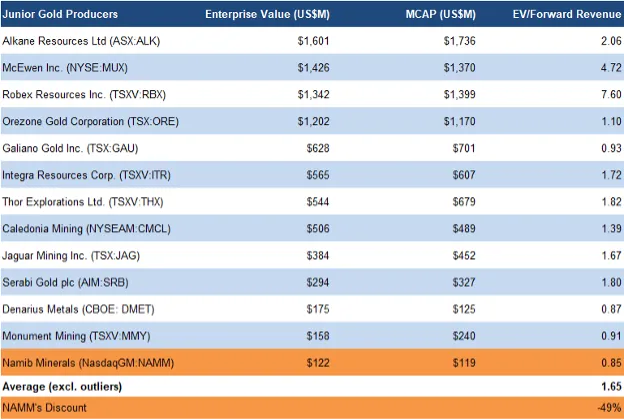
Namib Minerals valued side by side against its closest peers. Namib Minerals is measured against Gold peers within the Basic Materials sector. Peer-relative multiples and operating metrics, so the valuation is read in the context of its own sector rather than in isolation.
Institutional Ownership
Which funds and firms own the stock.
Which institutions hold Namib Minerals, and how their positions are changing. At a $45.9M market value, institutional positions materially move Namib Minerals's register. Top holders, position sizes, and quarter-over-quarter accumulation or distribution from regulatory filings.
Insider Trading
Recent buying and selling by company executives.
Buying and selling by Namib Minerals executives and directors. Insider transactions as disclosed to regulators, with role, size and date — the clearest read on how the people running the company are positioned.
News
Latest headlines and market coverage.
Latest headlines and company announcements for Namib Minerals. Coverage tracks Namib Minerals within Gold (Basic Materials). Press releases and market coverage, newest first.

Comments
Comments and replies from FRC members about this company.
No comments yet
Be the first to ask a question or say what you make of Namib Minerals.