

Namib Minerals
FRC CoverageNamib Minerals
FRC Coverage- P/E ratio
- 0.19
Your view on NAMM
Overview
What the company does, where it operates, and who runs it.
About Namib Minerals
- Industry
- Gold
- Sector
- Basic Materials
- CEO
- Tulani Sikwila
- Headquarters
- KY
Namib Minerals operates as a gold producer in Africa and Democratic Republic of Congo. The company owns three gold mines (one active) in Zimbabwe, Africa. The company was incorporated in 2024 and is based in Grand Cayman, Cayman Islands.
FRC is paid by the company for coverage
Research Reports
FRC analyst coverage and recommendations.
Research Reports
FRC is paid by the company for coverage
Analyst Notes
Ongoing commentary and updates from FRC analysts.
Nov 16, 2026 · 6 days ago · Latest
Company announcement
Benefits from Mill Expansion as Gold Output Ramps Up (All figures are in US$)
NAMM reported strong initial results following the expansion of its How Mine mill in Zimbabwe. October gold production rose 21% to 2,396 oz, compared with the Q3 monthly average of 1,981 oz. Cash costs were $1,155/oz, implying a margin of $2,706/oz at the current spot gold price of $3,861/oz. Planned power upgrades in Q1-2027 could further reduce costs to $1,067/oz, potentially improving margins further.
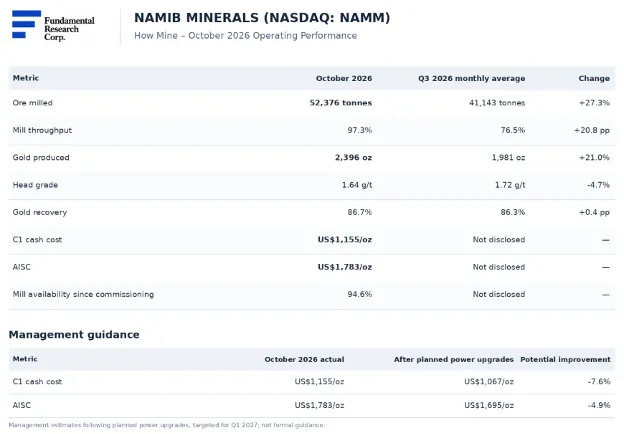
Source: FRC / Namib Minerals
We initiated coverage on NAMM earlier this month. The company owns three gold mines in Zimbabwe, How, Redwing, and Mazowe, with over 7 Moz in resources. How is currently operating, while Redwing is expected to enter small-scale production this month. We forecast gold production to increase 7% YoY in 2026, followed by 50% growth in 2027, reaching ~40 Koz.
Apr 13, 2026 · 7 months ago
Company announcement
Commencing due diligence; strong catalysts ahead, trading at a steep discount (All figures in US$)
We have initiated due diligence on NAMM, and expect to launch coverage in the coming weeks. The company holds a diversified portfolio of mining assets, including three gold projects in Zimbabwe, and 13 exploration licenses prospective for copper and cobalt in the Democratic Republic of the Congo. This provides diversification across geography, commodity exposure, and project stage.
NAMM’s gold portfolio consists of one producing asset, the How Mine (HM), and two restart projects, Mazowe (MM) and Redwing (RM), both historic producers. In 2025, HM produced 25 koz of gold, at a cash cost of $1,653/oz, implying strong margins at current spot prices ($4,750/oz), and generated $83M in revenue, and $46M in operating profit. Collectively, the three gold assets host 4 Moz in resources, which we note places the portfolio at the higher end of junior gold producers.
We believe the company is supported by several near and medium term catalysts:
(a) potential production growth at HM, with 2026 guidance from the company implying ~19% YoY growth;
(b) potential upside from the restart of MM & RM over the next two to three years; and
(c) longer-term potential exploration upside from its copper-cobalt assets in the DRC.
From a valuation perspective, we note that NAAM is trading at 0.85x forward revenue vs a sector average of 1.65x, a 49% discount. On a comparable basis, the company screens as one of the most undervalued junior gold producers.
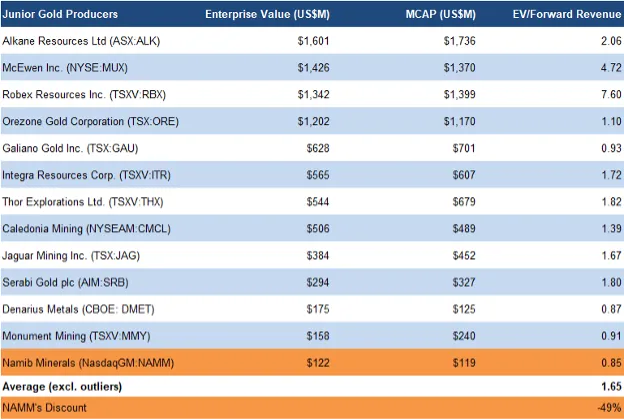
Source: FRC and S&P Capital IQ
NAAM is a relatively new public company, having listed on the NASDAQ in June 2025. We believe the market has yet to fully recognize the quality of its asset base, and the significance of its upcoming catalysts. Our initiation report will include a detailed valuation, supported by revenue and EPS projections.
FRC is paid by the company for coverage
Media
Infographics, videos, and posts covering the company.
X (Twitter)
Stock Data
Price chart, volume, and trading data.
What moved it
FRC Analyst Fair Value
FRC's analysts' fair value estimate and rating, from their research on the company.
About this section
FRC's fair value estimate for Namib Minerals, and the rating behind it. NAMM last traded at $0.62, 0.2× trailing earnings — the estimate is read against that market price. Set by FRC's analysts in their research on the company: the current estimate, the rating, and when it was last revised. Included with a free account.
Financial Ratios
Profitability, returns, valuation, and leverage ratios.
About this section
Valuation, profitability, liquidity and leverage ratios for Namib Minerals. Starting points for Namib Minerals: P/E 0.2, EPS $3.07, beta -0.06 — an Gold name. P/E, P/B, EV/EBITDA, margins, return on equity, current ratio and debt coverage, each shown against the company's own history.
Earnings Analysis
EPS history, beat rate, and upcoming earnings reports.
About this section
Reported vs. expected earnings history for Namib Minerals. Trailing twelve-month EPS for Namib Minerals stands at $3.07. EPS surprises by quarter, revenue against estimates, and the upcoming reporting date.
Wall Street Analyst Estimates
Analysts' price targets, ratings, and revenue and EPS estimates.
Earnings per share estimates
| Per share | This quarterSep 2026 | This yearYear to Dec 2026 | Next yearYear to Dec 2027 |
|---|---|---|---|
| Average estimate | $0.00 | $1.21 | $1.84 |
| Lowest estimate | $0.00 | $1.19 | $1.80 |
| Highest estimate | $0.00 | $1.23 | $1.88 |
| Number of analysts | 0 | 1 | 1 |
| A year ago | — | $1.841 | — |
| Growth vs a year ago | — | — | — |
1The year-ago figure includes one-time items, so growth is not shown.
Revenue estimates
| Total | This quarterSep 2026 | This yearYear to Dec 2026 | Next yearYear to Dec 2027 |
|---|---|---|---|
| Average estimate | $26.39M | $143.20M | $243.00M |
| Lowest estimate | $26.39M | $141.10M | $239.43M |
| Highest estimate | $26.39M | $145.30M | $246.57M |
| Number of analysts | 1 | 1 | 1 |
| A year ago | — | $82.59M | — |
| Growth vs a year ago | — | +73.4% | — |
Financial Statements
Income statement, balance sheet, and cash flow statements.
About this section
Income statement, balance sheet and cash flow history for Namib Minerals. Annual and quarterly filings with period-over-period comparison, so you can trace how revenue, margins and cash generation have moved.
Comparables
List of peer companies in the same industry.
| Ticker | Type | Company | Sector | Industry | Mkt cap |
|---|---|---|---|---|---|
| ATLXAtlas Lithium Corporation | Basic Materials | Industrial Materials | $42.0M | ||
| FEAM5E Advanced Materials Inc. | Basic Materials | Chemicals - Specialty | $61.6M | ||
| FURYFury Gold Mines Limited | Basic Materials | Other Precious Metals | $74.7M | ||
| GOROGold Resource Corporation | Basic Materials | Gold | $220.1M | ||
| GROBrazil Potash Corp. | Basic Materials | Industrial Materials | $82.6M | ||
| LOOPLoop Industries, Inc. | Basic Materials | Chemicals - Specialty | $11.7M | ||
| NEXMNexMetals Mining Corp. | Basic Materials | Other Precious Metals | $30.3M | ||
| Ticker | Type | Company | Sector | Exchange | Mkt cap |
|---|---|---|---|---|---|
| LAT.AXLatitude 66 Limited | Basic Materials | ASX | — | ||
| LCKYFGolden Sky Minerals Corp. | Basic Materials | OTC | $4.5M | ||
| LECBFLepanto Consolidated Mining Company | Basic Materials | OTC | $265.5M | ||
| LGC.VLavras Gold Corp. | Basic Materials | TSXV | $115.7M | ||
| LGCFFLavras Gold Corp. | Basic Materials | OTC | $133.2M | ||
| LGD.TOLiberty Gold Corp. | Basic Materials | TSX | $846.5M | ||
| LGDTFLiberty Gold Corp. | Basic Materials | OTC | $582.9M | ||
| LIO.VLion One Metals Limited | Basic Materials | TSXV | $52.0M | ||
| LKAILKA Gold Incorporated | Basic Materials | OTC | $2,770 | ||
| LME.VLaurion Mineral Exploration Inc. | Basic Materials | TSXV | $55.6M | ||
| LMEFFLaurion Mineral Exploration Inc. | Basic Materials | OTC | $45.3M | ||
| LNCLFLincoln Gold Mining Inc. | Basic Materials | OTC | $4.7M | ||
| Ticker | Fund | Fund assets | % of the fund |
|---|---|---|---|
| IWCiShares Micro-Cap ETF | $1.2B in assets | 0.00% | |
Largest holders first, then the funds most concentrated in NAMM.
Institutional Ownership
Which funds and firms own the stock.
About this section
Which institutions hold Namib Minerals, and how their positions are changing. At a $34.6M market value, institutional positions materially move Namib Minerals's register. Top holders, position sizes, and quarter-over-quarter accumulation or distribution from regulatory filings.
Insider Trading
Recent buying and selling by company executives.
About this section
Buying and selling by Namib Minerals executives and directors. Insider transactions as disclosed to regulators, with role, size and date — the clearest read on how the people running the company are positioned.
News
Latest headlines and market coverage.
About this section
Latest headlines and company announcements for Namib Minerals. Coverage tracks Namib Minerals within Gold (Basic Materials). Press releases and market coverage, newest first.
Comments
Comments and replies from FRC members about this company.
No comments yet
Be the first to ask a question or say what you make of Namib Minerals.