
We reiterate our BUY rating, and increase our fair value estimate from $0.39 to $0.51/share, reflecting resource growth, and higher sector valuations. We believe the market has misinterpreted the updated resource estimate by focusing on the 2% decline in AgEq ounces, and assuming resource deterioration, despite improvements in AuEq ounces.
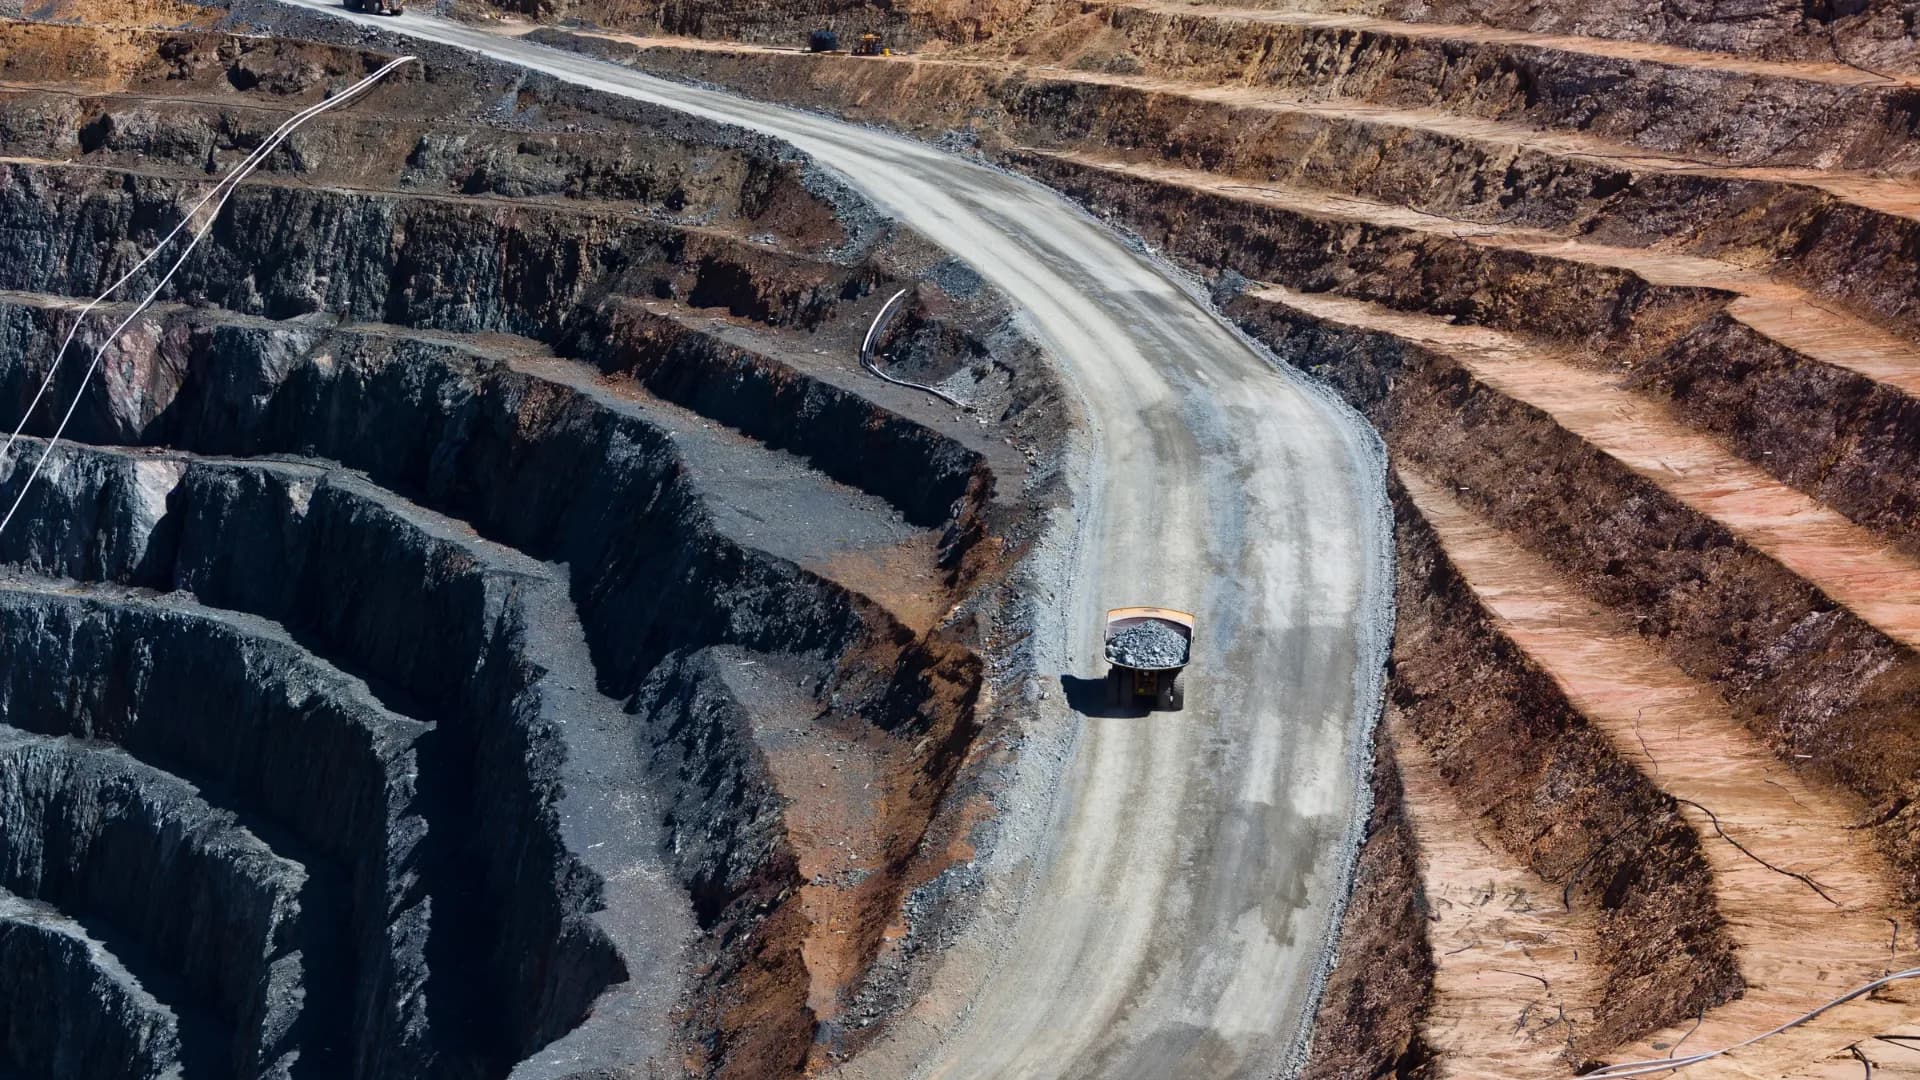
Resource Growth & Market Mispricing
Paused · 8:20 left · FRC · read by an AI voice
Disclosure: Equity Metals Corporation has paid FRC a fee for research coverage and distribution of reports. This fee creates a potential conflict of interest which readers should consider. See last page for other important disclosures, rating, and risk definitions.
All figures in C$ unless otherwise specified. *QP: Robert MacDonald, Msc., P.Geo., VP Exploration of Equity Metals Corporation.
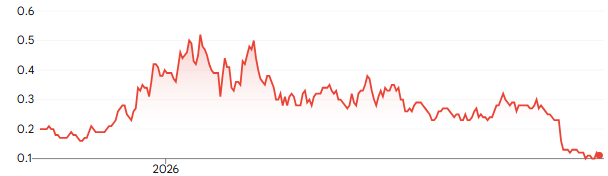
| YTD | 12M | |
|---|---|---|
| EQTY | -77% | -55% |
| TSXV | -17% | - 19% |
| Gold | -6% | -1% |
| GOEX | -3% | +6% |
| Key Financial Data (FYE - Aug 31) | |
|---|---|
| C$ | FY2026 (9M) |
| Revenue | - |
| Cash | $7,357,422 |
| Working Capital | $6,272,327 |
| Total Assets | $8,979,257 |
| Net Income (Loss) | -$7,702,154 |
| EPS | -$0.03 |
EQTY’s portfolio is anchored by its 100% owned Silver Queen flagship project in B.C., which hosts a high-grade silver and base metals resource. EQTY is planning preliminary exploration drilling at its recently optioned Arlington project. EQTY has no immediate development plans for its early-stage, non-core diamond and silica projects.
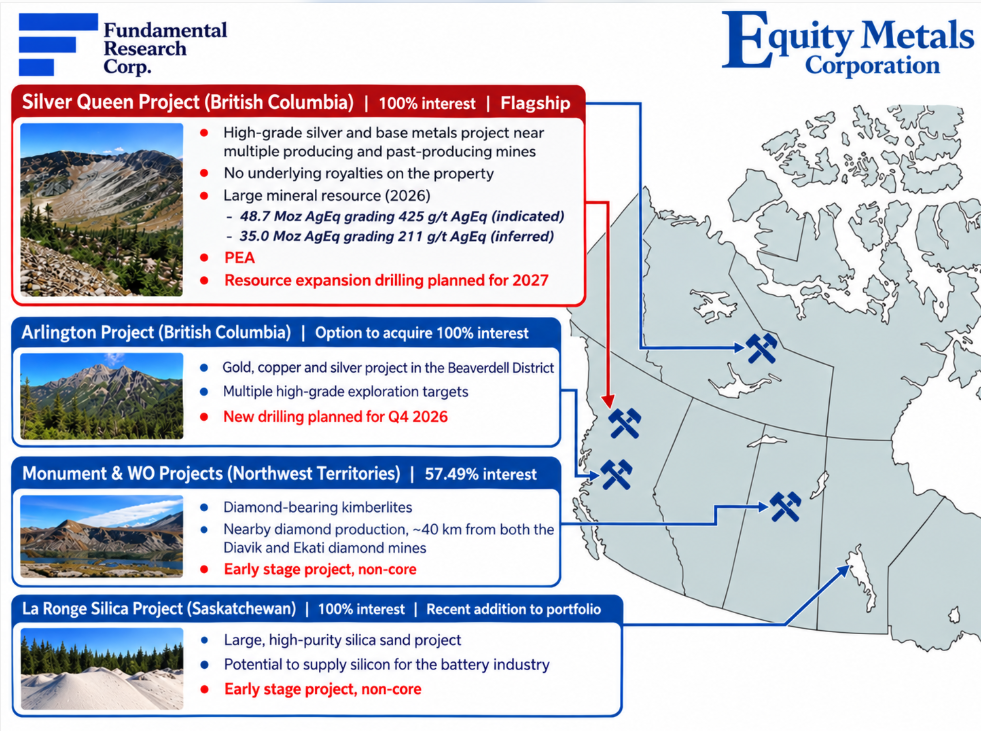
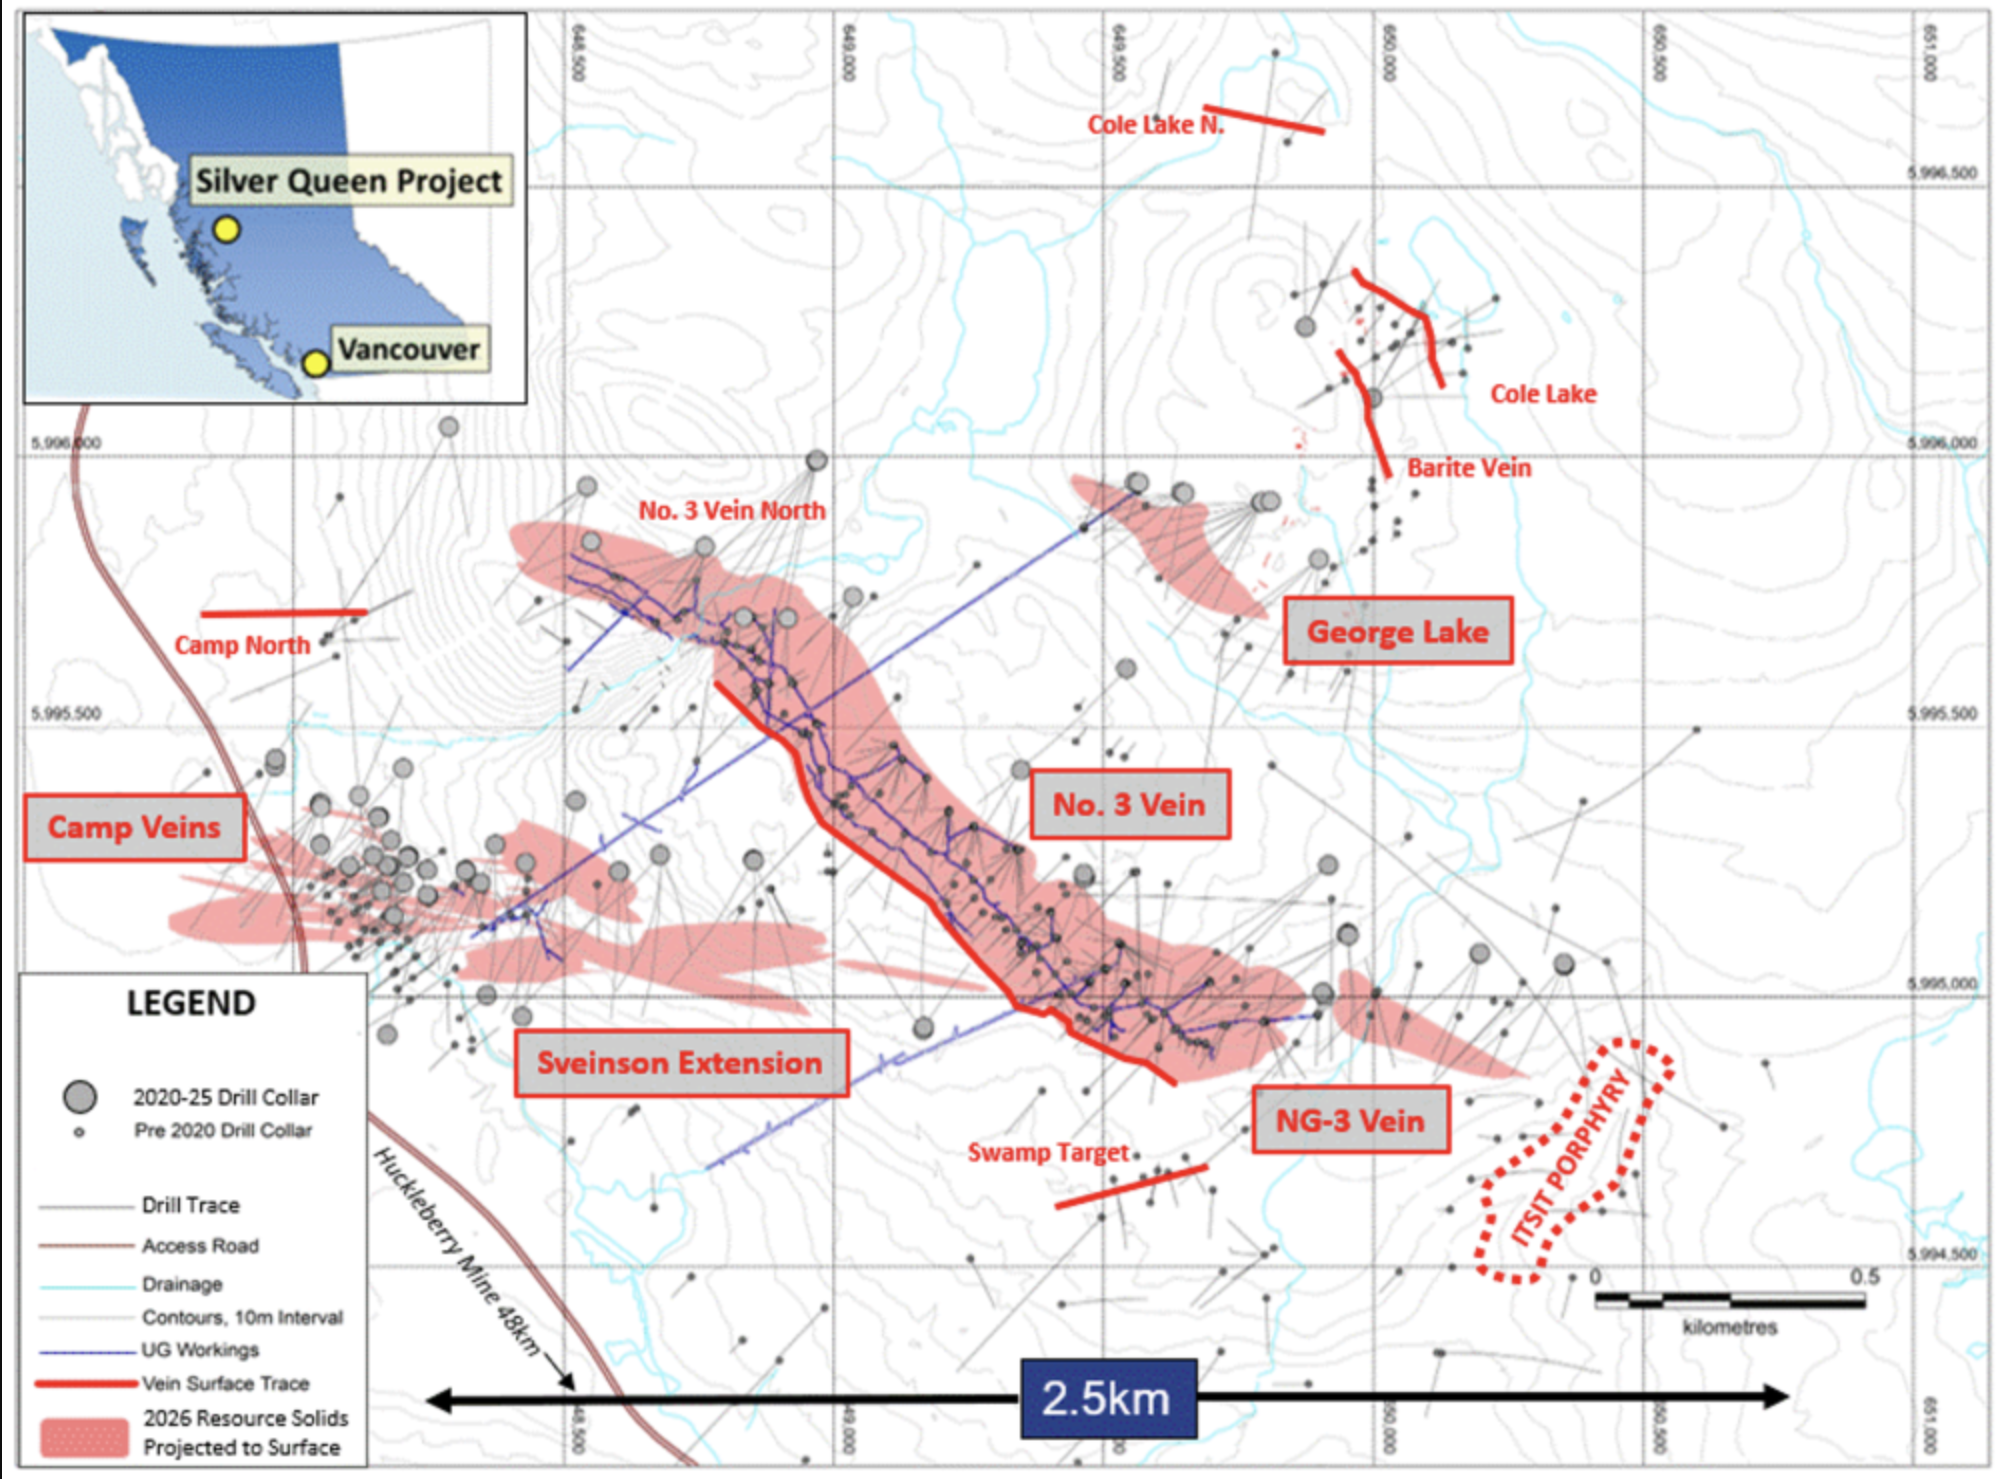
Silver Queen is located 590 km northwest of Vancouver, B.C., with access to existing power, roads, and rail. Proximity to major and mid-tier miners may create potential M&A opportunities.
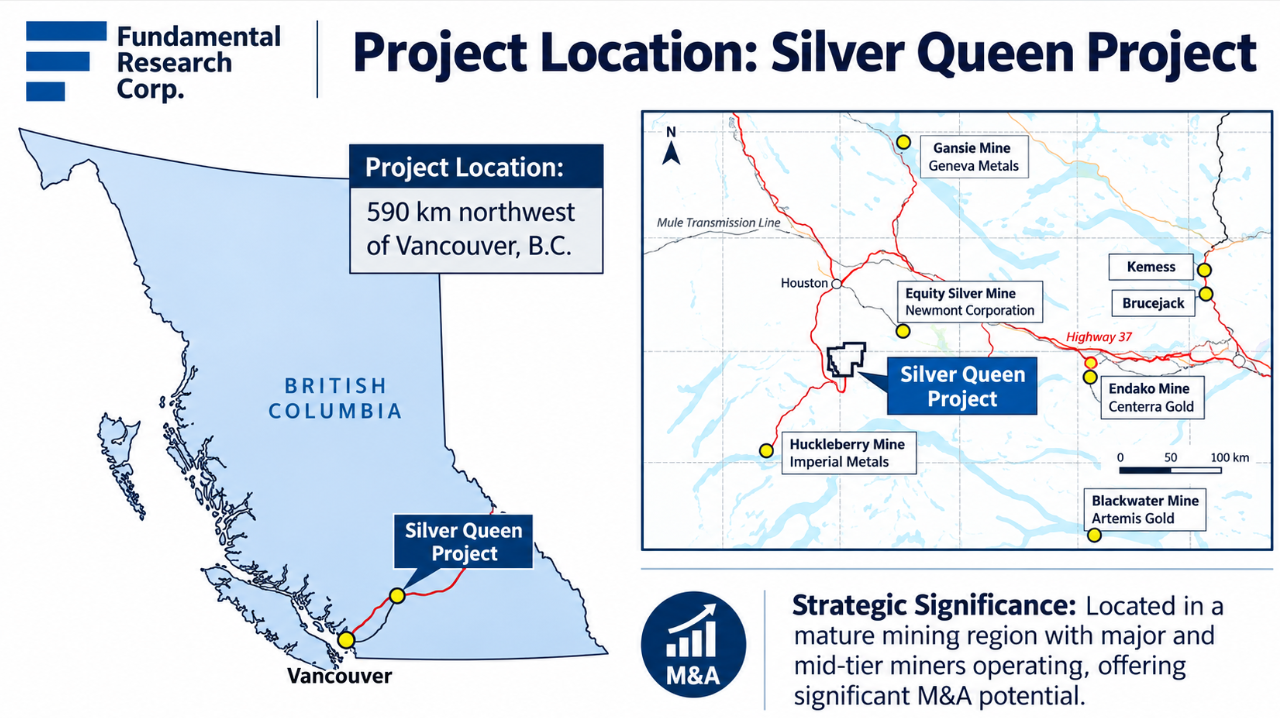
In September 2026, the company announced an updated resource estimate based on 165 drill holes (60,162 m), compared to the 2022 estimate, which was based on 78 holes (25,659 m).
Silver and gold contained metal increased by 23% and 14%, respectively, while copper, lead, and zinc rose by an average of 44%. Overall, contained AuEq increased by 22% to 1.27 Moz, vs. our forecast of 30%.
2026 Resource Estimate
| Category | Tonnage | Average Grade | Contained Metal | |||||||
|---|---|---|---|---|---|---|---|---|---|---|
| g/t AgEq | g/t AuEq | Ag Koz | Au Koz | Cu Mlbs | Pb Mlbs | Zn Mlbs | AgEq Koz | AuEq Koz | ||
| Indicated | 3,565 | 425.0 | 6.40 | 21,037 | 210 | 21 | 55 | 299 | 48,671 | 737 |
| Inferred | 5,157 | 211.0 | 3.20 | 17,314 | 117 | 21 | 46 | 188 | 34,950 | 529 |
| 2026 Total | 8,722 | 298.5 | 4.51 | 38,351 | 327 | 42 | 101 | 487 | 83,621 | 1,266 |
| % Change vs 2022 | 62% | -40% | -25% | 23% | 14% | 50% | 42% | 39% | -2% | 22% |
2022 Resource Estimate
| Category | Tonnage | Average Grade | Contained Metal | |||||||
|---|---|---|---|---|---|---|---|---|---|---|
| g/t AgEq | g/t AuEq | Ag Koz | Au Koz | Cu Mlbs | Pb Mlbs | Zn Mlbs | AgEq Koz | AuEq Koz | ||
| Indicated | 3,455 | 565.0 | 6.90 | 20,976 | 237 | 18 | 48 | 267 | 62,792 | 765 |
| Inferred | 1,920 | 365.0 | 4.40 | 10,298 | 50 | 10 | 23 | 84 | 22,536 | 273 |
| 2022 Total | 5,375 | 493.6 | 6.01 | 31,274 | 287 | 28 | 71 | 351 | 85,328 | 1,038 |
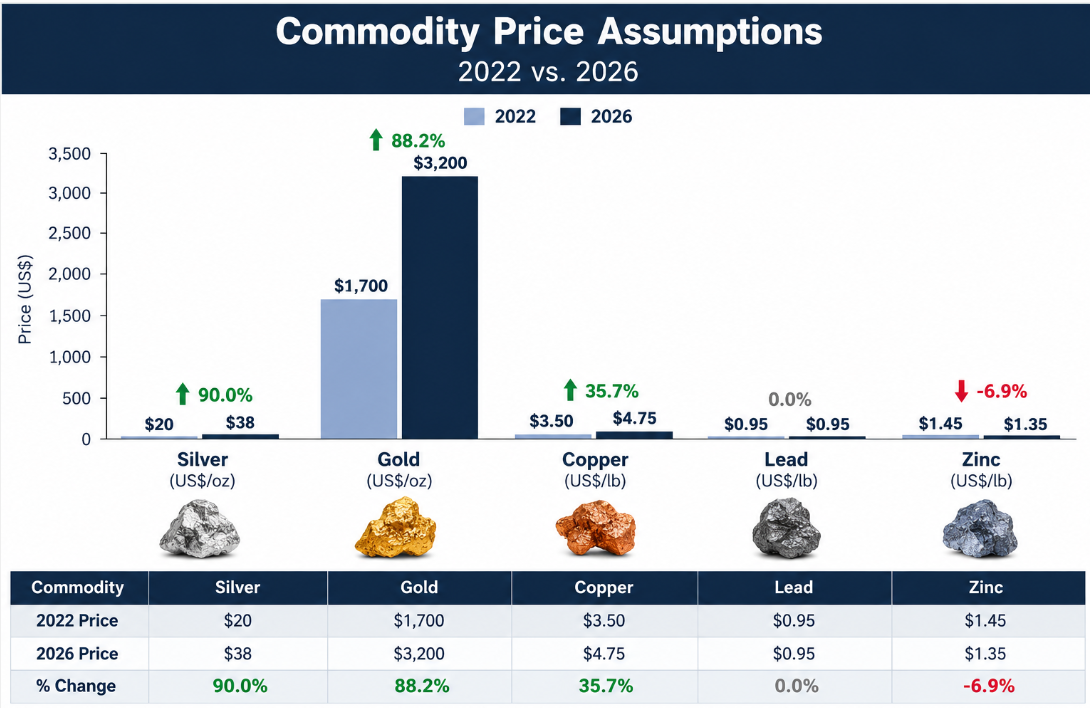
AgEq declined 2% to 84 Moz, largely due to higher silver prices lowering conversion ratios for other metals; we view this as a calculation-driven change rather than a deterioration in the underlying resource. In addition, average grade declined 25% to 4.51 g/t AuEq as lower-grade material was added, reflecting the potential to include more material at currently higher metal prices. Overall, we believe higher contained AuEq, and stronger metal prices support improved project potential vs. 2022, partly offset by the impact of lower grades.
The resource covers five of 20 known veins, up from four in the previous estimate: No. 3, NG3, Camp, Sveinson, and the newly added George Lake vein. EQTY aims to complete a PEA by Q1-2027, which will provide further insight into the project’s economic potential.
Mineralized Zones
EQTY has a strong balance sheet.
| Key Financial Data (FYE - Aug 31) | FY2026 (9M) |
|---|---|
| Cash | $7,357,422 |
| Working Capital | $6,272,327 |
| Current Ratio | 4.83 |
| LT Debt | - |
| Monthly Burn Rate (incl. G&A) | -$73,377 |
| Project Related | -$4,155,571 |
| Cash from Financing Activities | $8,588,021 |
| Options | # | Exercise Price | Amount |
|---|---|---|---|
| Total | 22,275,000 | $0.28 | $6,179,250 |
| In-the-Money | - | - | - |
| Warrants | # | Exercise Price | Amount |
|---|---|---|---|
| Total | 29,605,460 | $0.30 | $8,758,510 |
| In-the-Money | - | - | - |
EQTY trades at just $16/AuEq oz, vs. the peer average of $82/oz (previously $68/oz), an 80% discount, making it the most undervalued stock in our peer group. Applying the peer average to EQTY’s resources implies a fair value of $0.51/share (previously $0.39/share).
| Gold Juniors | EV / Resource* | |
|---|---|---|
| 1 | Talamore Mining Corp. | $349 |
| 2 | Radisson Mining Resources | $340 |
| 3 | Snowline Gold Corp | $327 |
| 4 | 1911 Gold | $305 |
| 5 | Amex Gold Mining | $269 |
| 6 | West Red Lake Gold Mines | $188 |
| 7 | Gold X2 Mining | $145 |
| 8 | NorthIsle Copper and Gold | $137 |
| 9 | Troilus Mining | $66 |
| 10 | Maple Gold Mines Ltd. | $60 |
| 11 | Cartier Resources | $57 |
| 12 | Trident Resources | $53 |
| 13 | NexGold Mining | $48 |
| 14 | Sirios Resources | $45 |
| 15 | GMV Minerals | $41 |
| 16 | Doubleview Gold | $40 |
| 17 | Western Exploration | $40 |
| 18 | Fury Gold | $29 |
| 19 | Equity Metals | $16 |
| Average (excluding outliers) | $82 | |
We reiterate our BUY rating, and increase our fair value estimate from $0.39 to $0.51/share, reflecting resource growth, and higher sector valuations. We believe the market has misinterpreted the updated resource estimate by focusing on the 2% decline in AgEq ounces, and assuming resource deterioration, despite improvements in AuEq ounces. We believe this disconnect presents an attractive mispricing opportunity ahead of the upcoming PEA.
We are maintaining our risk rating of 5 (Highly Speculative). We believe the company is exposed to the following risks (list is non-exhaustive):
Sid Rajeev, B.Tech, MBA, CFA — Head of Research, Fundamental Research Corp.
Nina Rose Coderis, B.Sc (Geology) — Equity Analyst, Fundamental Research Corp.
The full report — the designed PDF with all charts and the complete disclosure — remains available as published, free of charge with a free account. This page is the same analysis in the form a search engine, an AI assistant and a phone screen can read.
Buy – Fair value is 12% above the current market price; or risk and reward is favorable
Hold – Fair value is between 5% to 12% above the current market price
Sell – Fair value is 5% above, or less, than the current market value; or risk and reward is unfavorable
Suspended or Rating N/A— Coverage and ratings suspended until more information can be obtained from the company regarding recent events.
1 (Low Risk) - The company operates in an industry where it has a strong position (for example a monopoly, high market share etc.) or operates in a regulated industry. The future outlook is stable or positive for the industry. The company generates positive free cash flow and has a history of profitability. The capital structure is conservative with little or no debt.
2 (Below Average Risk) - The company operates in an industry where the fundamentals and outlook are positive. The industry and company are relatively less sensitive to systematic risk than companies with a Risk Rating of 3. The company has a history of profitability and has demonstrated its ability to generate positive free cash flows (though current free cash flow may be negative due to capital investment). The company’s capital structure is conservative with little to modest use of debt.
3 (Average Risk) - The company operates in an industry that has average sensitivity to systematic risk. The industry may be cyclical. Profits and cash flow are sensitive to economic factors although the company has demonstrated its ability to generate positive earnings and cash flow. Debt use is in line with industry averages, and coverage ratios are sufficient.
4 (Speculative) - The company has little or no history of generating earnings or cash flow. Debt use is higher. These companies may be in start-up mode or in a turnaround situation. These companies should be considered speculative.
5 (Highly Speculative) - The company has no history of generating earnings or cash flow. They may operate in a new industry with new, and unproven products. Products may be at the development stage, testing, or seeking regulatory approval. These companies may run into liquidity issues and may rely on external funding. These stocks are considered highly speculative.
Definition of FRC’s Fair Value Estimate – Our fair value estimate is the theoretical value of the company’s equity using widely accepted methods of valuation such as discount cash flow or comparables. IT IS NOT A TARGET PRICE or PREDICTION OF THE FUTURE STOCK PRICE.
Analyst Certification: The views expressed in this report accurately reflect the personal views of the analyst, and no part of their compensation was, is, or will be directly or indirectly related to the specific recommendation or views expressed.
Any “forward looking statements” are our best estimates and opinions based upon information that is publicly available and that we believe to be correct, but we have not independently verified with respect to truth or correctness. There is no guarantee that our forecasts will materialize. Actual results will likely vary. The analyst and Fundamental Research Corp. “FRC” does not own any shares of the subject company, does not make a market or offer shares for sale of the subject company, and does not have any investment banking business with the subject company. Fees ranging between $30,000 and $40,000 have been paid to FRC by Equity Metals Corporation to commission this report, research coverage, and distribution of reports. This fee creates a potential conflict of interest which readers should consider. FRC takes steps to mitigate conflicts including setting fees in advance and utilizing analysts who must abide by CFA Institute Code of Ethics and Standards of Professional Conduct. Additionally, analysts may not trade in any security under coverage. Our full editorial control of all research, timing of release of the reports, and release of liability for negative reports are protected contractually. The issuer has agreed to a minimum coverage term and coverage cannot be unilaterally terminated. Distribution procedure: our reports are distributed first to our web-based subscribers on the date shown on this report then made available to delayed access users through various other channels for a limited time.
The distribution of FRC’s ratings are as follows: BUY (76%), HOLD (2%), SELL / SUSPEND (22%).
This report contains "forward looking" statements. Forward-looking statements regarding the Company and/or stock’s performance inherently involve risks and uncertainties that could cause actual results to differ from such forward-looking statements. Factors that would cause or contribute to such differences include, but are not limited to, continued acceptance of the Company's products/services in the marketplace; acceptance in the marketplace of the Company's new product lines/services; competitive factors; new product/service introductions by others; technological changes; dependence on suppliers; systematic market risks and other risks discussed in the Company's periodic report filings, including interim reports, annual reports, and annual information forms filed with the various securities regulators. By making these forward-looking statements, Fundamental Research Corp. and the analyst/author of this report undertakes no obligation to update these statements for revisions or changes after the date of this report. A report initiating coverage will most often be updated quarterly while a report issuing a rating may have no further or less frequent updates because the subject company is likely to be in earlier stages where nothing material may occur quarter to quarter.
Fundamental Research Corp DOES NOT MAKE ANY WARRANTIES, EXPRESSED OR IMPLIED, AS TO RESULTS TO BE OBTAINED FROM USING THIS INFORMATION AND MAKES NO EXPRESS OR IMPLIED WARRANTIES OR FITNESS FOR A PARTICULAR USE. ANYONE USING THIS REPORT ASSUMES FULL RESPONSIBILITY FOR WHATEVER RESULTS THEY OBTAIN FROM WHATEVER USE THE INFORMATION WAS PUT TO. ALWAYS TALK TO YOUR FINANCIAL ADVISOR BEFORE YOU INVEST. WHETHER A STOCK SHOULD BE INCLUDED IN A PORTFOLIO DEPENDS ON ONE’S RISK TOLERANCE, OBJECTIVES, SITUATION, RETURN ON OTHER ASSETS, ETC. ONLY YOUR INVESTMENT ADVISOR WHO KNOWS YOUR UNIQUE CIRCUMSTANCES CAN MAKE A PROPER RECOMMENDATION AS TO THE MERIT OF ANY PARTICULAR SECURITY FOR INCLUSION IN YOUR PORTFOLIO. This REPORT is solely for informative purposes and is not a solicitation or an offer to buy or sell any security. It is not intended as being a complete description of the company, industry, securities or developments referred to in the material. Any forecasts contained in this report were independently prepared unless otherwise stated and HAVE NOT BEEN endorsed by the Management of the company which is the subject of this report. Additional information is available upon request. THIS REPORT IS COPYRIGHT. YOU MAY NOT REDISTRIBUTE THIS REPORT WITHOUT OUR PERMISSION. Please give proper credit, including citing Fundamental Research Corp and/or the analyst, when quoting information from this report. The information contained in this report is intended to be viewed only in jurisdictions where it may be legally viewed and is not intended for use by any person or entity in any jurisdiction where such use would be contrary to local regulations or which would require any registration requirement within such jurisdiction.



.webp&w=128&q=75)




Discussion
Comments reflect the views of individual users, not FRC. Nothing posted in the comments section — by users or otherwise — should be taken as investment advice.