Disclosure: Olympia Financial Group Inc. has paid FRC a fee for research coverage and distribution of reports. See last page for other important disclosures, rating, and risk definitions.
The analyst’s rating and fair value are one click away. Free FRC account, no credit card.
Already have an account?
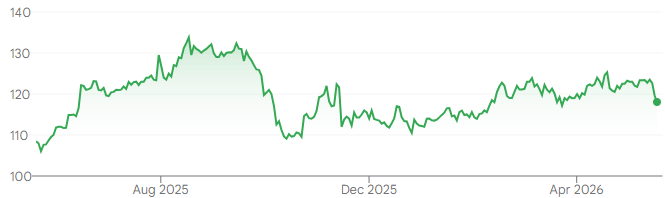
Price and Volume (1-year)
* Olympia Financial Group has paid FRC a fee for research coverage and distribution of reports. See last page for other important disclosures, rating, and risk definitions. All figures in C$ unless otherwise specified.
The leading Canadian custodian/ administrator of alternative investments
Primary Services
OLY’s platform supports a broad range of investments typically not offered by banks or traditional trading platforms
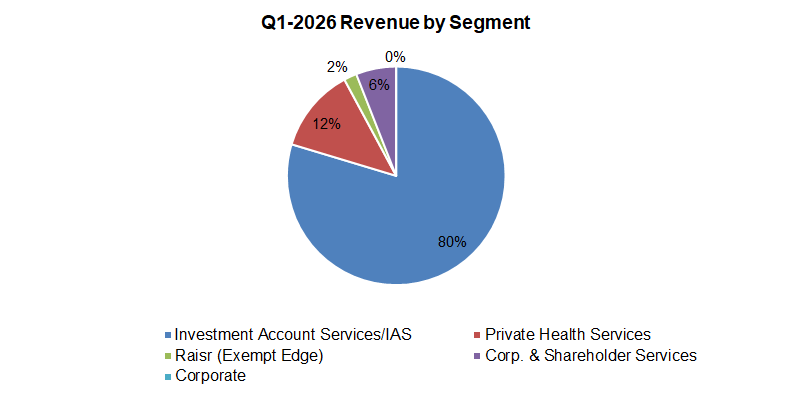
In Q1-2026, the revenue mix remained stable: 80% from IAS (81% in Q1-2025), 12% from private health services (11%), and 8% (7%) from other services
Source: Company / FRC
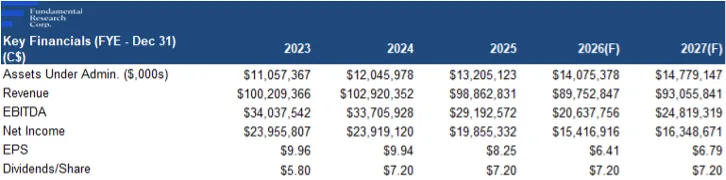
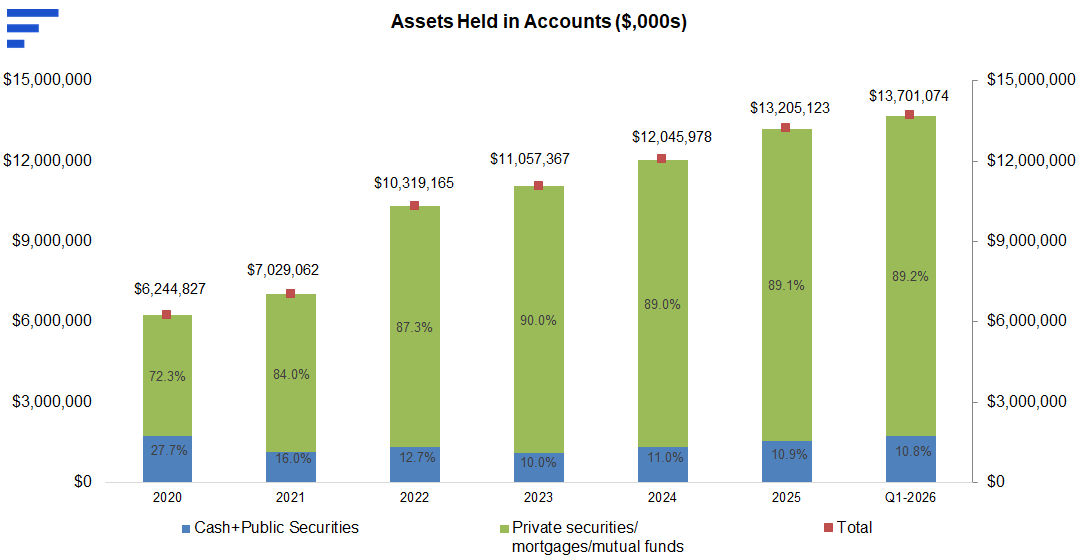
Client assets +4% QoQ to $13.7B, and +0.8% vs our forecast
Raising our 2026 year-end estimate, from $13.96B to $14.08B
In March 2026, OLY sold its currency division for $3.06M. The division provided FOREX and cross-border payment services for corporates and individuals, generating $5.18M in 2025 revenue, ~5% of group revenue. We view this as a pragmatic divestiture: (a) the division was unprofitable, with losses of $1M in 2025 , and $0.31M in Q1 - 2026; and (B) it was small, non-core, and outside OLY’s
Divests its currency division
main expertise. We believe the sale should allow OLY to focus on its higher-priority businesses.
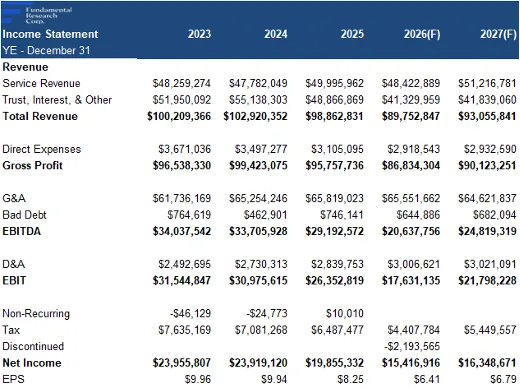
Financials (Year-End: Dec 31st)
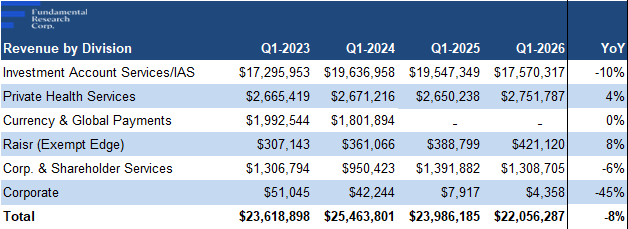
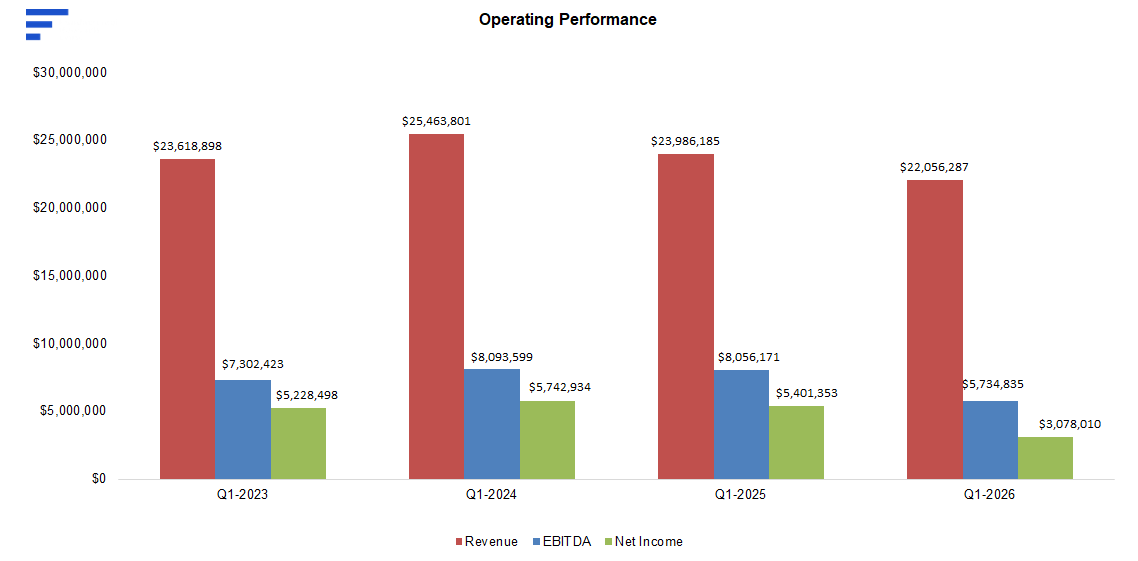
Q1 revenue -8% YoY, and -8% vs our estimate, driven by lower interest on unallocated client capital, with average rates 0.2 pp below our forecast
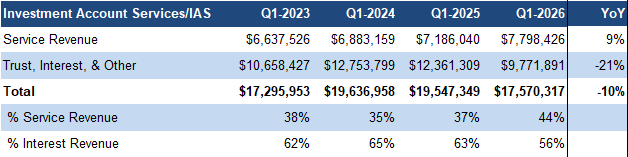
Notably, services revenue from core divisions (IAS and Private Health Services) was up 8% YoY, driven by higher transaction volumes
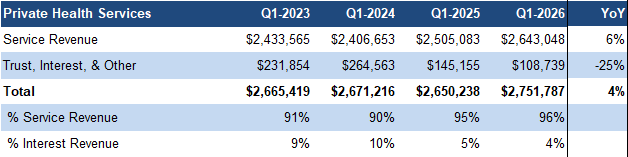
*The primary source of revenue in the “Trust, Interest, & Other” category is the interest earned on placing undeployed client capital in cash accounts at major Canadian banks.
*Service revenue includes annual and transaction fees
*‘Trust, interest, and other’ primarily includes interest revenue
Source: FRC / Company
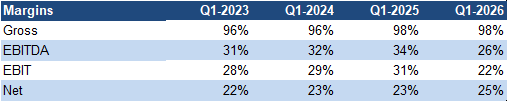
G&A expenses rose 5% YoY, in line with our estimate
EPS (excluding gain on sale of the currency division) was down 43% YoY, primarily due to weaker interest revenue, and higher G&A expenses, missing our estimate by 11%
Source: Company/FRC
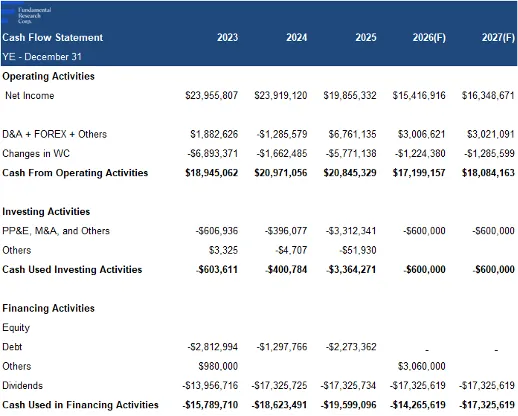
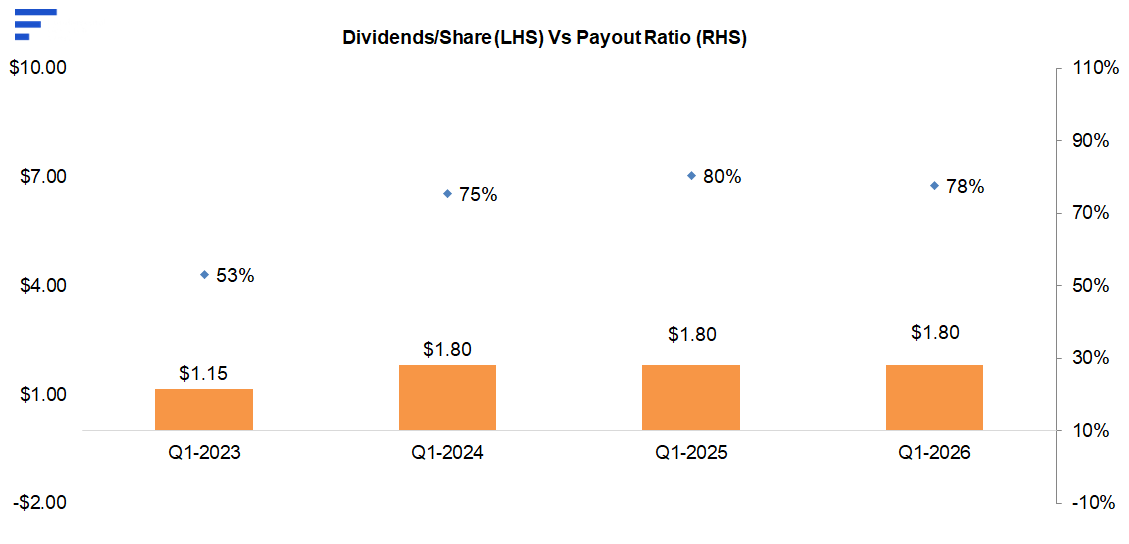
Annual dividends held steady at $7.20/year, aligning with our estimate
Source: Company/FRC
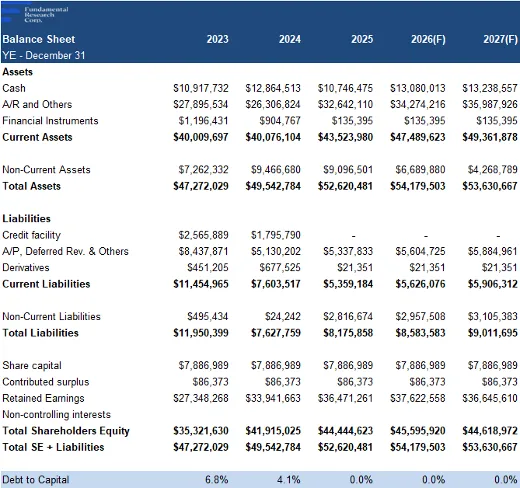
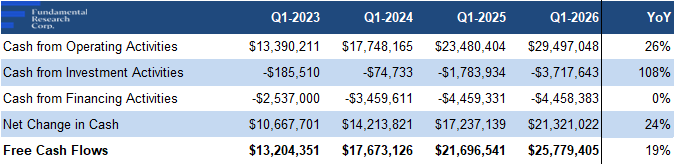
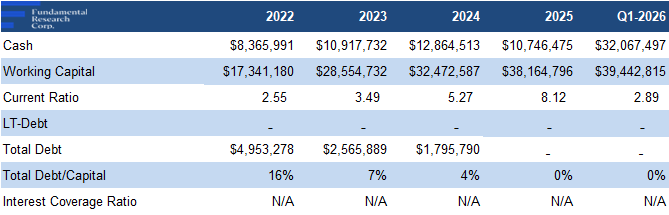
Strong, debt-free balance sheet, indicating very low risk of dividend cut or shortfall
FRC Projections and Valuation
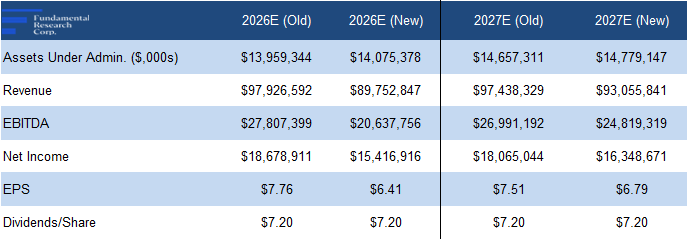
Given the lower-than-expected interest revenue, we are lowering our revenue and EPS forecasts
The divested division also weighed on revenue, but not EPS, as we had projected a minor loss from that division
Source: FRC
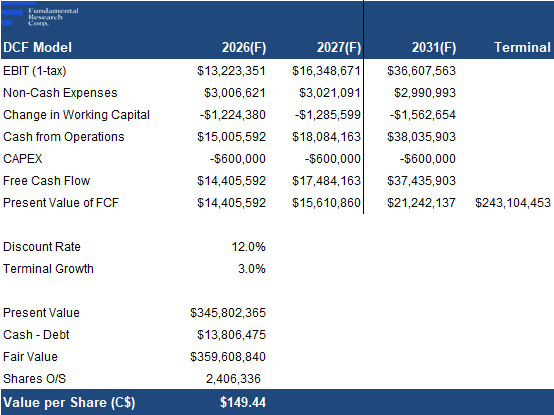
As a result of lower interest revenue, our DCF valuation declined from $154 to $149/share

Source: FRC/S&P Capital IQ
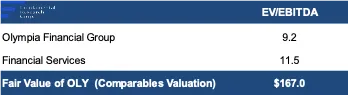
Our comparables valuation declined from $181/share to $167/share
We reiterate our BUY rating, and adjust our fair value estimate from $167.49 to $158.24/share (the average of our DCF and comparables valuations), implying a potential return of 41% (including dividends) in the next 12 months.
Q1 results were weaker than expected due to lower interest revenue, which is cyclical, and largely outside management’s control. However, underlying operations remain strong, with client assets up 4% QoQ , and core services revenue rising 8% YoY. Stable rates should support interest revenue going forward, while potential expansion into Ontario is a key growth catalyst. OLY appears relatively insulated from AI disruption due to its regulated custodial/admin services.
Risks
We believe the company is exposed to the following key risks (not exhaustive):
Maintaining our risk rating of 3 (Average)
APPENDIX