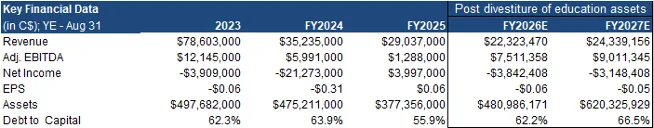
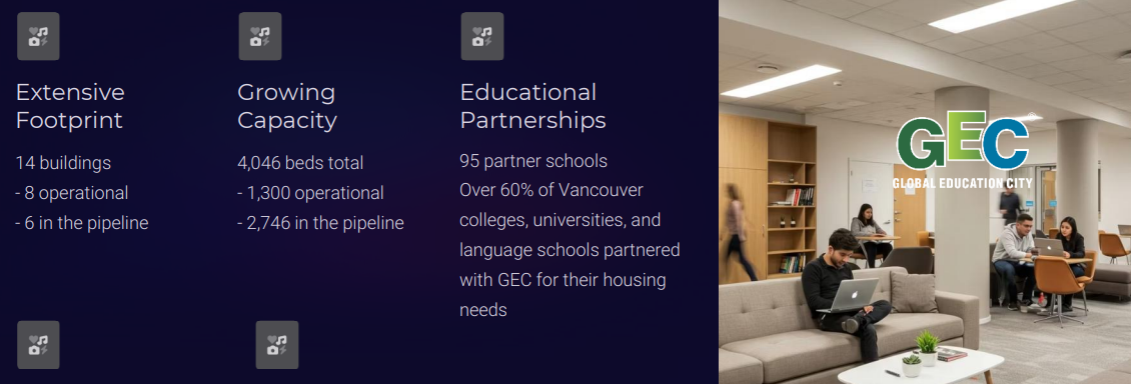
- Transition to Pure-Play Student Housing: During the quarter, GEC sold its remaining Canadian educational assets for $2M, completing its transition into a pure-play student housing operator. While this divestment aligns with the company’s strategy of focusing on developing student housing properties, we were slightly disappointed with the sale price, which was below our prior valuation of $8M. GEC operates B.C.’s largest off-campus student housing platform, comprising 14 buildings, with eight currently operating, and six under development.
- Enhanced Reporting Structure: Starting in Q3-FY2026, GEC will implement segment reporting to separate core rental operations from its development pipeline. We view this as a positive step, enhancing transparency between recurring income, and development projects, and improving segment-level valuation clarity.
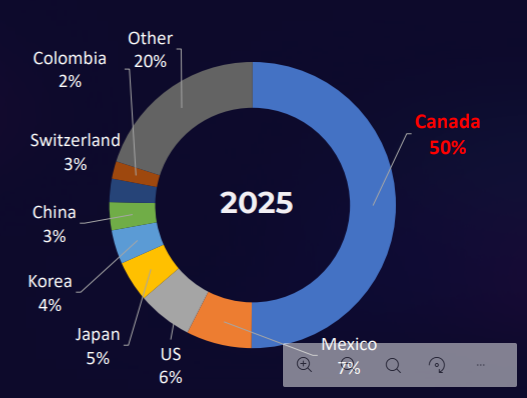
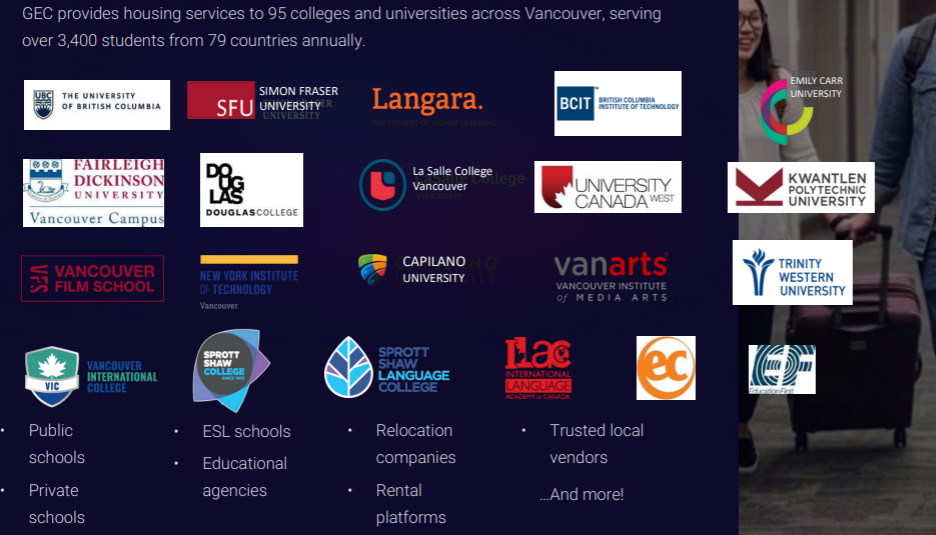
- Policy Headwinds, Structural Support in Vancouver Housing: Federal reductions in international student permits, tighter immigration caps, and stricter work permit rules are expected to moderate rental demand across Canada by limiting temporary resident inflows. However, Vancouver remains relatively insulated due to structural housing undersupply, and low vacancy in purpose-built rental, and student housing. GEC is further supported by its diversified tenant base, with roughly 40–50% domestic students, which reduces reliance on international students.
- Gradual Recovery Amid Tight Supply: After a soft 2025, we expect Vancouver rents to stabilize and gradually rise through 2026–2027, supported by low vacancy, constrained supply, and high replacement costs, partially offset by reduced international student inflows. We believe improving rental income, and lower interest rates, will support gradual upward pressure on GEC’s property values.
- Relative Valuation: GEC trades at 14x forward EBITDA vs 18x for the REIT sector, representing a 26% discount.
Price and Volume (1-year)
| |
YTD |
12M |
| GEC |
-12% |
82% |
| TSX |
8% |
42% |
| Index (REIT) |
9% |
17% |
* Global Education Communities has paid FRC a fee for research coverage and distribution of reports. See last page for other important disclosures, rating, and risk definitions. All figures in C$ unless otherwise specified.
GEC operates B.C.’s largest off campus student housing platform, comprising 14 buildings, eight currently operating and six under development
Student Housing Portfolio Overview
Student Housing Demographics
Rental assets offer inflation-protected income, with low volatility, making them attractive to pension funds and institutions
Source: Company
Per Q2 financial statements, GEC projects were appraised at $310M, up 1% QoQ
Several major Canadian REITs have recorded property write-downs over the past 12 months, largely due to softer market rents, and valuation pressures. With rents and property values expected to recover modestly in 2026, we believe GEC is well positioned to report valuation gains. These gains should be further supported, as ongoing development projects reach completion.
Operating Projects

Source: Company
Eight operating buildings across six projects (1,232 beds)
GEC holds minority interests, and acts as project operator across all properties

Potential to generate $14M in NOI, or $11k/bed in NOI per year
Source: Company/FRC
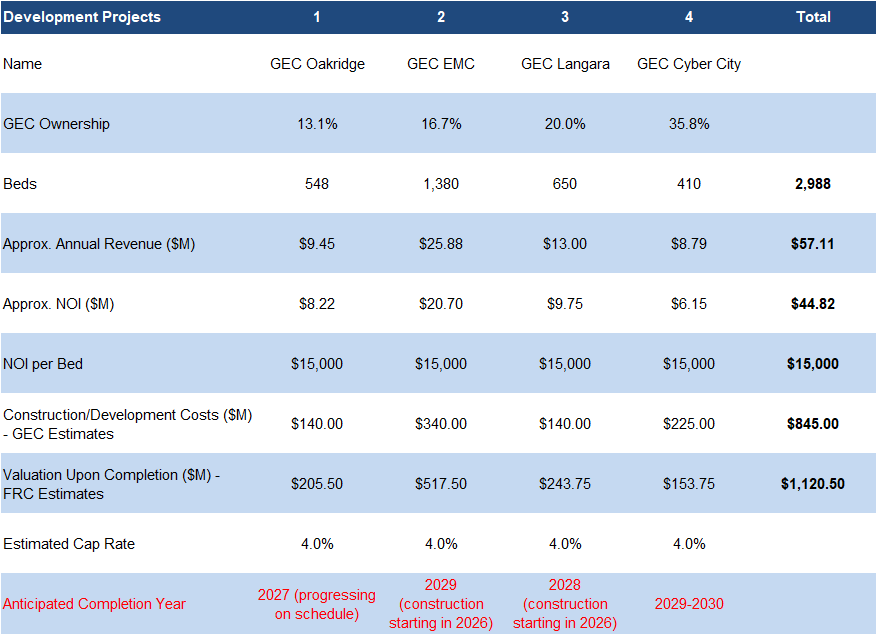
Developing six buildings across four projects (2,988 beds)
We are projecting $45M in NOI, or $15k/bed per year
At a 4% cap rate, we value these projects at $1.12B upon completion, unchanged from our report in January 2026
Target completion is 2027–2030; we note that real estate development projects are often subject to permitting/financing delays
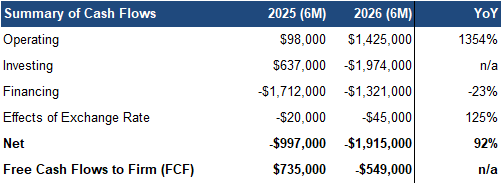
Financials
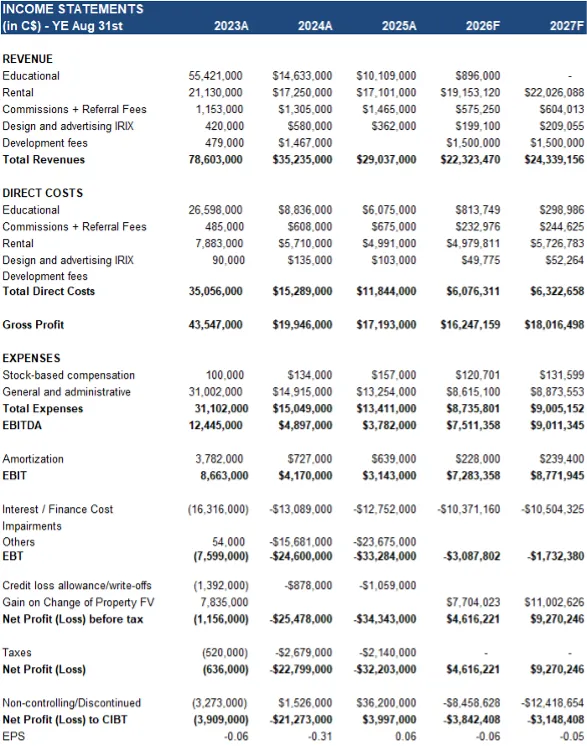
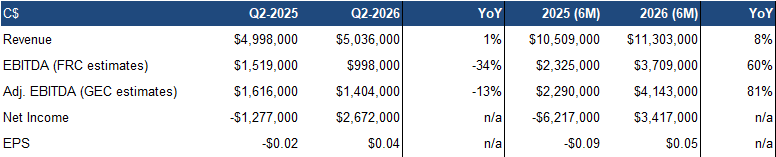
Q2 revenue rose 1% YoY, missing our estimate by 4%, driven by 10% growth in the flagship rental business, partially offset by weaker revenue from non-core divisions
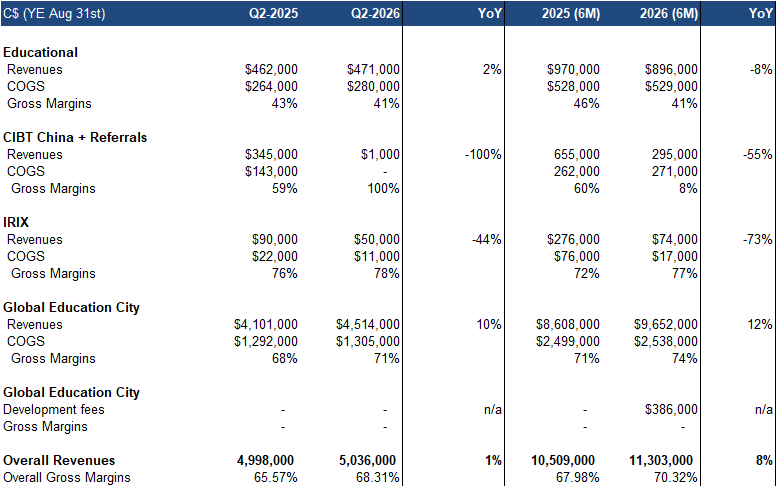
Rental revenue, which made up 90% of total revenue (Q2 2025: 82%), grew with contributions from recently completed projects
Gross margins rose 2.7 pp to 68.3%, beating our estimate by 2.1 pp, driven by higher rental business margins
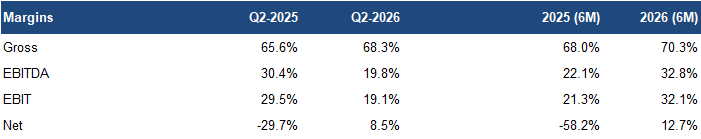
G&A expenses rose 39% YoY, primarily due to elevated one-time professional fees from recent divestments, driving a 13% YoY decline in adjusted EBITDA, missing our estimate by 2%
Source: FRC / Company
However, EPS improved YoY from ($0.02) to $0.04, beating our estimate by 15%, driven by lower interest rates on debt
Source: FRC / Company
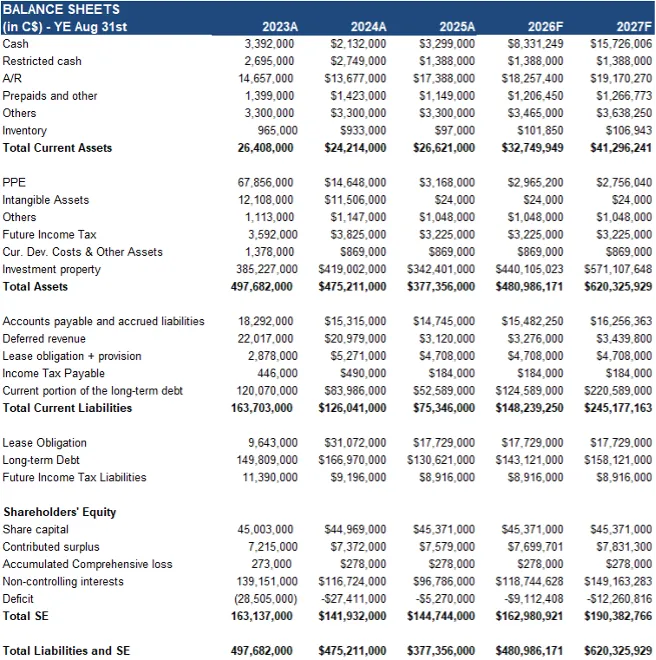
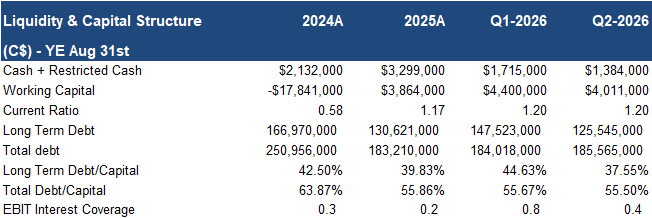
Debt-to-capital remained above the sector average (56% vs. 46%), but this is expected to improve once development projects are completed
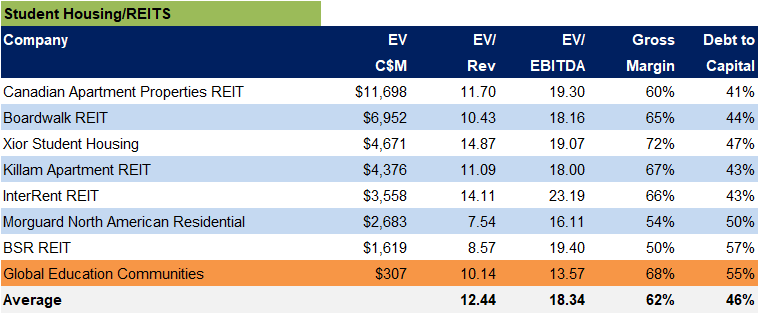
Sector Multiples and Ratios
Source: S&P Capital IQ, FRC
GEC is trading at 10x forward revenue vs 12x for the REIT sector, and 14x forward EBITDA (sector: 18x), a 22% discount on average
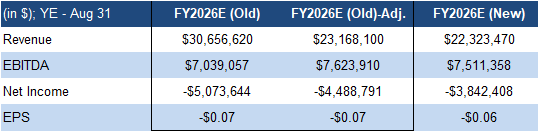
* Adjusted to reflect the recent divestiture of the remaining Canadian educational assets
Source: FRC
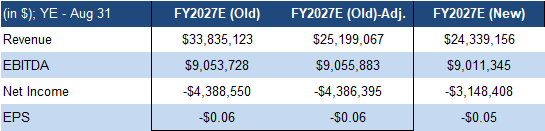
We are raising our EPS estimates, driven largely by lower than expected interest expense reported in Q2, partially offset by the removal of contributions from the recently divested assets
Source: FRC
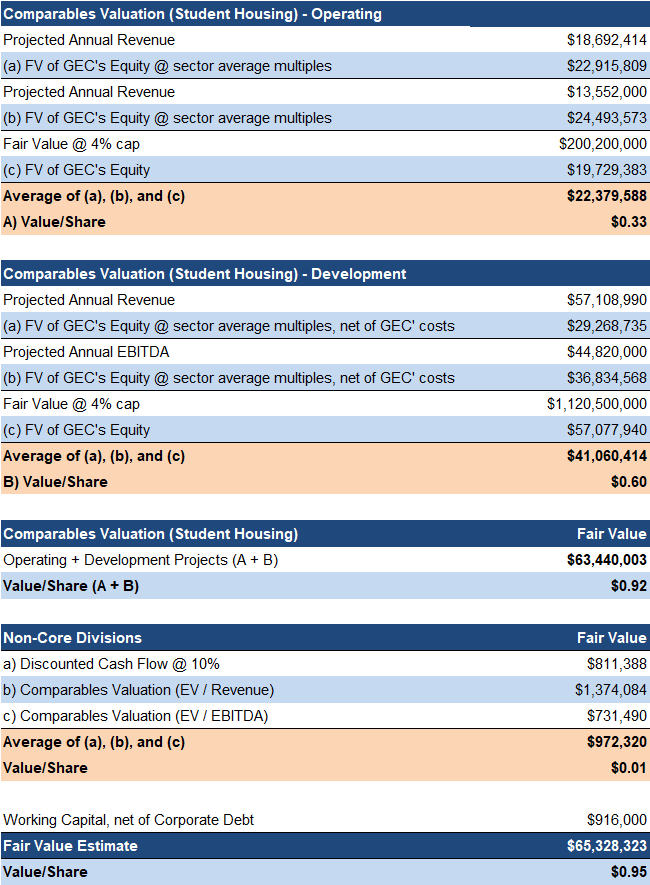
However, our fair value estimate declined from $1.11 to $0.95/share, reflecting the $2M sale of divested assets, below our
prior valuation of $8M
We are reiterating our BUY rating, and adjusting our fair value estimate from $1.11 to $0.95/share. GEC delivered mixed operating results, with an EPS beat, and margin expansion, offset by weaker non-core revenue, while strategically advancing its transition into a pure-play student housing platform. We remain constructive on the strong structural support from Vancouver housing fundamentals, with potential upside from tight supply conditions .
Risks
We believe the company is exposed to the following risks:
- Real estate development and financing
- Potential for delays in project development and construction
- Cost overruns
- Permitting
- Profitability is highly dependent on the health of the rental market in Vancouver
- Vacancy and rental rate fluctuations
- Leveraged balance sheet
Maintaining our risk rating of 3 (Average)
APPENDIX