US$ Outlook / A Limited-Time Opportunity in the Junior Gold Space
Published: 5/13/2024
Author: FRC Analysts

Key Highlights
- Last week, equities and metal prices strengthened
- Our outlook on the US$
- Shares of a copper junior under coverage are up 36% WoW
- A gold junior under coverage is trading below liquid assets
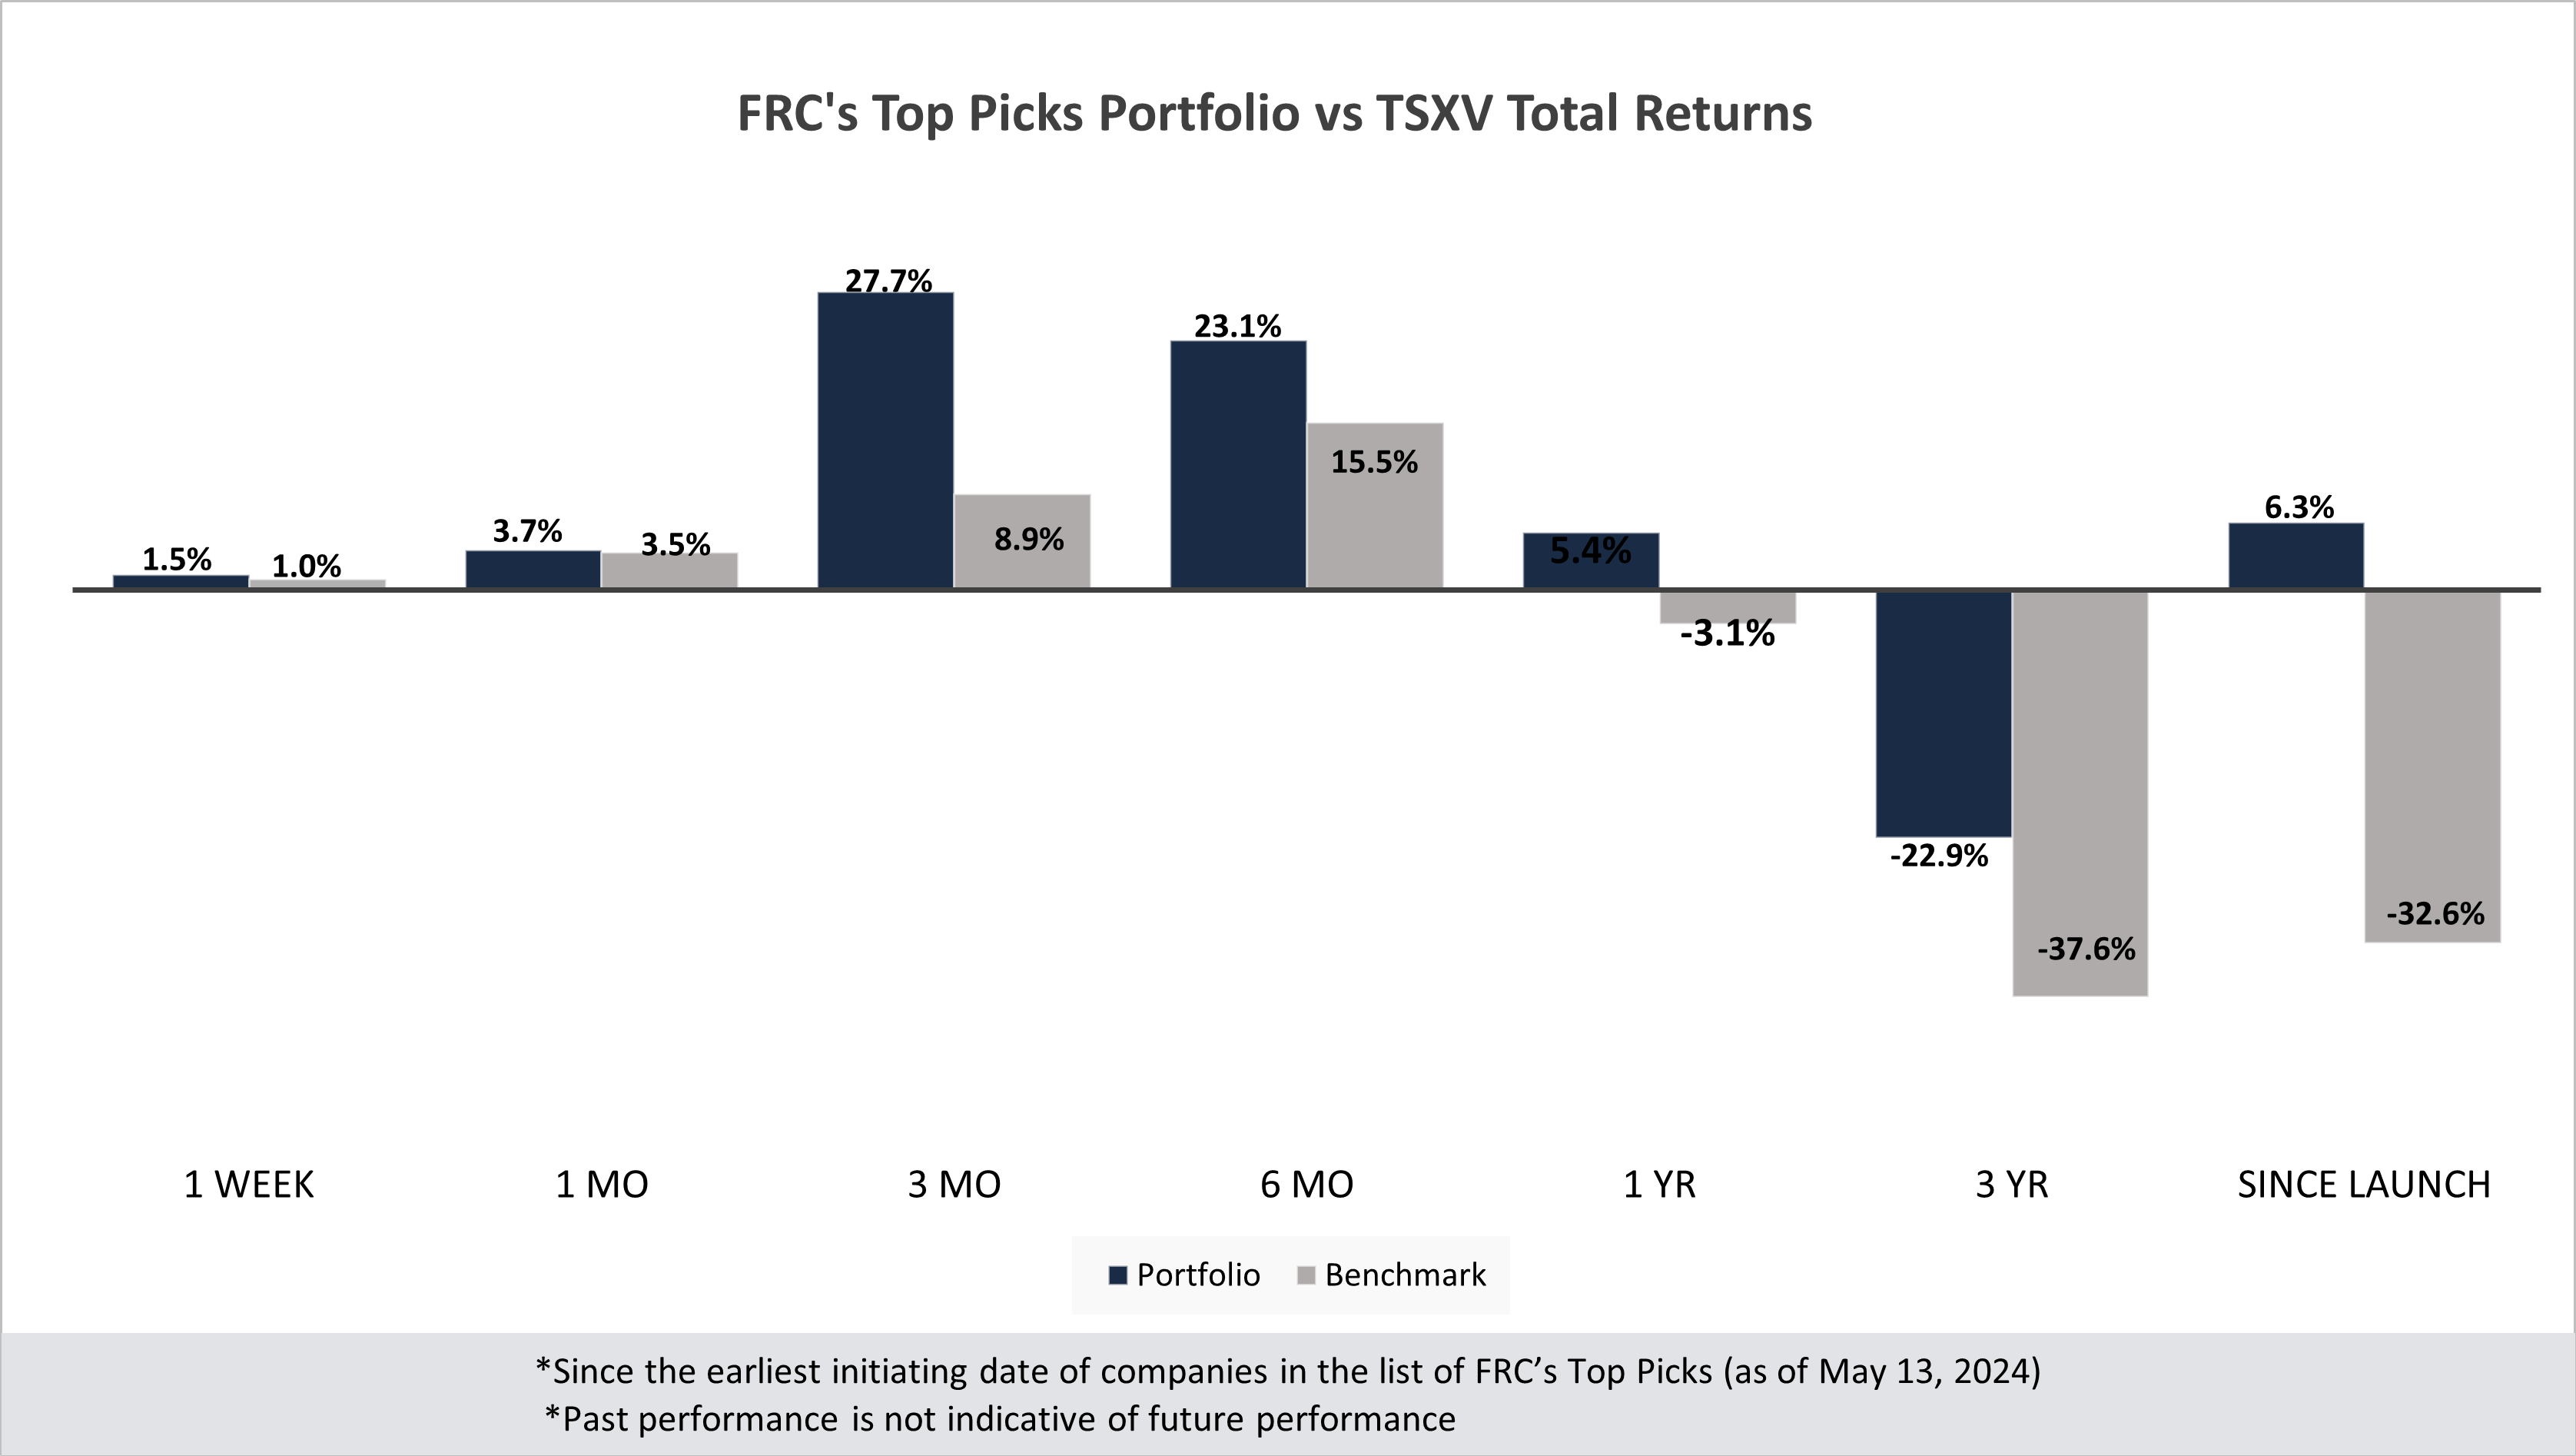
- Last month, companies on our Top Picks list were up 1.5% on average vs 1.0% for the benchmark (TSXV)
Lancaster Resources Inc. (LCR.CN)
PR Title: We have commenced due diligence on LCR, and will be initiating coverage in the coming weeks
Analyst Opinion: LCR is advancing a multi-commodity portfolio consisting of the following projects: a. The Alkali Flats lithium brine project in New Mexico (pre-resource) b. A hard rock (pegmatite) lithium project in Quebec (pre-resource); this project is located 120 km east of Patriot Battery’s (TSX: PMET/MCAP: $1.1B) Corvette project, renowned for hosting one of the world's largest lithium pegmatite resources c. One gold, one copper, and two uranium projects in Saskatchewan (pre-resource) LCR's flagship Alkali Flats lithium brine project is located in New Mexico, exhibiting mineralization similar to Nevada's Clayton Valley region, known for hosting several substantial advanced-stage lithium projects. Nevada is also home to Albemarle’s (NYSE: ALB) Silver Peak mine, the sole lithium-producing mine in North America. New Mexico remains significantly underexplored for lithium. Initial sampling at LCR’s property has yielded reasonably attractive lithium values of up to 150 ppm Li. Management intends to commence a maiden drill program shortly. We note that delineating a lithium resource is a faster and cheaper process vs mainstream metals such as gold and copper.
Golden Minerals Company (AUMN.TO, AUMN)
PR Title: Announces sale of Velardeña assets
Analyst Opinion: : Positive - AUMN has entered into an agreement with a privately held Mexican company to sell its Velardeña assets for US$5.5M. We were pleased with this development as our previous fair value estimate did not account for any value on these asses. Earlier this year, AUMN had ceased production at Velardeña due to initial production results not meeting management expectations. Factoring in this deal, AUMN has US$8M in working capital vs US$7.5M in MCAP, implying that shares are trading below liquid assets. Additionally, the market seems to assign zero value to any of its projects. AUMN is currently focused on its projects in Argentina (El Quevar and Sarita Este), and Mexico (Yoquivo). At El Quevar, the company has identified a high-grade silver resource (49 Moz AgEq) in one out of three known alteration zones. A PEA (completed in 2018) had returned an AT-NPV5% of $147M, and an AT-IRR of 40%, based on $23.32/oz silver.
East Africa Metals Inc. (EAM.V, EFRMF)
PR Title: Announces mine development programs at the Mato Bula and Da Tambuk mines (Ethiopia)
Analyst Opinion: : Positive - Partner Tibet Huayu Tibet Huayu Mining (SHSE: 601020) has initiated development work aimed at advancing the Mato Bula and Da Tambuk gold projects, located 4 km apart, toward production; construction activities will commence shortly. Tibet Huaya is funding the project to production. EAM owns a 30% carried interest. A 2018 PEA on the two projects had returned an AT-NPV8% of US$70M, using US$1,325/oz gold.
FRC Top Picks
The following table shows last week’s top five performers among our Top Picks, including five junior resource companies. The top performer, World Copper (TSXV: WCU), was up 36%. WCU is advancing multiple copper projects in the Americas.
| Top 5 Weekly Performers | WoW Returns |
| World Copper Ltd. (WCU.V) | 36.4% |
| Starcore International Mines Ltd. (SAM.TO) | 23.1% |
| Kidoz Inc. (KIDZ.V) | 16.0% |
| New Age Metals Inc. (NAM.V) | 12.5% |
| Sirios Resources Inc. (SOI.V) | 7.1% |
| * Past performance is not indicative of future performance (as of May 13, 2024) |
Source: FRC
Last week, companies on our Top Picks list were up 1.5% on average vs 1.0% for the benchmark (TSXV). Our top picks have outperformed the benchmark in all of the seven time periods listed below.
Performance by Sector
| Total Return | 1 Week | 1 mo | 3 mo | 6 mo | 1 yr | 3 yr | Since launch |
| Mining | 1.6% | 4.0% | 33.5% | 26.7% | 2.4% | -45.4% | 9.8% |
| Cannabis | N/A | N/A | N/A | N/A | N/A | -42.1% | -23.6% |
| Tech | 16.0% | 53.0% | 136.0% | 24.0% | -7.0% | -32.2% | -3.8% |
| Special Situations (MIC) | -0.8% | -5.5% | -2.7% | 12.9% | 20.6% | -16.7% | -11.1% |
| Private Companies | N/A | N/A | N/A | N/A | 6.7% | 20.5% | 30.5% |
| Portfolio (Total) | 1.5% | 3.7% | 27.7% | 23.1% | 5.4% | -22.9% | 6.3% |
| Benchmark (Total) | 1.0% | 3.5% | 8.9% | 15.5% | -3.1% | -37.6% | -32.6% |
| Portfolio (Annualized) | - | - | - | - | 5.4% | -8.3% | 0.6% |
| Benchmark (Annualized) | - | - | - | - | -3.1% | -14.5% | -3.7% |
1. Since the earliest initiating date of companies in the list of Top Picks (as of May 13, 2024) 2. Green (blue) indicates FRC's picks outperformed (underperformed) the benchmark. 3. Past performance is not indicative of future performance. 4. Our complete list of top picks (updated weekly) can be viewed here: Top Picks List
Weekly Mining Commentary
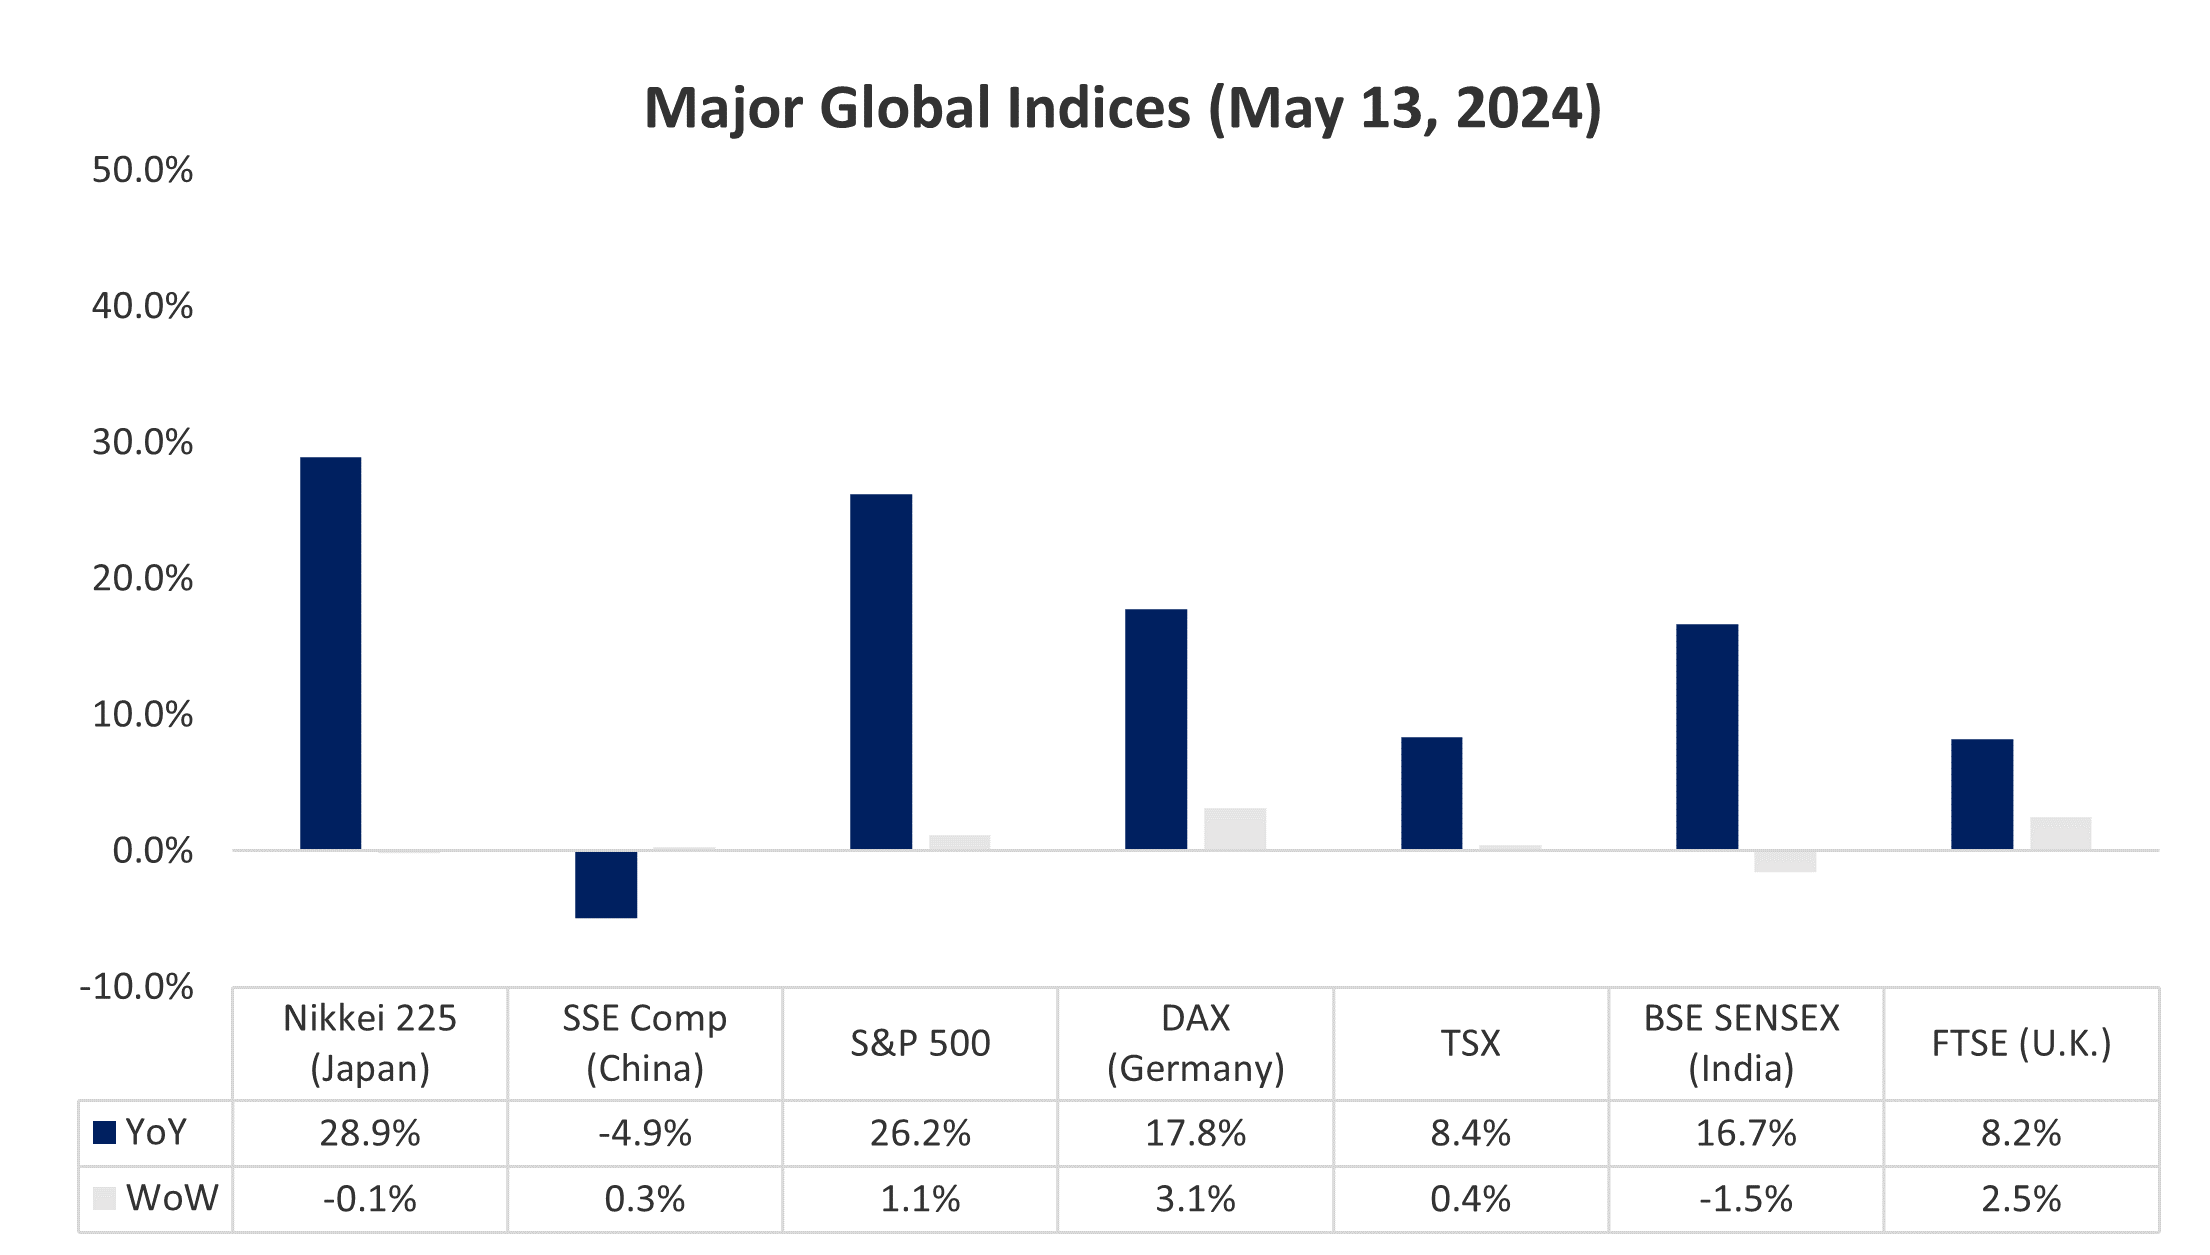
Last week, global equity markets were up 0.8% on average (up 0.5% in the previous week). This week, all eyes are focused on U.S. inflation data. We anticipate the US$ will remain strong, given indications that global central banks, particularly the Bank of Canada, the European Central Bank, and the Bank of England, will likely cut rates sooner than the Fed. A robust US$ could exert downward pressure on both equity and metal prices.
Source: FRC / Various
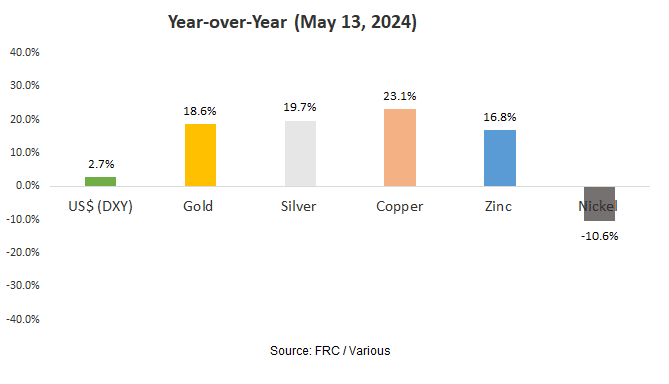
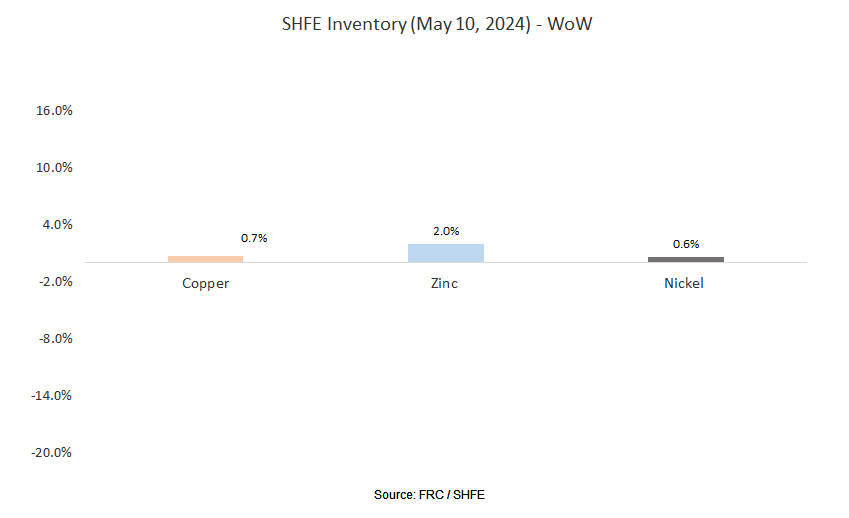
Last week, metal prices were up 2.1% on average (down 1.1% in the previous week).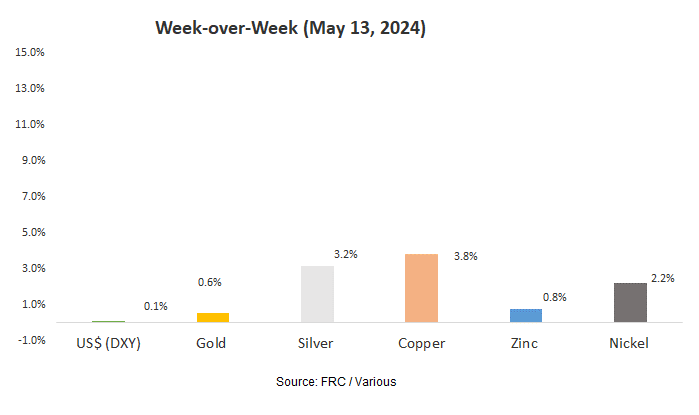

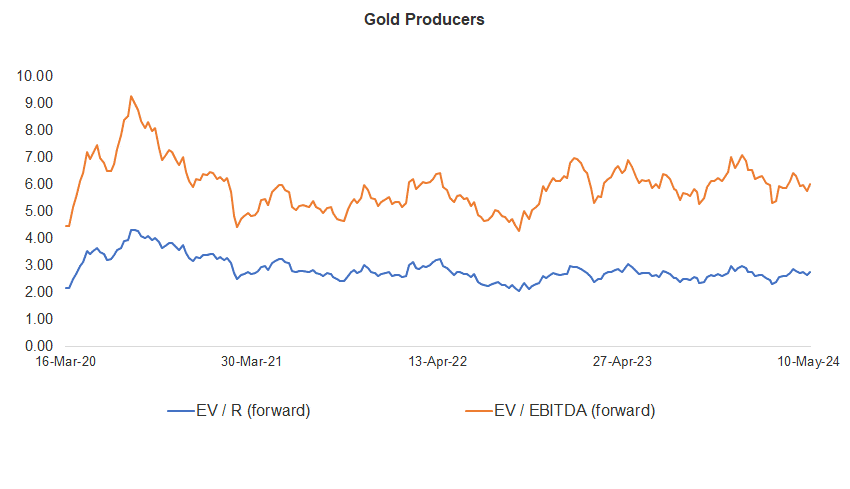
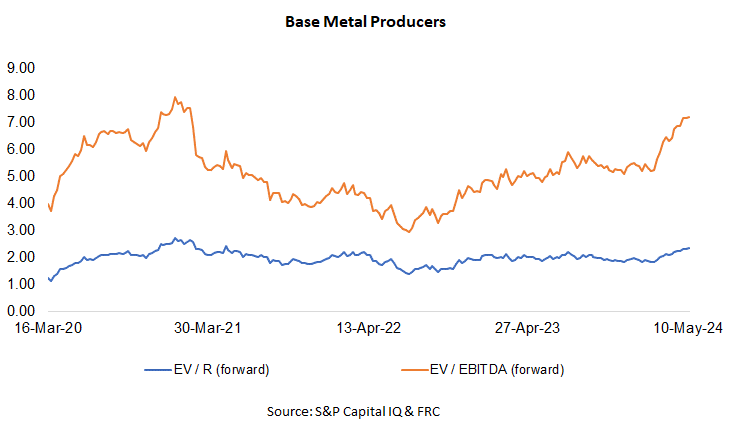
Gold producer valuations were up 3.8% last week (down 3.4% in the prior week); base metal producers were up 0.8% last week (up 0.1% in the prior week). On average, gold producer valuations are 17% lower compared to the past three instances when gold surpassed US$2k/oz.
| 06-May-24 | 13-May-24 | ||||
| Gold Producers | EV / R (forward) | EV / EBITDA (forward) | EV / R (forward) | EV / EBITDA (forward) | |
| 1 | Barrick | 3.09 | 6.63 | 3.10 | 6.59 |
| 2 | Newmont | 3.17 | 7.37 | 3.29 | 7.61 |
| 3 | Agnico Eagle | 4.44 | 8.49 | 4.67 | 8.89 |
| 4 | AngloGold | 2.09 | 4.74 | 2.18 | 4.96 |
| 5 | Kinross Gold | 2.29 | 5.16 | 2.43 | 5.50 |
| 6 | Gold Fields | 2.84 | 5.19 | 2.93 | 5.45 |
| 7 | Sibanye | 0.71 | 3.53 | 0.75 | 3.96 |
| 8 | Hecla Mining | 4.16 | 15.53 | 4.64 | 14.85 |
| 9 | B2Gold | 1.75 | 3.50 | 1.71 | 3.52 |
| 10 | Alamos | 4.85 | 9.14 | 5.02 | 9.46 |
| 11 | Harmony | 1.67 | 4.88 | 1.70 | 4.95 |
| 12 | Eldorado Gold | 2.32 | 4.75 | 2.47 | 5.07 |
| Average (excl outliers) | 2.66 | 5.76 | 2.75 | 6.00 | |
| Min | 0.71 | 3.50 | 0.75 | 3.52 | |
| Max | 4.85 | 15.53 | 5.02 | 14.85 | |
| Industry (three year average) | 110.70 | 116.70 | 110.70 | 116.70 | |
| Base Metal Producers | EV / R (forward) | EV / EBITDA (forward) | EV / R (forward) | EV / EBITDA (forward) | |
| 1 | BHP Group | 2.91 | 5.60 | 2.93 | 5.65 |
| 2 | Rio Tinto | 2.32 | 4.93 | 2.34 | 4.98 |
| 3 | South32 | 1.57 | 7.40 | 1.58 | 7.36 |
| 4 | Glencore | 0.44 | 5.87 | 0.45 | 6.04 |
| 5 | Anglo American | 2.00 | 5.95 | 2.01 | 5.96 |
| 6 | Teck Resources | 3.00 | 6.93 | 3.12 | 7.21 |
| 7 | First Quantum | 3.97 | 13.44 | 3.92 | 13.30 |
| Average (excl outliers) | 2.32 | 7.16 | 2.34 | 7.21 | |
| Min | 0.44 | 4.93 | 0.45 | 4.98 | |
| Max | 3.97 | 13.44 | 3.92 | 13.30 | |
Source: S&P Capital IQ & FRC
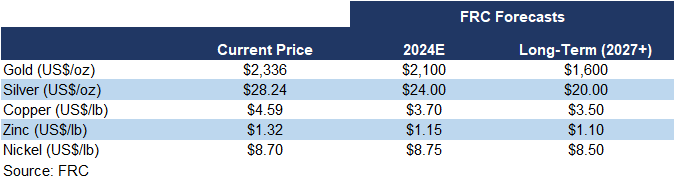
We are maintaining our metal price forecasts.
Weekly Crypto Commentary
Prices of mainstream/popular cryptos were down 5% on average last week (up 7% in the previous week).
| May 13, 2024 | ||
| Cryptocurrencies | 1-Week | 1-Year |
| Bitcoin | 3% | 136% |
| Binance Coin | 1% | 91% |
| Cardano | -2% | 21% |
| Ethereum | -24% | 64% |
| Polkadot | -7% | 25% |
| XRP | -2% | 20% |
| Polygon | -7% | -22% |
| Solana | -2% | 607% |
| AVERAGE | -5% | 118% |
| MIN | -24% | -22% |
| MAX | 3% | 607% |
| Indices | ||
| Canadian | 1-Week | 1-Year |
| BTCC | -1% | 123% |
| BTCX | -1% | 132% |
| EBIT | -1% | 129% |
| FBTC | -1% | 35% |
| U.S. | 1-Week | 1-Year |
| BITO | -1% | 61% |
| BTF | -3% | 68% |
| IBLC | -8% | 50% |
Source: FRC/Yahoo Finance
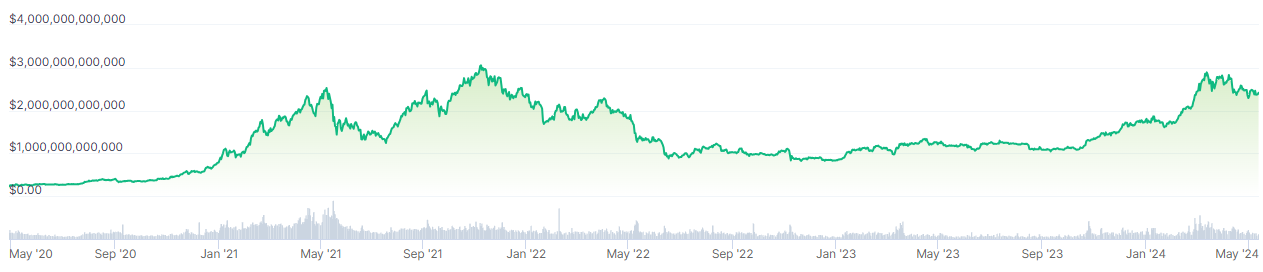
The global MCAP of cryptos is US$2.38T, down 2% MoM, but up 100%YoY.
Total Crypto Market Cap Chart
Source: CoinGecko
Last week, BTC was up 3%, while the S&P 500 was up 1%.
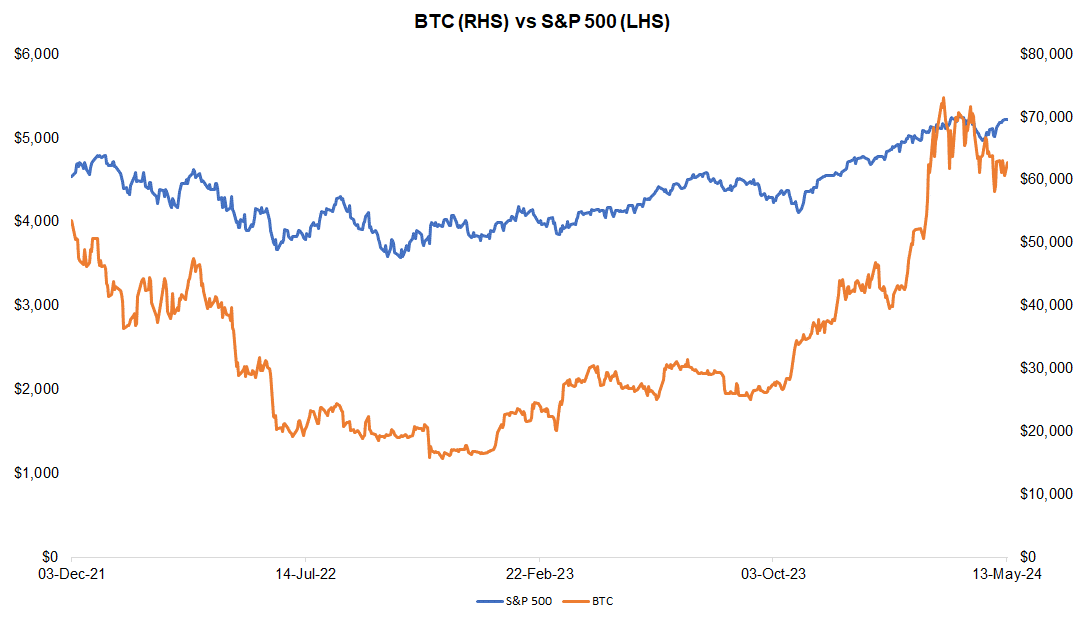
Source: FRC/ Yahoo Finance
The global hash rate of BTC (defined as calculations performed per second/an indicator of network difficulty) is 586 exahashes per second (EH/s), down 2% WoW, and 8% MoM. The decrease in hash rates is positive for miners as their efficiency rates (BTC production per EH/s) are inversely linked to global hash rates.
Total Hash Rate (BTC) 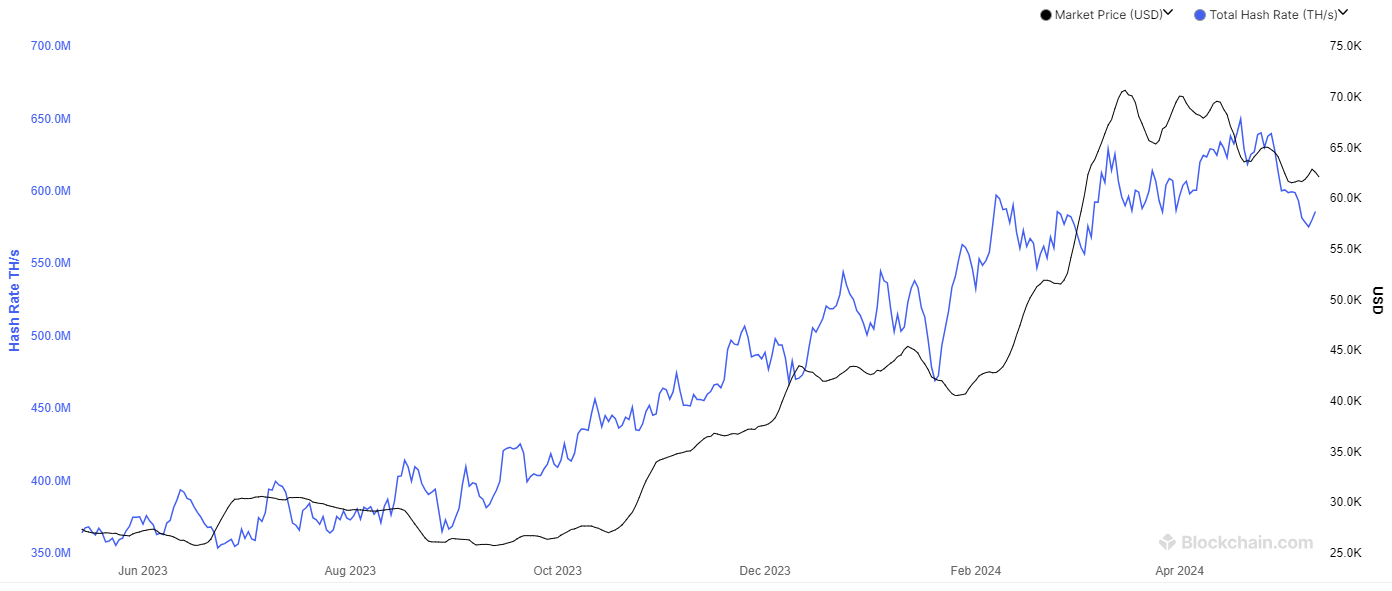
The Realized HODL ratio (RHODL), which gauges the activity of short-term holders relative to long-term holders, is down 23% WoW, but up 414% YoY. We interpret the declining RHODL ratio as a signal of weakening demand, with fewer new buyers entering the market, suggesting potential for a near-term price decline. Historically, BTC prices have moved in tandem with this ratio. By tracking the RHODL, we believe we can identify potential turning points in BTC prices.
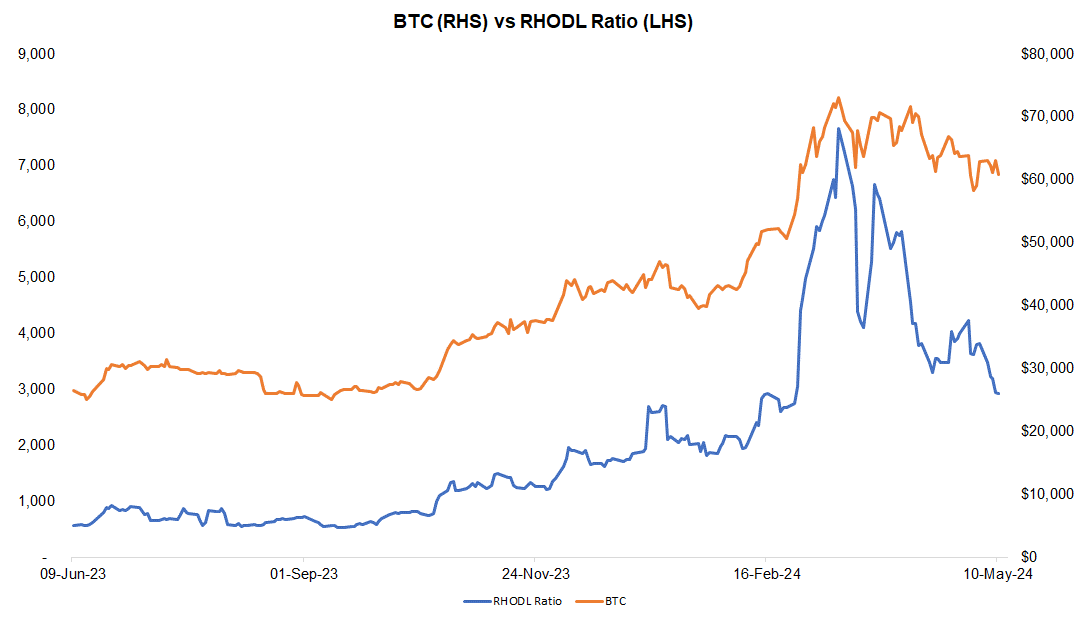
Source: FRC/ Various
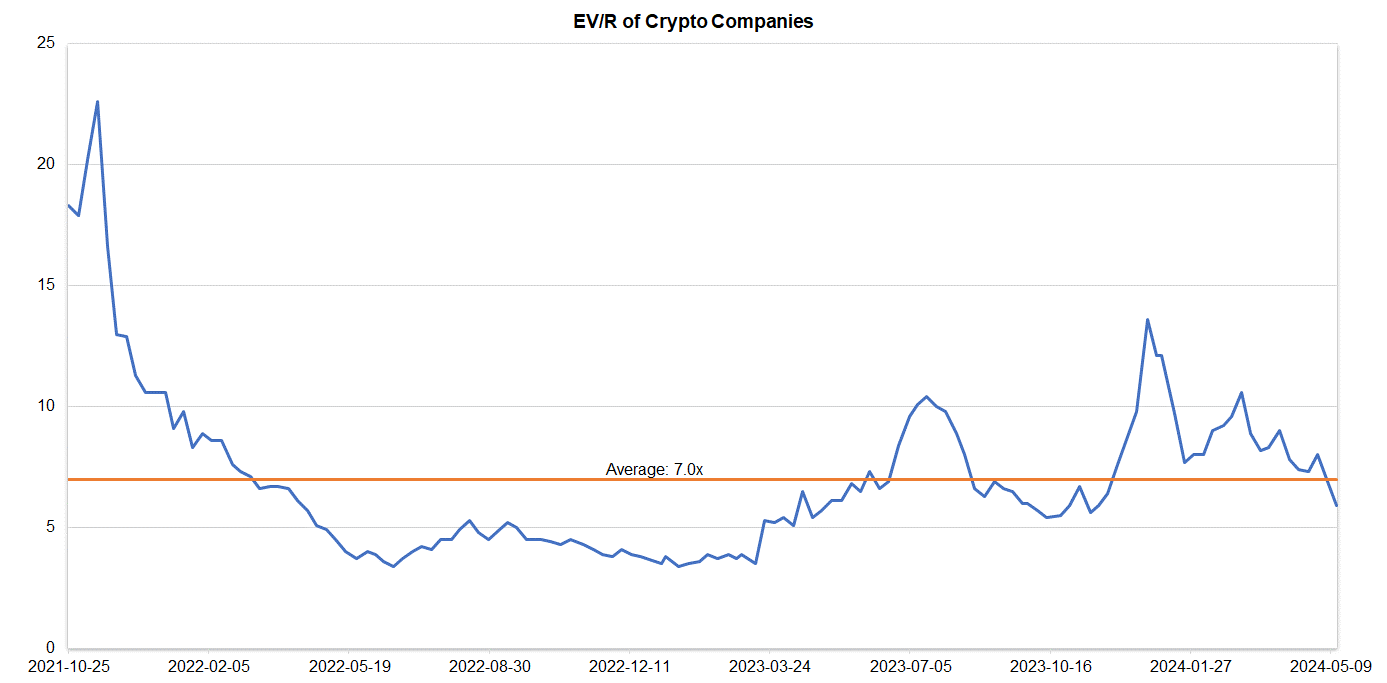
Companies operating in the crypto space are trading at an average EV/R of 5.9x (previously 6.9x).
Source: S&P Capital IQ/FRC
| May 13, 2024 | ||
| Crypto Companies | Ticker | TEV/Revenue |
| Argo Blockchain | LSE: ARB | 2.7 |
| BIGG Digital | CSE: BIGG | 7.8 |
| Bitcoin Well | TSXV: BTCW | 0.7 |
| Canaan Inc. | NASDAQ: CAN | 0.6 |
| CleanSpark Inc. | NasdaqCM:CLSK | 11.4 |
| Coinbase Global | NASDAQ: COIN | 12.5 |
| Galaxy Digital Holdings | TSX: GLXY | N/A |
| HIVE Digital | TSXV:HIVE | 2.7 |
| Hut 8 Mining Corp. | TSX: HUT | 8.2 |
| Marathon Digital Holdings | NASDAQ: MARA | 9.4 |
| Riot Platforms | NASDAQ: RIOT | 6.9 |
| SATO Technologies | TSXV: SATO | 2.0 |
| AVERAGE | 5.9 | |
| MEDIAN | 6.9 | |
| MINIMUM | 0.6 | |
| MAXIMUM | 12.5 |
Source: S&P Capital IQ/FRC


