- We maintain a positive outlook on the Canadian multi-family residential market, buoyed by strong rental demand, elevated property prices, and challenges in affordability due to high mortgage rates for new homebuyers.
- Since the end of 2024, the BoC has cut rates twice, totaling 50 bp. Although the BoC held its benchmark rate in its most recent meeting, we see room for one or two more cuts this year, driven by rising unemployment, geopolitical/trade risks, and concerns over potential weakness in GDP growth. Lower rates and higher rents should compress cap rates, and boost property valuations
- YEG’s forward EV/revenue is 9x vs the sector average of 12x, a 25% discount.
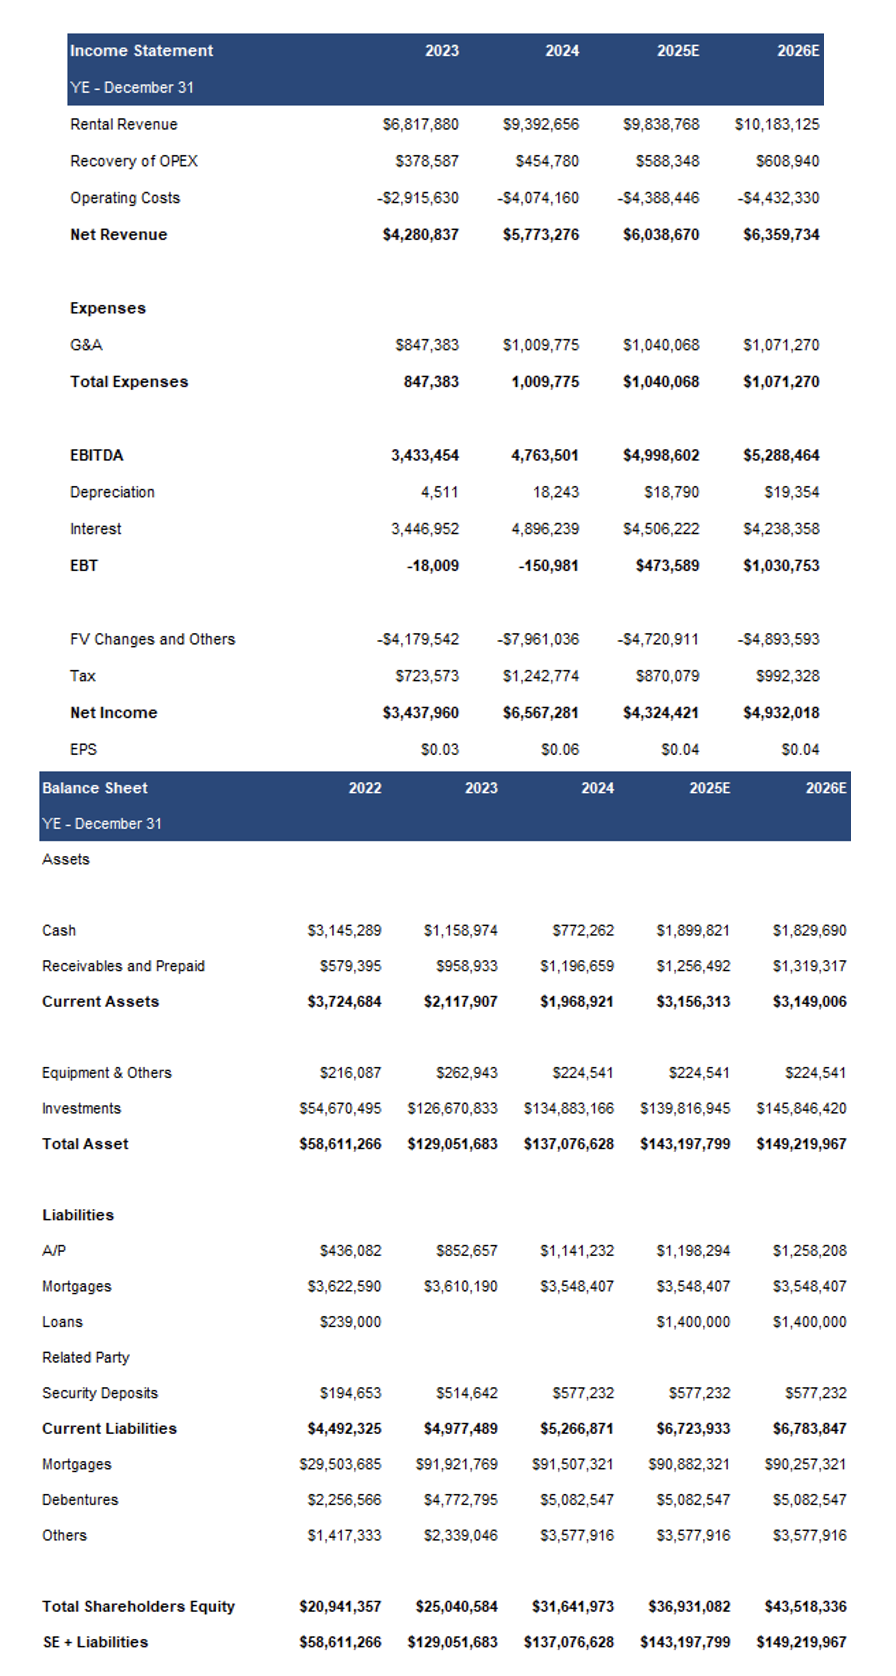
| Key Financials (FYE: Dec 31) - C$ |
2024 |
2025E |
2026E |
| Cash |
$772,262 |
$1,899,821 |
$1,829,690 |
| Working Capital |
-3,297,950 |
-3,567,620 |
-3,634,841 |
| Debt to Capital |
76% |
73% |
70% |
| NAV/share |
$0.28 |
$0.33 |
$0.39 |
| Net Revenue |
$5,773,276.00 |
$6,038,670.00 |
$6,359,734.00 |
| Net Income Before Tax |
$7,810,055.00 |
$5,194,500.00 |
$5,924,346.00 |
| Tax |
$1,242,774 |
$870,079 |
$992,328 |
| Net Income after Tax |
$6,567,281 |
$4,324,421 |
$4,932,018 |
| EPS |
$0.06 |
$0.04 |
$0.04 |
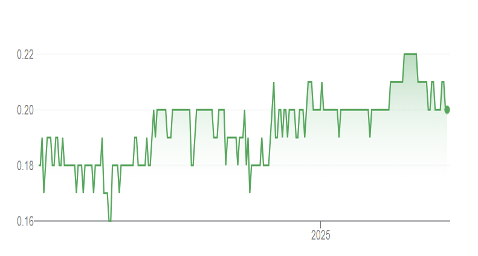
Price and Volume (1-year)
| |
YTD |
12M |
| YEG |
-7% |
8% |
| TSXV |
6% |
13% |
Investment Strategy
30+ year track record in real estate. The CEO owns 73% of YEG’s equity. Building a portfolio capable of potentially generating steady cash flows, and capital gains
YEG focuses on multi-family rental properties capable of potentially generating steady cash flows, and capital gains. Management’s key objectives include:
- Expanding through strategic acquisitions of multi-family residential properties in cities experiencing robust population growth, with an initial emphasis on B.C. and Alberta
- Increasing rental revenue through organic growth, development, repositioning, renovations, and optimization strategies
- Over the next three to five years, management is focused on growing the portfolio to over $500M.
YEG’s portfolio includes 11 projects (unchanged QoQ), including 10 residential projects totaling 518 units, and one commercial spanning 28,036 sq. ft
Portfolio Summary
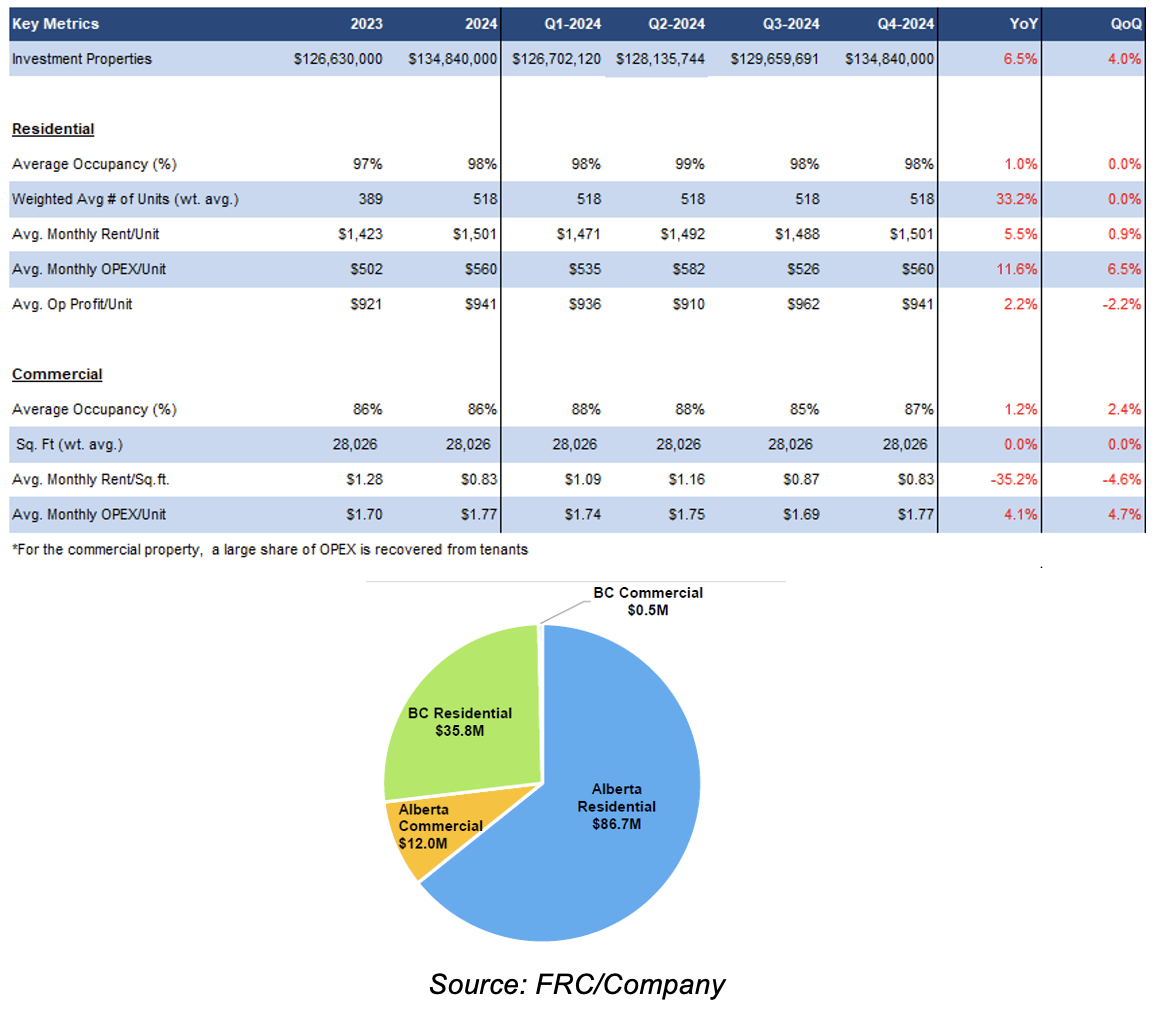
YEG owns 100% equity in its projects. At the end of 2024, YEG owned $134.8M in real estate investments, up 6% YoY, driven by an $8.0M gain in property valuations vs our forecast of $3.8M, fueled by higher rent
According to management, commercial occupancy climbed from 87% in Q4-2024, to 92% in Q1-2025. We anticipate property valuations increasing by 3.5% in 2025, driven by organic rent growth
Three residential properties in Edmonton accounted for 64% of YEG’s portfolio
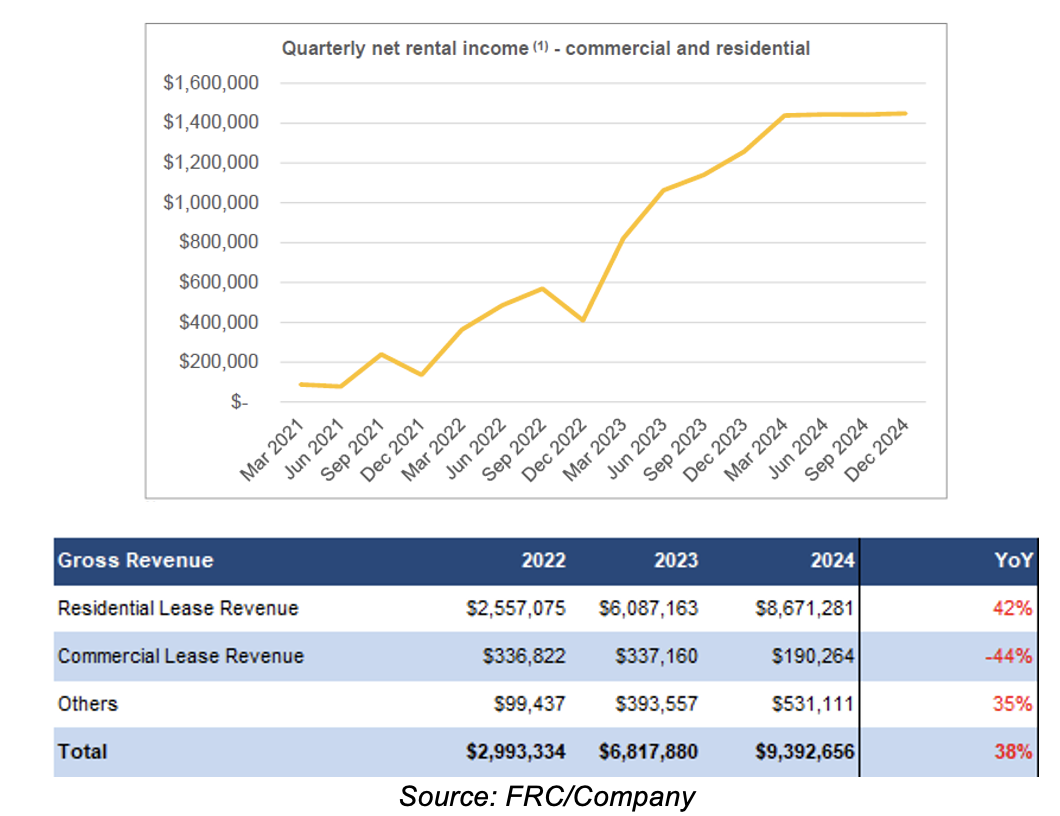
2024 revenue was up 38% YoY, beating our estimate by 0.4%, driven by higher rents, and two property acquisitions in 2023. In 2024, residential rental revenue accounted for 92% of revenue (89% in 2023)
The following sections summarize YEG’s projects.
10 residential projects totaling $5.9M in NOI, valued at $123M, or $237k/unit

The tables below present key highlights of YEG’s residential projects.
Key Highlights
Three residential projects in Edmonton, totaling 375 units valued at $87M, or $231k/unit. The average cap rate is 4.8%
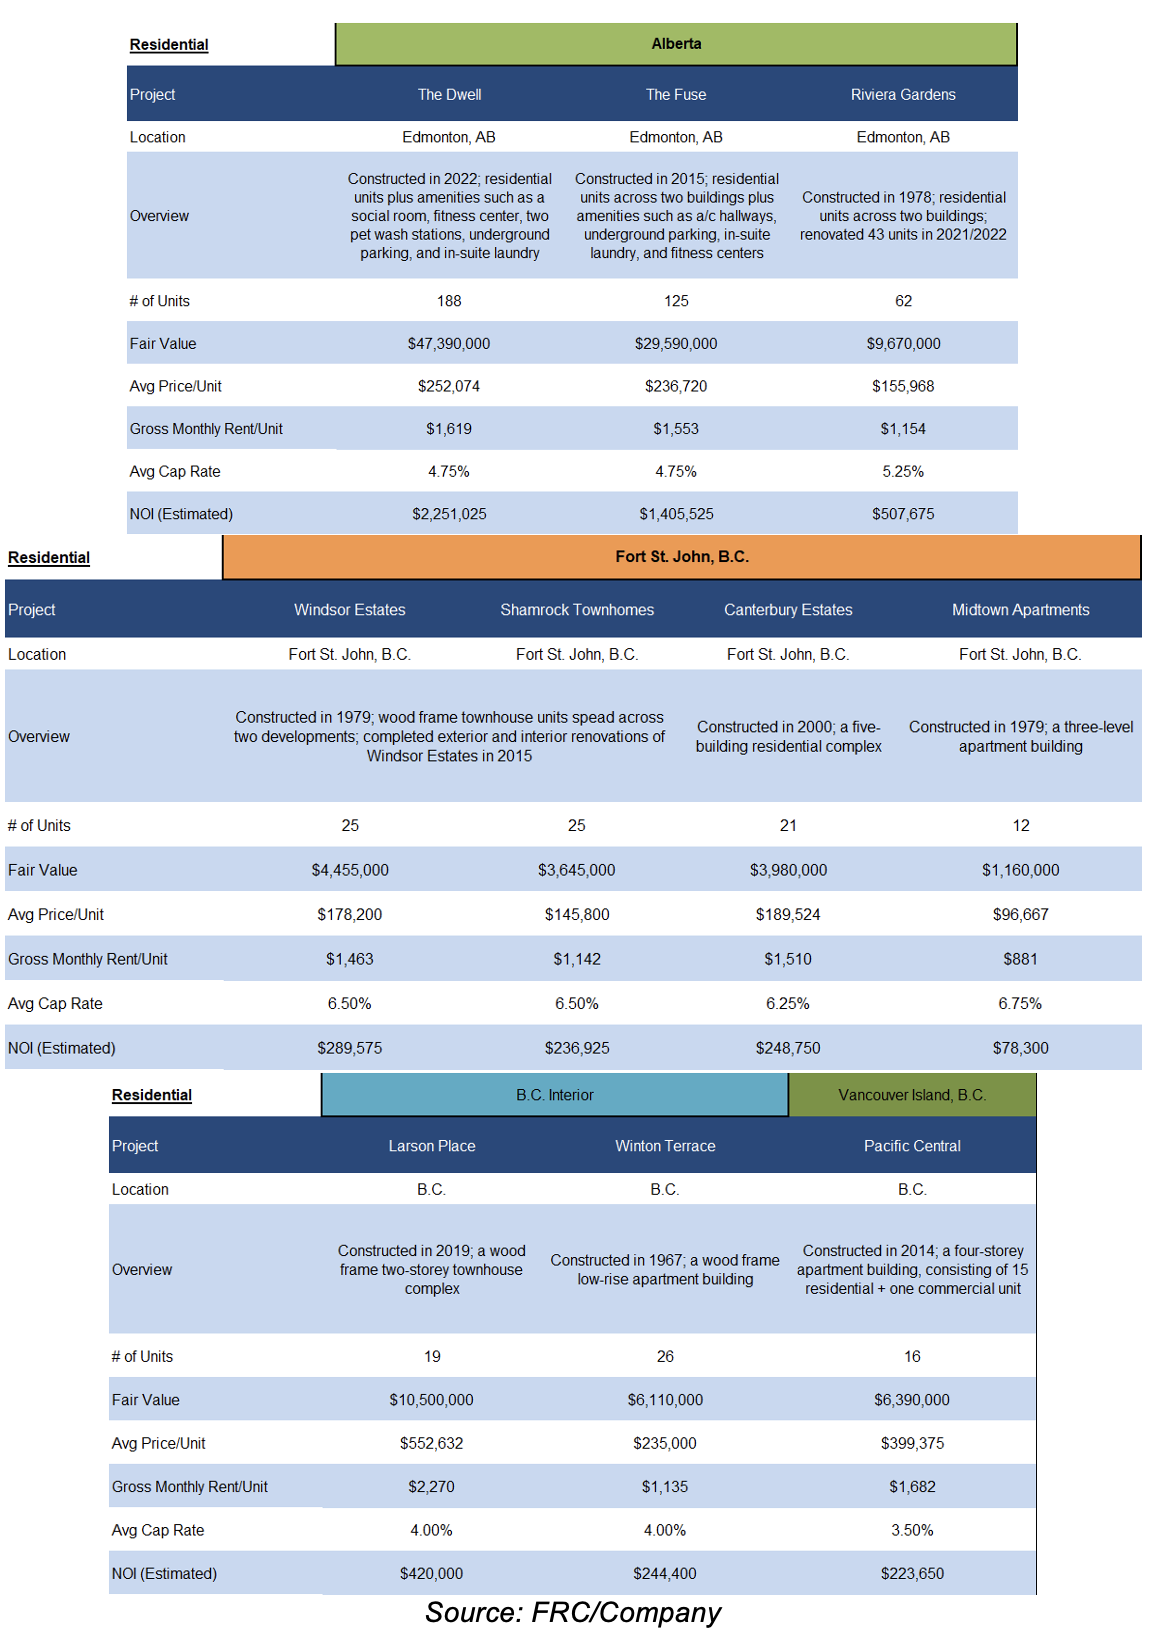
Four residential projects in Fort St. John, B.C., totaling 83 units valued at $13M, or $160k/unit. The average cap rate is 6.5%
Three residential projects in the rest of B.C., totaling 61 units valued at $23M, or $377k/unit. The average cap rate is 3.9%
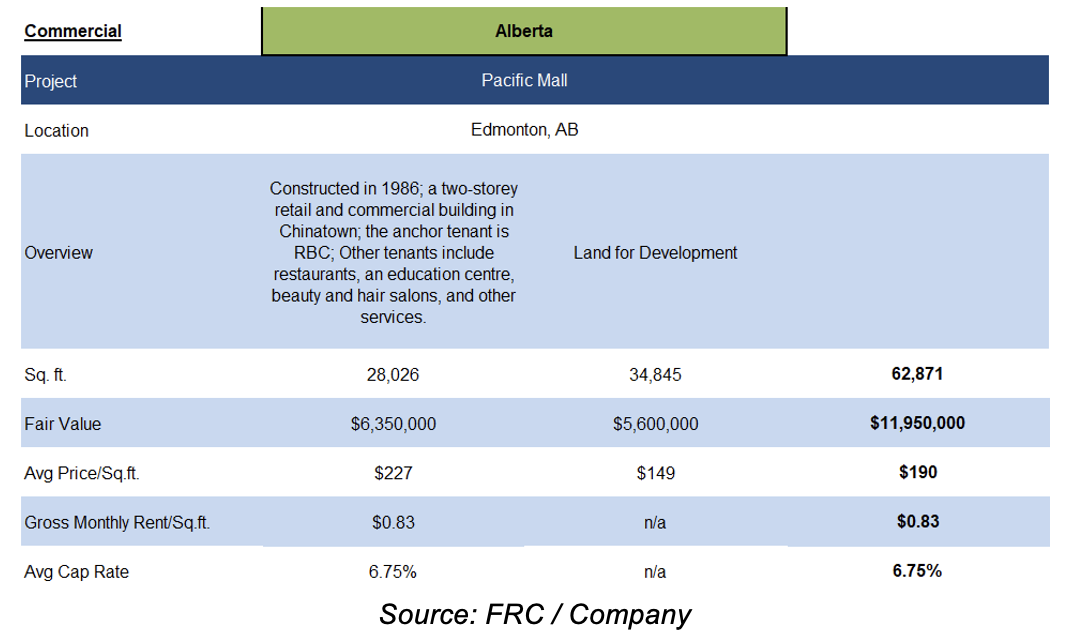
One commercial/retail project in Edmonton, with RBC (TSX: RY) as the anchor tenant
Financials
2024 revenue was up 38% YoY, beating our estimate by 0.4%. EBITDA was up 39%, missing our estimate by 2.4%, as G&A expenses were 11.4% higher than expected
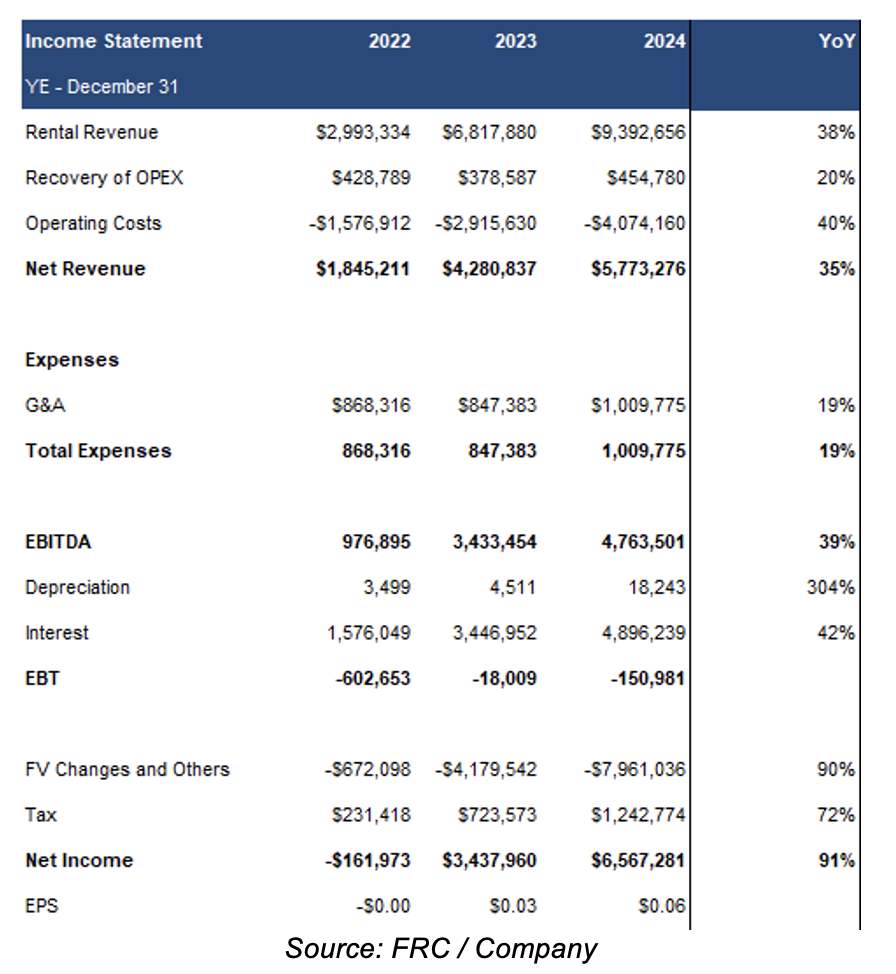
EPS was up 91% to $0.06 vs our forecast of $0.03 due to higher than expected property valuation gains ($8.0M vs $3.8M)
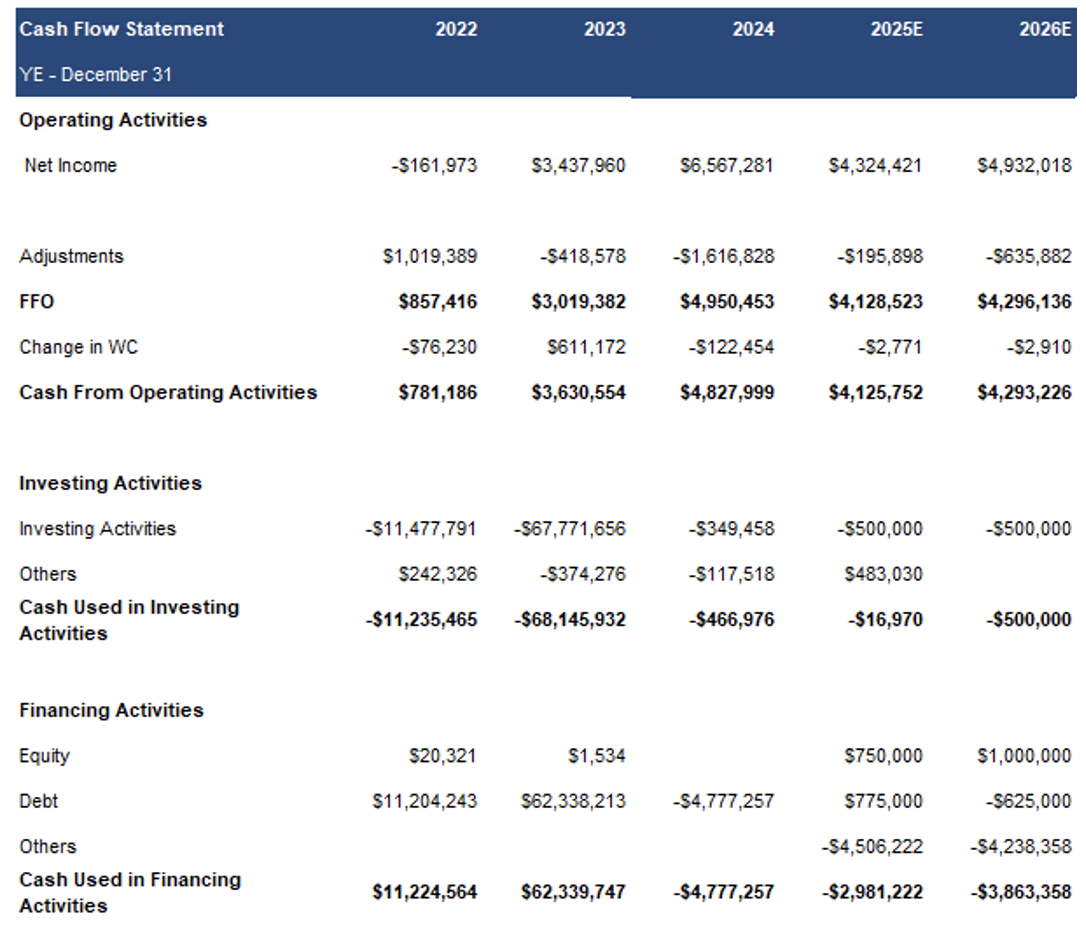
Gross and EBITDA margins were relatively flat YoY. Free cash flows were up 36% YoY
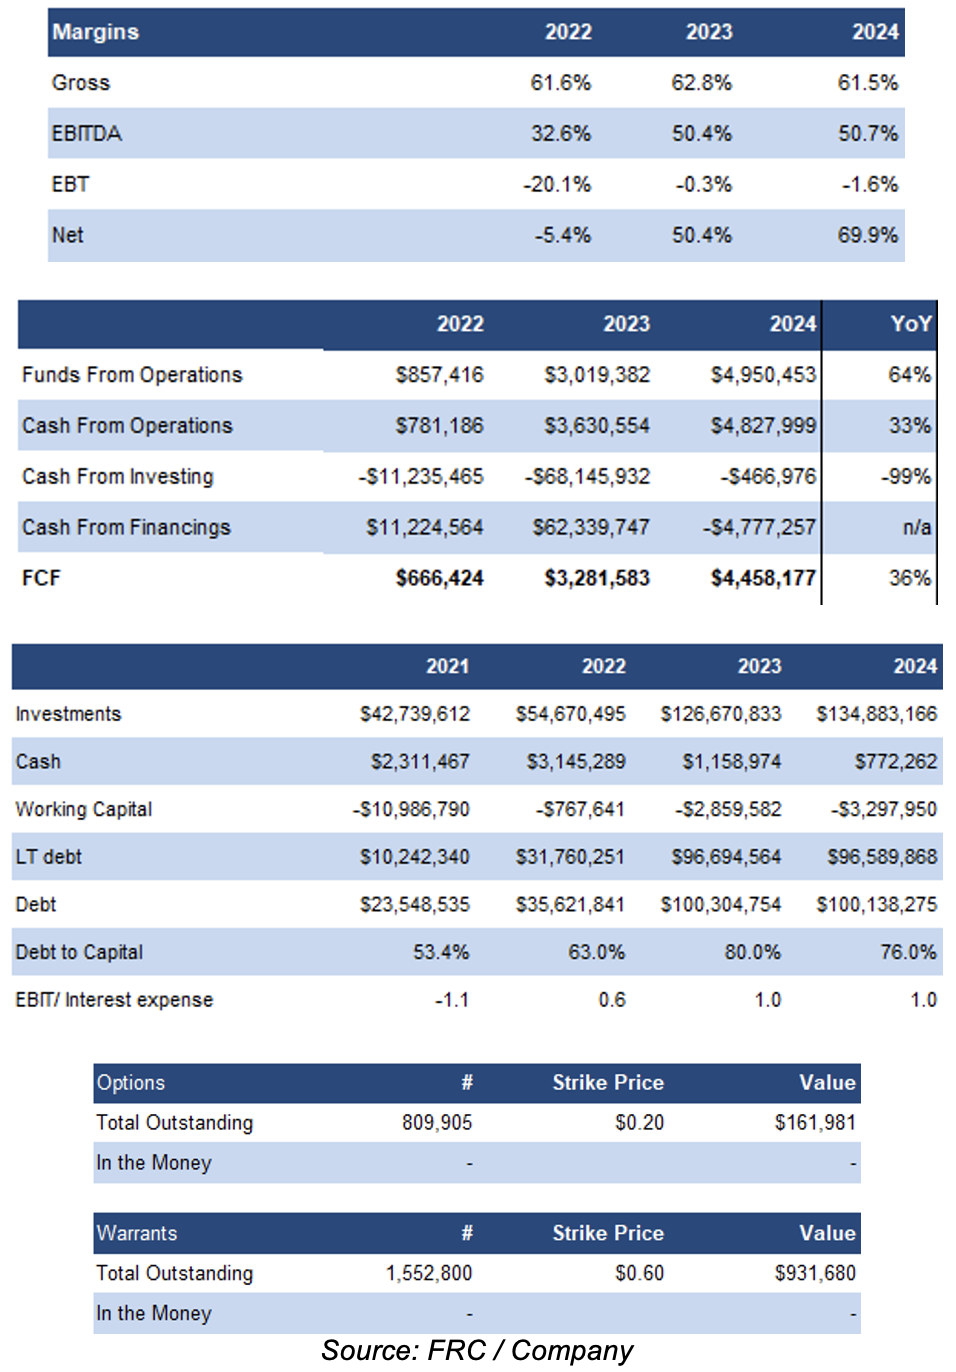
Debt to capital was 76% at the end of 2024 vs the sector average of 52%. As equity grows through potential gains in property valuations, YEG's debt to capital should trend lower
No outstanding options/warrants are in-the-money
FRC Projections and Valuation
We are raising our 2025 EPS forecast to $0.04 (from $0.03) on higher valuation gains ($5M vs $4M). Sector multiples are down 9% since our previous report in November 2024
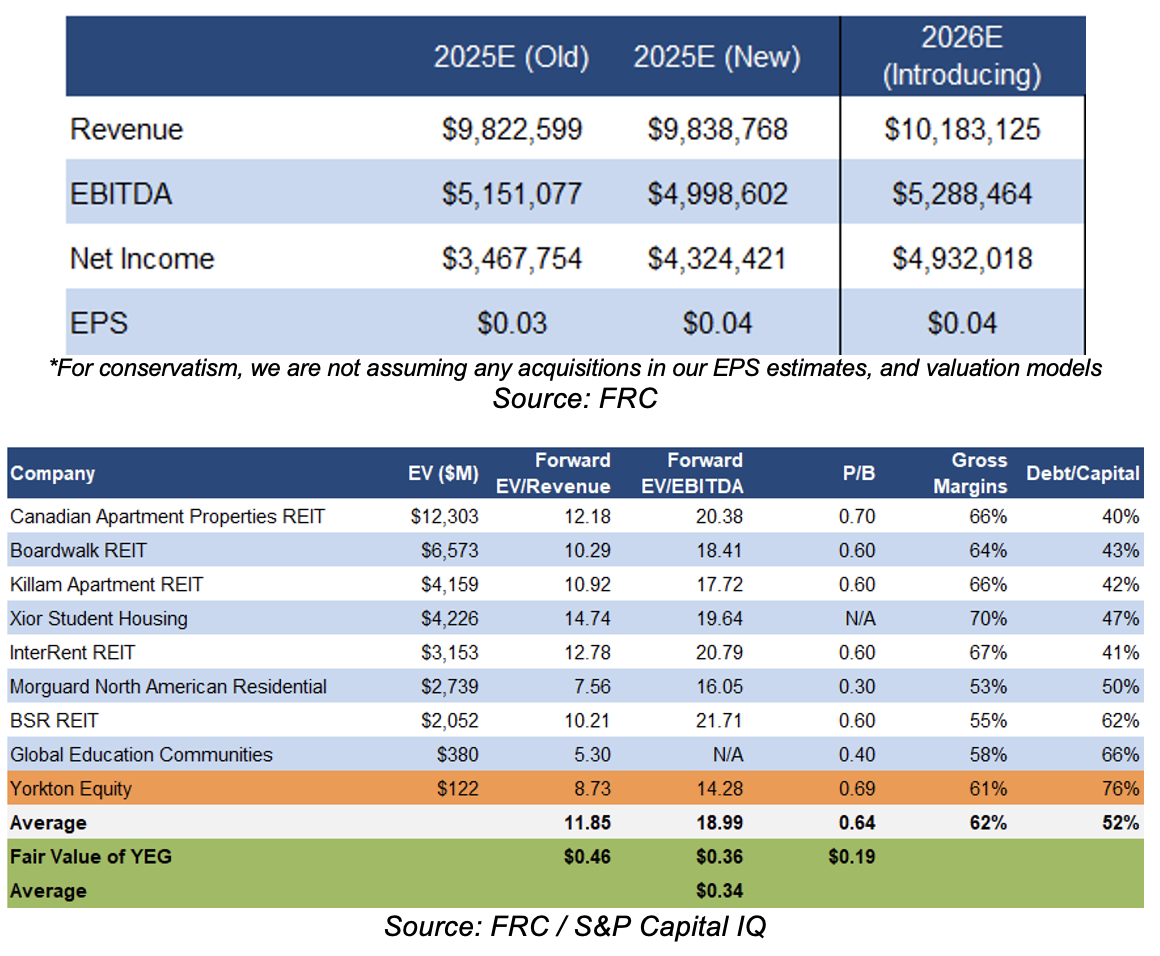
Sector multiples are down 9% since our previous report in November 2024. YEG’s forward EV/EBITDA is 14x (previously 18x) vs the sector average of 19x (previously 20x)
Applying sector averages to our revenue and EBITDA estimates, we are arriving at a fair value estimate of $0.34/share (previously $0.32/share)
Valuation increased because we are now using our 2025 estimates vs 2024 previously
We are reiterating our BUY rating, and adjusting our fair value estimate from $0.32 to $0.34/share. YEG's impressive 2024 results, fueled by robust rental demand, and strategic property acquisitions, highlight its strong operational execution. Looking ahead, we believe favorable Canadian multi-family residential market dynamics, coupled with anticipated rate cuts, position YEG for continued valuation growth.
Risks
We are maintaining our risk rating of 3 (Average)
We believe the company is exposed to the following key risks:
- Investments in real estate are typically affected by macroeconomic conditions, and the health of local real estate markets
- Like all real estate companies, YEG utilizes leverage to amplify returns
- Interest rates
- Property-specific risks such as vacancy rates, and unexpected maintenance or repair costs
APPENDIX
