Shifting Investor Sentiment / Copper-Gold M&A / Bitcoin Outlook Cloudy
Published: 8/6/2024
Author: FRC Analysts

- Last week, global equity markets plunged amid mounting fears of a U.S. recession
- With rate cut expectations largely priced in, we believe investors have become increasingly sensitive to negative economic data
- BHP (ASX: BHP) and Lundin Mining’s (TSX: LUN) latest move is excellent news for junior resource companies
- Shares of a junior gold producer under coverage were up 40% last week
- Four out of five key statistically significant factors indicate potential weakness in near-term Bitcoin prices
South Star Battery Metals Corp. (STSBF, STS.V)
PR Title: Secures additional orders for its graphite concentrates from U.S. customers
Analyst Opinion: Positive - To date, STS has executed three sales agreements for natural flake graphite concentrates produced at its flagship Santa Cruz graphite mine in Brazil. Construction is nearly complete, with commissioning currently underway. Commercial production is expected to begin in September. The open-pittable Santa Cruz graphite deposit has potential to produce anode materials for lithium-ion batteries.
N/A
PR Title: Announces a private placement of up to $10M
Analyst Opinion: Positive - DMET is on track to bring two projects into production within the next 12 months: the Aguablanca nickel-copper project in Spain, and the Zancudo gold silver project in Colombia. The combined AT-NPV5% of Aguablanca and Zancudo is US$248M. DMET is trading at just 21% of this AT-NPV.
Chatham Rock Phosphate Limited (NZP.V, GELGF)
PR Title: Project updates
Analyst Opinion: Positive - Chatham owns three advanced-stage phosphate properties: Chatham Rise in New Zealand, Makatea in French Polynesia, and Korella in Australia. These projects host direct application/low-cadmium phosphate deposits that can be advanced to production for relatively low OPEX/CAPEX. The company is in the final stages of securing a mining permit for Korella and aims to begin production this year. Per our previous update report in November 2023, we estimated the combined Net Asset Value (NAV) of the three projects is $70M. NZP is trading at just 11% of our NAV estimate.
Updates on Financials, Technology, Energy, and Special Situations Companies Under Coverage
Pixie Dust Technologies, Inc/ NASDAQ-PSDT
PR Title: Launches VUEVO Display
Analyst Opinion: Positive - VUEVO Display provides real-time subtitles and tranlsations of conversations on a screen. Designed for public transportation counters and hotel reception desks frequented by foreign visitors, the company has yet to disclose product pricing or any sales orders or agreements. Pixie has six commercialized products (all launched in the past one/two years), and several others in R&D stages. One of its flagship products promotes hair growth and mitigates hair loss. The company also offers products for individuals who are deaf or hard of hearing, and those interested in improving their cognitive abilities.
FRC Top Picks
The following table shows last week’s top five performers among our Top Picks. The top performer, Starcore International Mines, was up 40%. Starcore operates a profitable gold in Mexico, while actively exploring for gold in Africa.
| Top Five Weekly Performers | WoW Returns |
| Starcore International Mines Ltd. (SAM.TO) | 40.0% |
| Hemostemix Inc. (HEM.V) | 22.2% |
| Western Exploration Inc. (WEX.V) | 19.2% |
| Olympia Financial Group Inc. (OLY.TO) | 4.6% |
| Rio2 Limited (RIO.V) | 1.9% |
| * Past performance is not indicative of future performance (as of Aug 6, 2024) |
Source: FRC
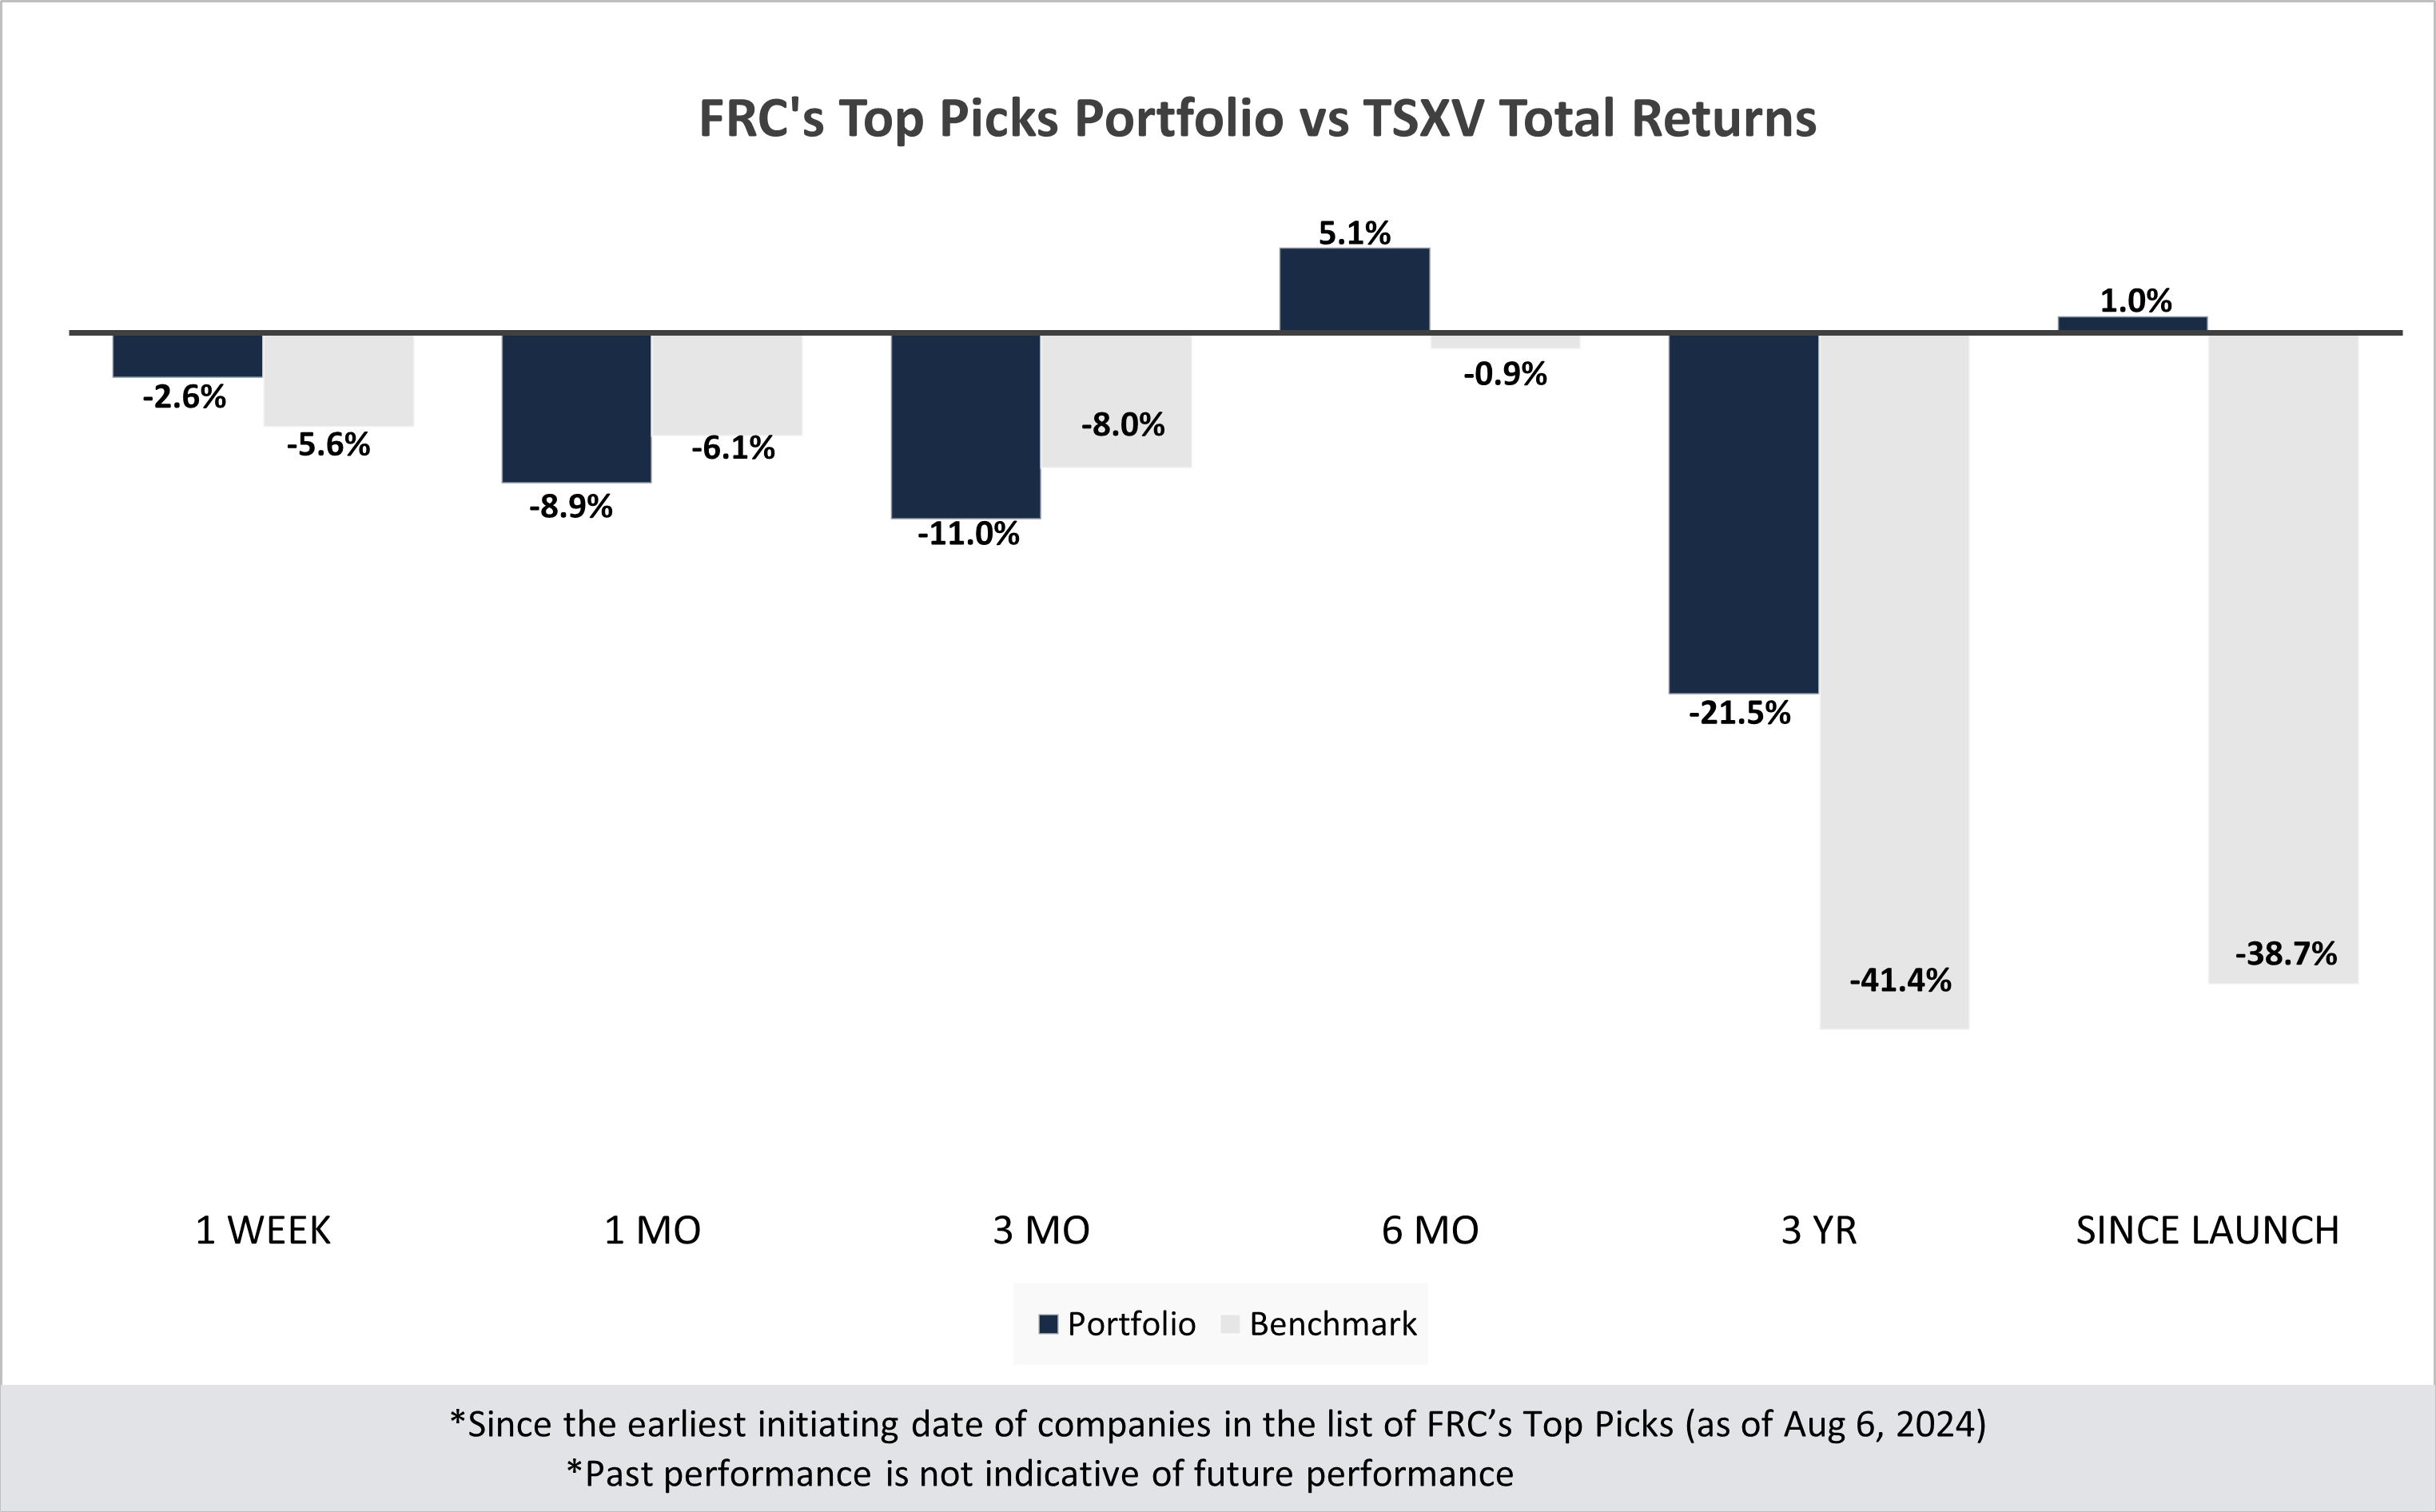
Our top picks have outperformed the benchmark (TSXV) in four out of six time periods listed below.
Performance by Sector
| Total Return | 1 Week | 1 mo | 3 mo | 6 mo | 3 yr | Since launch |
| Mining | -3.8% | -13.0% | -13.9% | 7.1% | -41.2% | -1.5% |
| Cannabis | N/A | N/A | N/A | N/A | -48.4% | -23.6% |
| Tech | -3.1% | -3.1% | -42.6% | 47.6% | -33.3% | -4.5% |
| Special Situations (MIC) | 2.9% | 7.1% | 13.1% | 4.9% | -19.6% | -7.2% |
| Private Companies | N/A | N/A | N/A | N/A | 20.5% | 30.5% |
| Portfolio (Total) | -2.6% | -8.9% | -11.0% | 5.1% | -21.5% | 1.0% |
| Benchmark (Total) | -5.6% | -6.1% | -8.0% | -0.9% | -41.4% | -38.7% |
| Portfolio (Annualized) | - | - | - | - | -7.7% | 0.1% |
| Benchmark (Annualized) | - | - | - | - | -16.3% | -4.5% |
1. Since the earliest initiating date of companies in the list of Top Picks (as of August 6, 2024) 2. Green (blue) indicates FRC's picks outperformed (underperformed) the benchmark. 3. Past performance is not indicative of future performance. 4. Our complete list of top picks (updated weekly) can be viewed here: Top Picks List
Market Updates and Insights: Mining
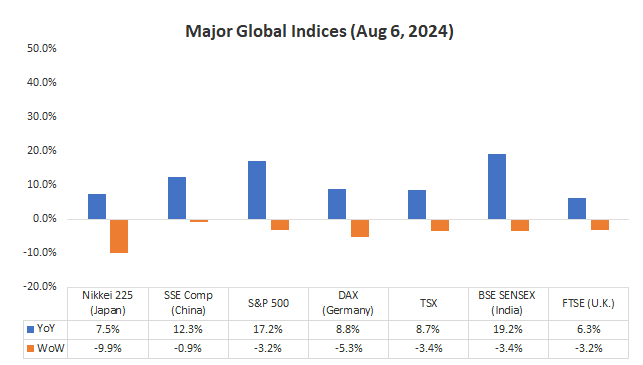
Last week, global equity markets were down 4.2% on average (down 0.8% in the previous week), primarily triggered by mounting fears of a U.S. recession ignited by a softer-than-expected jobs report, and an uptick in unemployment. Until recently, negative economic news was viewed as 'good' news for equity markets because it often signaled potential rate cuts. However, with rate cut expectations largely priced in, we believe investors have become increasingly sensitive to negative economic data.
While equity markets rebounded somewhat today, we believe sustained optimism hinges on the Fed signaling a more aggressive rate cut trajectory than currently anticipated.
Source: FRC / Various
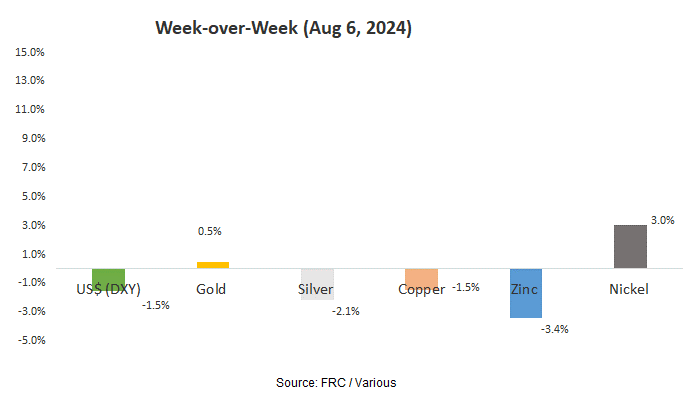
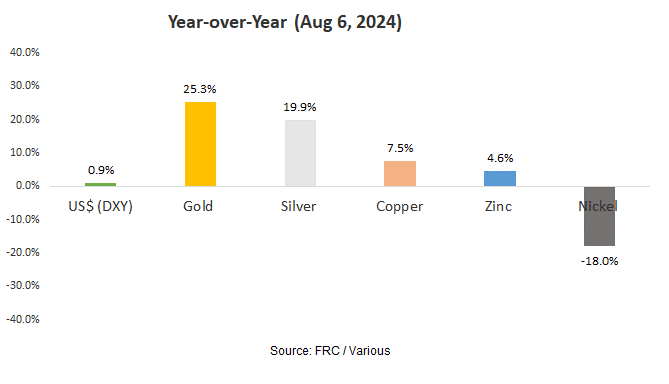
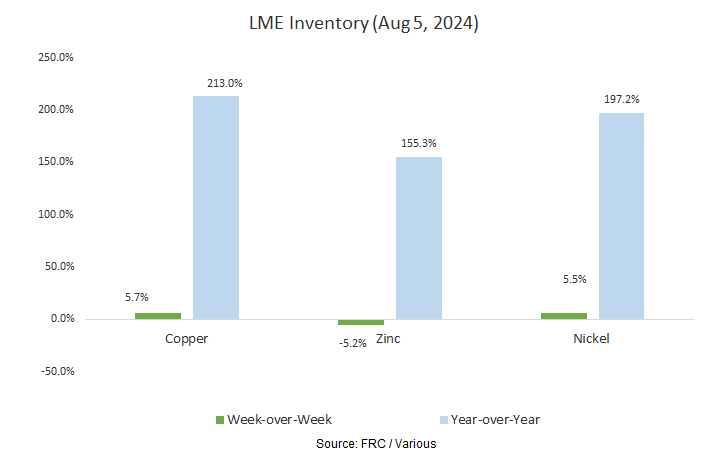
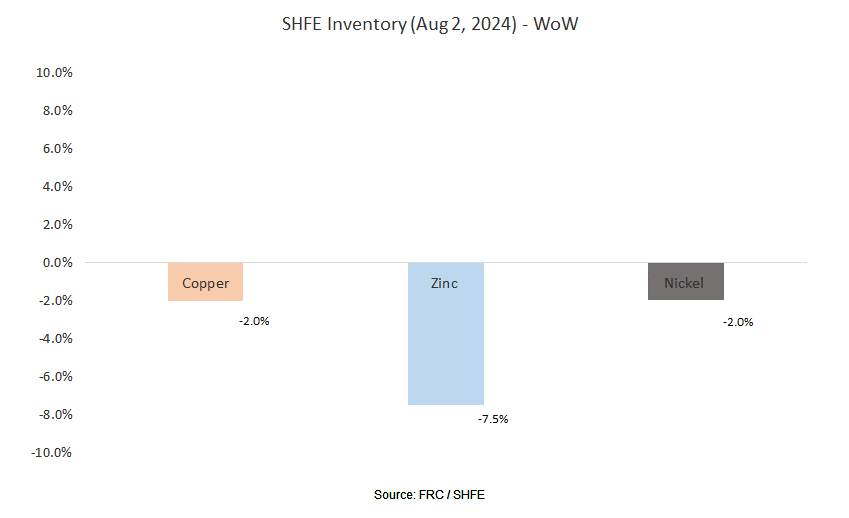
Last week, metal prices were down 0.7% on average (down 2.7% in the previous week).
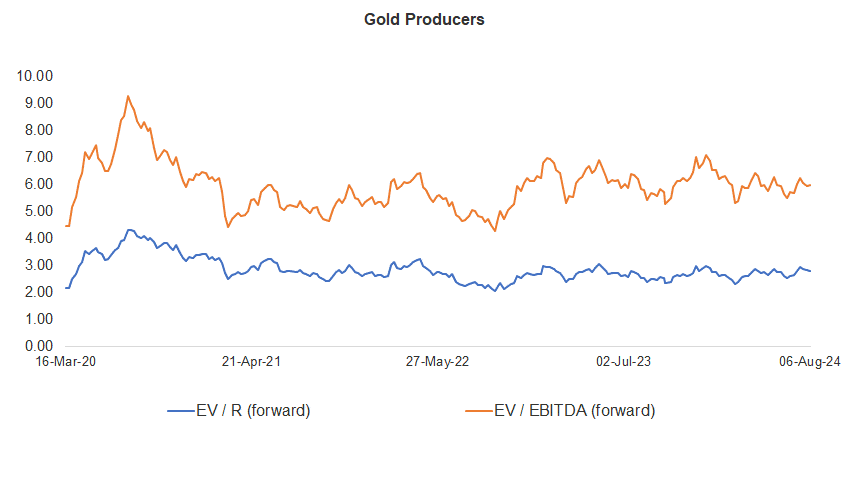
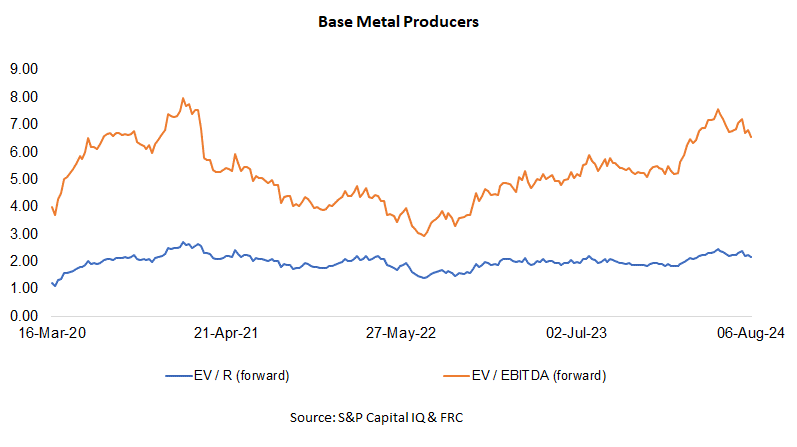
Gold producer valuations were down 0.3% last week (down 1.7% in the prior week); base metal producers were down 3.5% last week (up 1.5% in the prior week). On average, gold producer valuations are 17% lower (previously 16%) than the past three instances when gold surpassed US$2k/oz.
| 22-Jul-24 | 29-Jul-24 | ||||
| Gold Producers | EV / R (forward) | EV / EBITDA (forward) | EV / R (forward) | EV / EBITDA (forward) | |
| 1 | Barrick | 3.13 | 6.46 | 3.04 | 6.25 |
| 2 | Newmont | 3.43 | 7.77 | 3.34 | 7.56 |
| 3 | Agnico Eagle | 4.83 | 8.80 | 4.77 | 8.60 |
| 4 | AngloGold | 2.46 | 5.66 | 2.37 | 5.47 |
| 5 | Kinross Gold | 2.67 | 5.63 | 2.62 | 5.50 |
| 6 | Gold Fields | 2.92 | 5.55 | 3.03 | 5.61 |
| 7 | Sibanye | 0.66 | 3.66 | 0.65 | 3.59 |
| 8 | Hecla Mining | 5.08 | 13.69 | 4.94 | 13.28 |
| 9 | B2Gold | 1.74 | 3.28 | 1.71 | 3.27 |
| 10 | Alamos | 5.27 | 9.49 | 5.10 | 9.43 |
| 11 | Harmony | 1.67 | 5.09 | 1.62 | 4.95 |
| 12 | Eldorado Gold | 2.62 | 5.20 | 2.66 | 5.16 |
| Average (excl outliers) | 2.85 | 6.05 | 2.81 | 5.94 | |
| Min | 0.66 | 3.28 | 0.65 | 3.27 | |
| Max | 5.27 | 13.69 | 5.10 | 13.28 | |
| Industry (three year average) | 110.70 | 116.70 | 110.70 | 116.70 | |
| Base Metal Producers | EV / R (forward) | EV / EBITDA (forward) | EV / R (forward) | EV / EBITDA (forward) | |
| 1 | BHP Group | 2.81 | 5.38 | 2.80 | 5.35 |
| 2 | Rio Tinto | 2.13 | 4.63 | 2.14 | 4.62 |
| 3 | South32 | 1.30 | 5.94 | 1.28 | 6.01 |
| 4 | Glencore | 0.43 | 5.66 | 0.42 | 5.50 |
| 5 | Anglo American | 1.82 | 5.36 | 1.90 | 5.60 |
| 6 | Teck Resources | 3.34 | 7.80 | 3.58 | 8.66 |
| 7 | First Quantum | 3.60 | 12.11 | 3.55 | 11.86 |
| Average (excl outliers) | 2.20 | 6.70 | 2.24 | 6.80 | |
| Min | 0.43 | 4.63 | 0.42 | 4.62 | |
| Max | 3.60 | 12.11 | 3.58 | 11.86 | |
Source: S&P Capital IQ & FRC
We are maintaining our metal price forecasts.
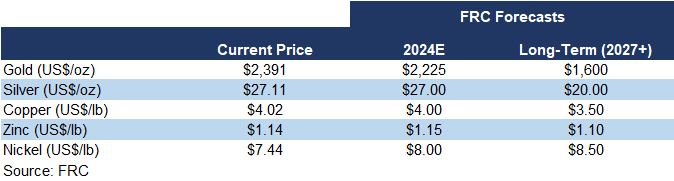
Key Developments:
Last week, BHP and Lundin Mining announced plans to acquire Canadian junior Filo Corp. (TSX: FIL) for $4.1B, or $33 per share, reflecting a 32% premium over FIL's 30-day volume-weighted average price. Filo owns a large advanced-stage copper-gold-silver project on the Chile-Argentina border, with resources totaling 4.5 Bls of copper, 6.7 Moz of gold, and 210 Moz of silver, amounting to 19 Moz of gold equivalent. We estimate that BHP and Lundin are paying over $200/oz, a significant premium compared to the typical $50-$100/oz range for copper-gold juniors. We believe this premium reflects the eagerness of major players to engage in M&A and consolidate their portfolios, which is excellent news for junior resource companies.
Market Updates and Insights: Cryptos
Prices of mainstream/popular cryptos were down 17% on average last week (down 1% in the previous week).
| August 6, 2024 | ||
| Cryptos | WoW | YoY |
| Bitcoin | -13% | 96% |
| Binance Coin | -15% | 102% |
| Cardano | -15% | 14% |
| Ethereum | -22% | 37% |
| Polkadot | -18% | -8% |
| XRP | -18% | -18% |
| Polygon | -19% | -38% |
| Solana | -17% | 536% |
| Average | -17% | 90% |
| Min | -22% | -38% |
| Max | -13% | 536% |
| Indices | ||
| Canadian | WoW | YoY |
| BTCC | -15% | 85% |
| BTCX | -15% | 98% |
| EBIT | -15% | 92% |
| FBTC | -14% | 22% |
| U.S. | WoW | YoY |
| BITO | -20% | 23% |
| BTF | -20% | 41% |
| IBLC | -13% | 34% |
Source: FRC/Yahoo Finance
The global MCAP of cryptos is US$2.01T, down 7% MoM, but up 67%YoY.
Total Crypto Market Cap Chart
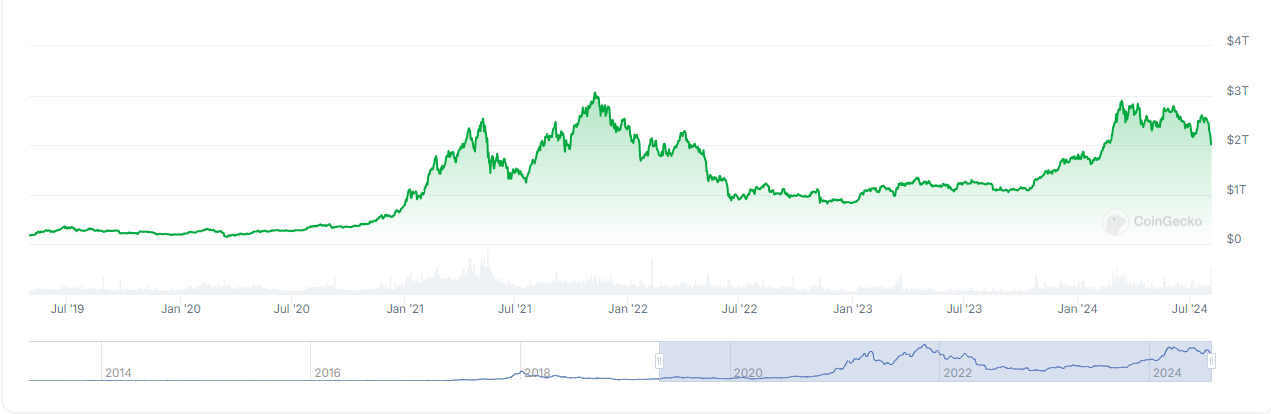
Source: CoinGecko
Last week, BTC was down 12.7%, while the S&P 500 was down 3.2%. The U.S. 10-year treasury yield was down 0.27 pp.
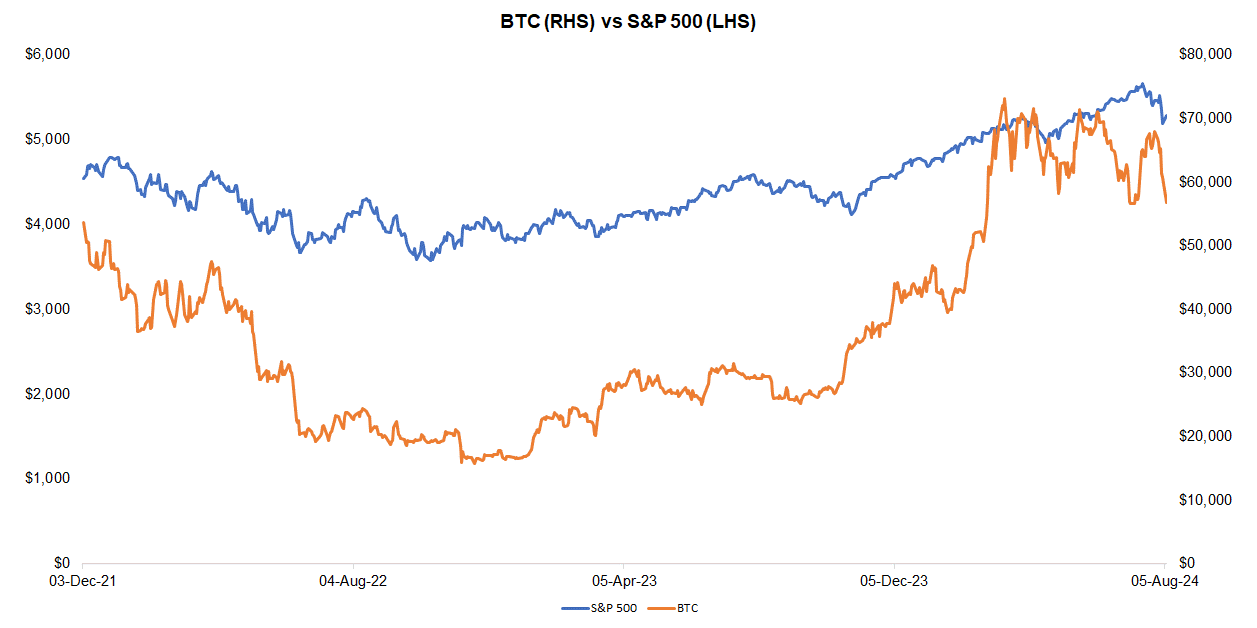
Source: FRC/ Yahoo Finance
The global hash rate of BTC (defined as calculations performed per second/an indicator of network difficulty) is 628 exahashes per second (EH/s), down 5% WoW, but up 9% MoM. The decrease in hash rates is positive for miners as their efficiency rates (BTC production per EH/s) are inversely linked to global hash rates.
Total Hash Rate (BTC)
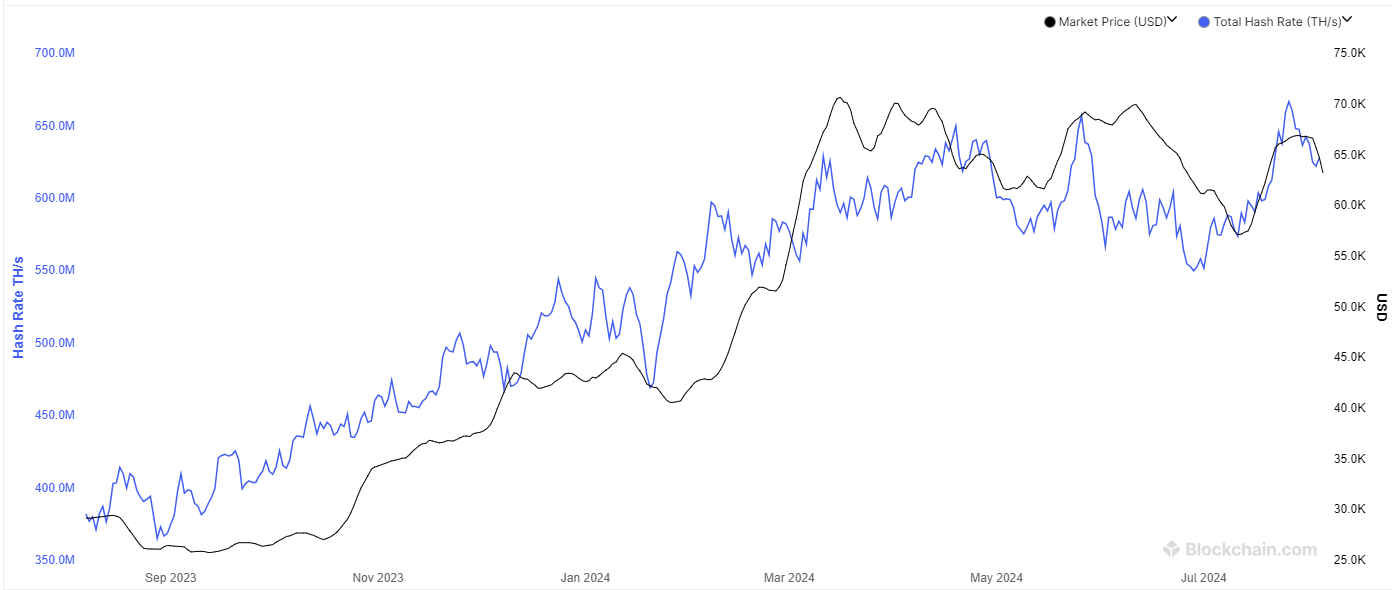
The Realized HODL ratio (RHODL), which gauges the activity of short-term holders relative to long-term holders, was down 22% WoW, but up 635% YoY. We interpret the decrease in RHODL as a sign of weakening demand, suggesting potential for a downtick in near-term prices. Historically, BTC prices have moved in tandem with this ratio. By tracking RHODL, we believe we can identify potential turning points in BTC prices.
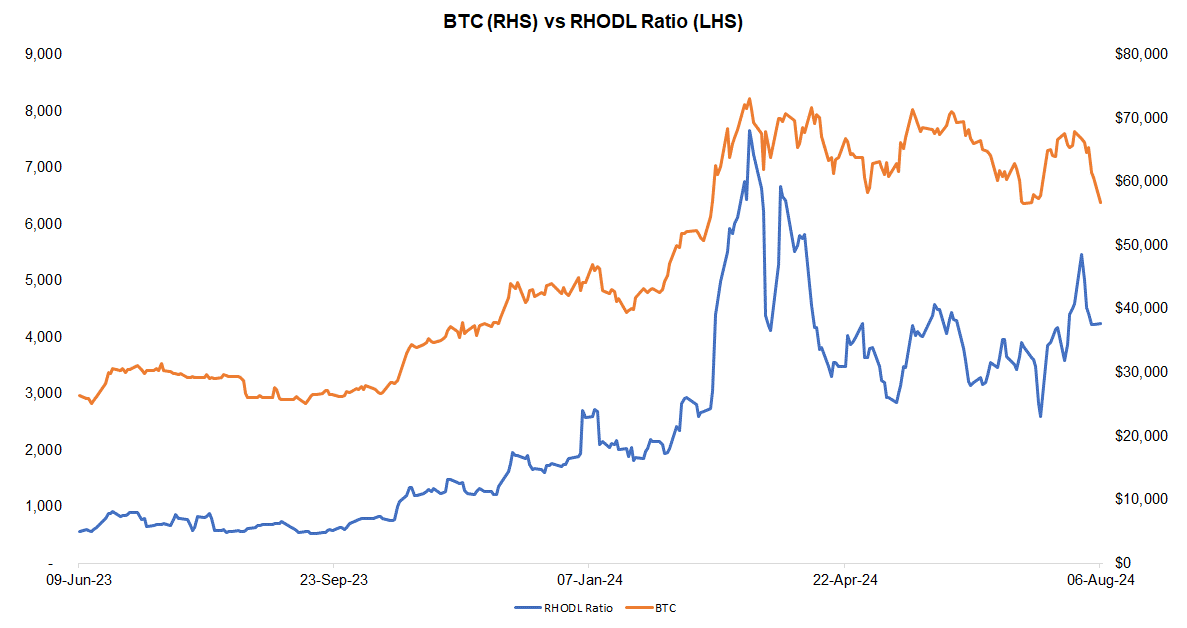
Source: FRC/ Various
The table below highlights key statistically significant factors influencing BTC prices. With four negative signals and one positive, the near-term outlook for BTC prices appears weak.
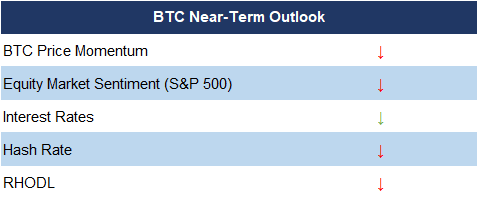
* “↑” and “↓” indicate whether a parameter has increased or decreased
* Red (green) denotes a negative (positive) signal for BTC prices; black implies neutral.
Source: FRC
Companies operating in the crypto space are trading at an average EV/R of 5.1x (previously 6.6x).
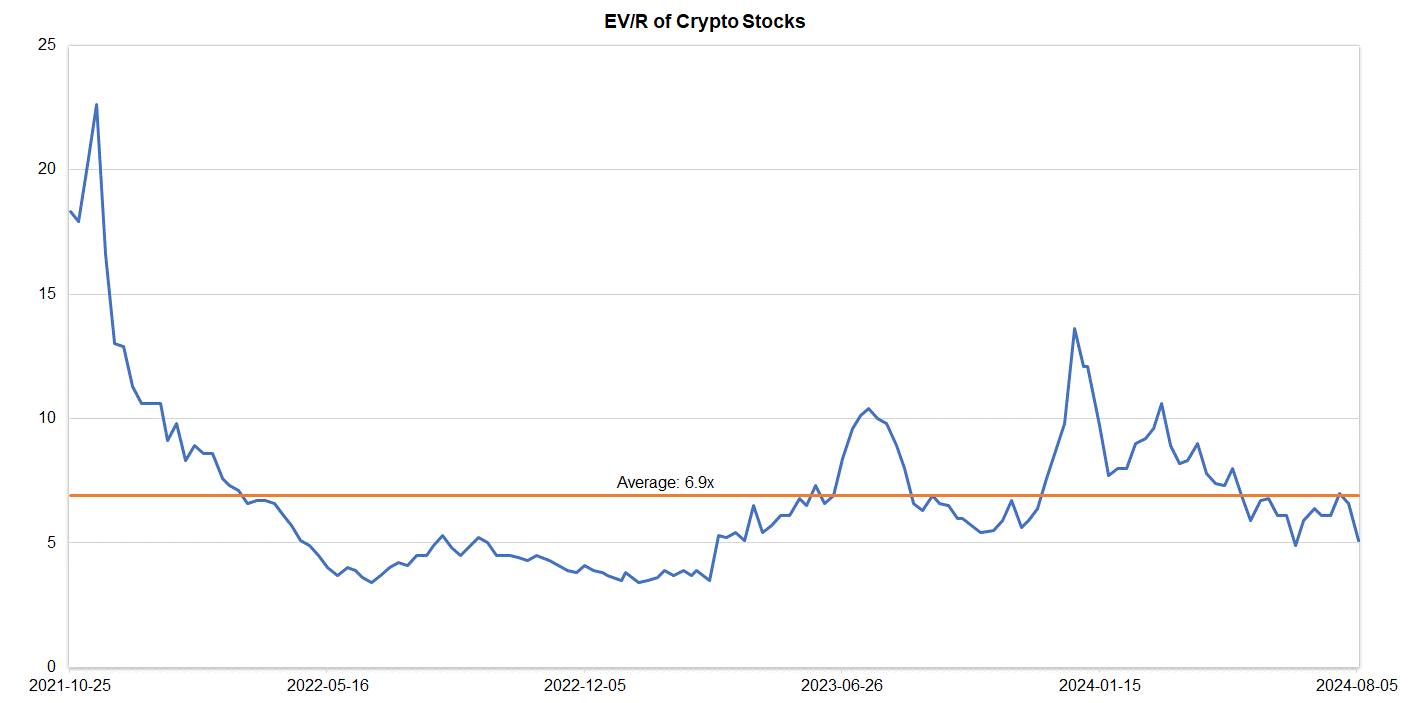
Source: S&P Capital IQ/FRC
| August 6, 2024 | |
| Crypto Stocks | EV/Revenue |
| Argo Blockchain | 2.0 |
| BIGG Digital | 4.6 |
| Bitcoin Well | 0.8 |
| Canaan Inc. | 1.0 |
| CleanSpark Inc. | 8.9 |
| Coinbase Global | 9.9 |
| Galaxy Digital Holdings | N/A |
| HIVE Digital | 3.3 |
| Hut 8 Mining Corp. | 8.2 |
| Marathon Digital Holdings | 9.0 |
| Riot Platforms | 6.8 |
| SATO Technologies | 1.5 |
| Average | 5.1 |
| Median | 4.6 |
| Min | 0.8 |
| Max | 9.9 |
Source: S&P Capital IQ/FRC
Market Updates and Insights: Artificial Intelligence/AI
Major AI indices are down 8% WoW on average (down 3% in the previous week), but up 2% YoY.
| August 6, 2024 | ||
| AI Indices | WoW | YoY |
| First Trust Nasdaq AI and Robotics ETF | -9% | -13% |
| Global X Robotics & AI ETF | -7% | 3% |
| Global X AI & Technology ETF | -7% | 13% |
| iShares Robotics and AI Multisector ETF | -8% | -7% |
| Roundhill Generative AI & Technology ETF | -8% | 10% |
| Average | -8% | 2% |
| Min | -9% | -13% |
| Max | -7% | 13% |
Source: FRC/Various
The following table highlights some of the most popular large-cap AI stocks. Shares of these companies are down 9% WoW on average (down 7% in the previous week), but up 62% YoY. Their average P/E is 32.9x (previously 37.2x) vs the NASDAQ-100 Index’s average of 28.7x (previously 30.9).
| AI Stocks | WoW | YoY | P/E |
| Arista Networks | -4% | 81% | 40.9 |
| Dell Technologies | -18% | 74% | 20.1 |
| Microsoft Corporation | -4% | 22% | 33.5 |
| NVIDIA Corp | -6% | 134% | 58.7 |
| Micron Technology | -19% | 29% | n/a |
| Palantir Technologies | -1% | 49% | n/a |
| Qualcomm | -8% | 34% | 20.2 |
| Super Micro Computer (SMCI) | -13% | 74% | 33.8 |
| Taiwan Semiconductor Manufacturing | -5% | 58% | 22.9 |
| Average | -9% | 62% | 32.9 |
| Median | -6% | 58% | 33.5 |
| Min | -19% | 22% | 20.1 |
| Max | -1% | 134% | 58.7 |
Source: FRC/Various


