Metal and Stock Prices Rise on Weaker Dollar / AI Heats Up Nuclear Power
Published: 7/8/2024
Author: FRC Analysts

Key Highlights
- Metal prices and the S&P 500 rallied last week, primarily driven by a weaker US$
- The Canadian government's announcement of a stricter stance on foreign takeovers of domestic mining companies could pose a setback for Canadian miners and explorers
- Promising development for a junior under coverage with gold projects in Ethiopia
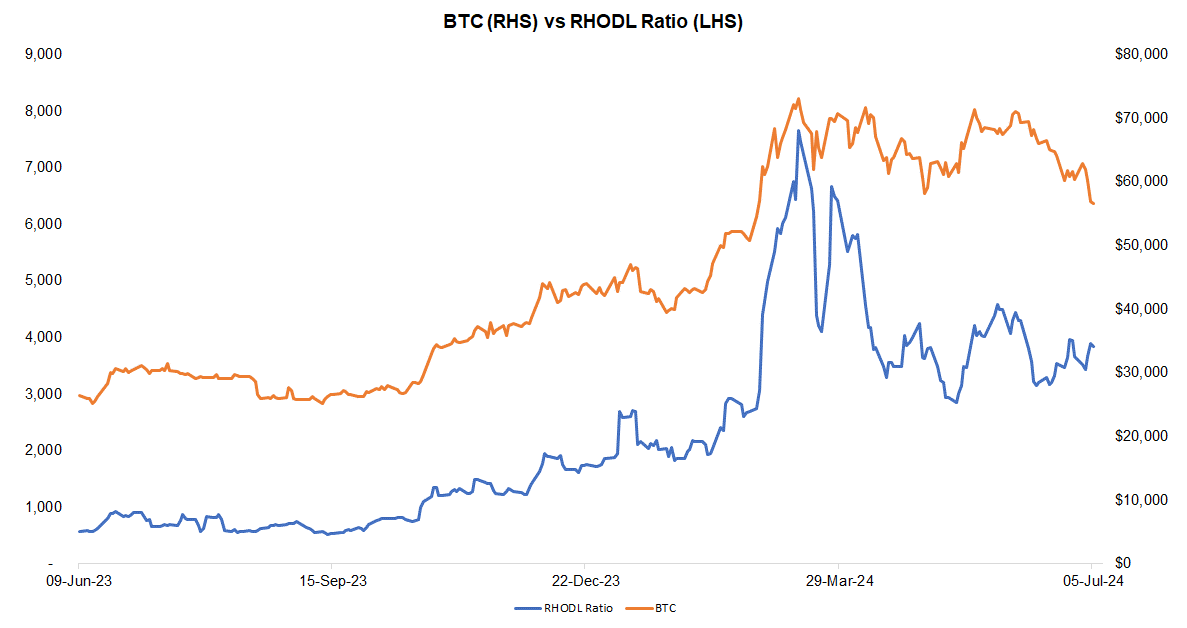
- The global hash rate of Bitcoin (BTC) and the Realized HODL ratio (RHODL) increased last week, suggesting potential for an uptick in near-term BTC prices
- With AI driving increased power demand for data centers, nuclear power companies are experiencing a surge in investor sentiment
East Africa Metals Inc. (EAM.V, EFRMF)
PR Title: Prepares for construction at the Adyabo project’s Mato Bula and Da Tambuk mines (Ethiopa)
Analyst Opinion: Positive – Partner Tibet Huaya Mining (SHSE: 601020) has started procuring heavy equipment needed for construction at the Mato Bula and Da Tambuk gold projects, located 4 km apart. Tibet Huaya is funding the project to production. EAM owns a 30% carried interest.
FRC Top Picks
The following table shows last month’s top five performers among our Top Picks, including four junior resource companies, and a Mortgage Investment Corporation. The top performer, Noram Lithium, was up 132%. Last month, NRM announced an updated resource estimate for its lithium project in Nevada; check out our latest update here.
| Top Five Monthly Performers | MoM Returns |
| Noram Lithium Corp. (NRM.V) | 131.8% |
| Rio2 Limited (RIO.V) | 8.2% |
| Southern Silver Exploration Corp. (SSV.V) | 1.9% |
| Steppe Gold (STGO.TO) | 1.7% |
| Timbercreek Financial Corp (TF.TO) | 0.2% |
| * Past performance is not indicative of future performance (as of July 8, 2024) |
Source: FRC
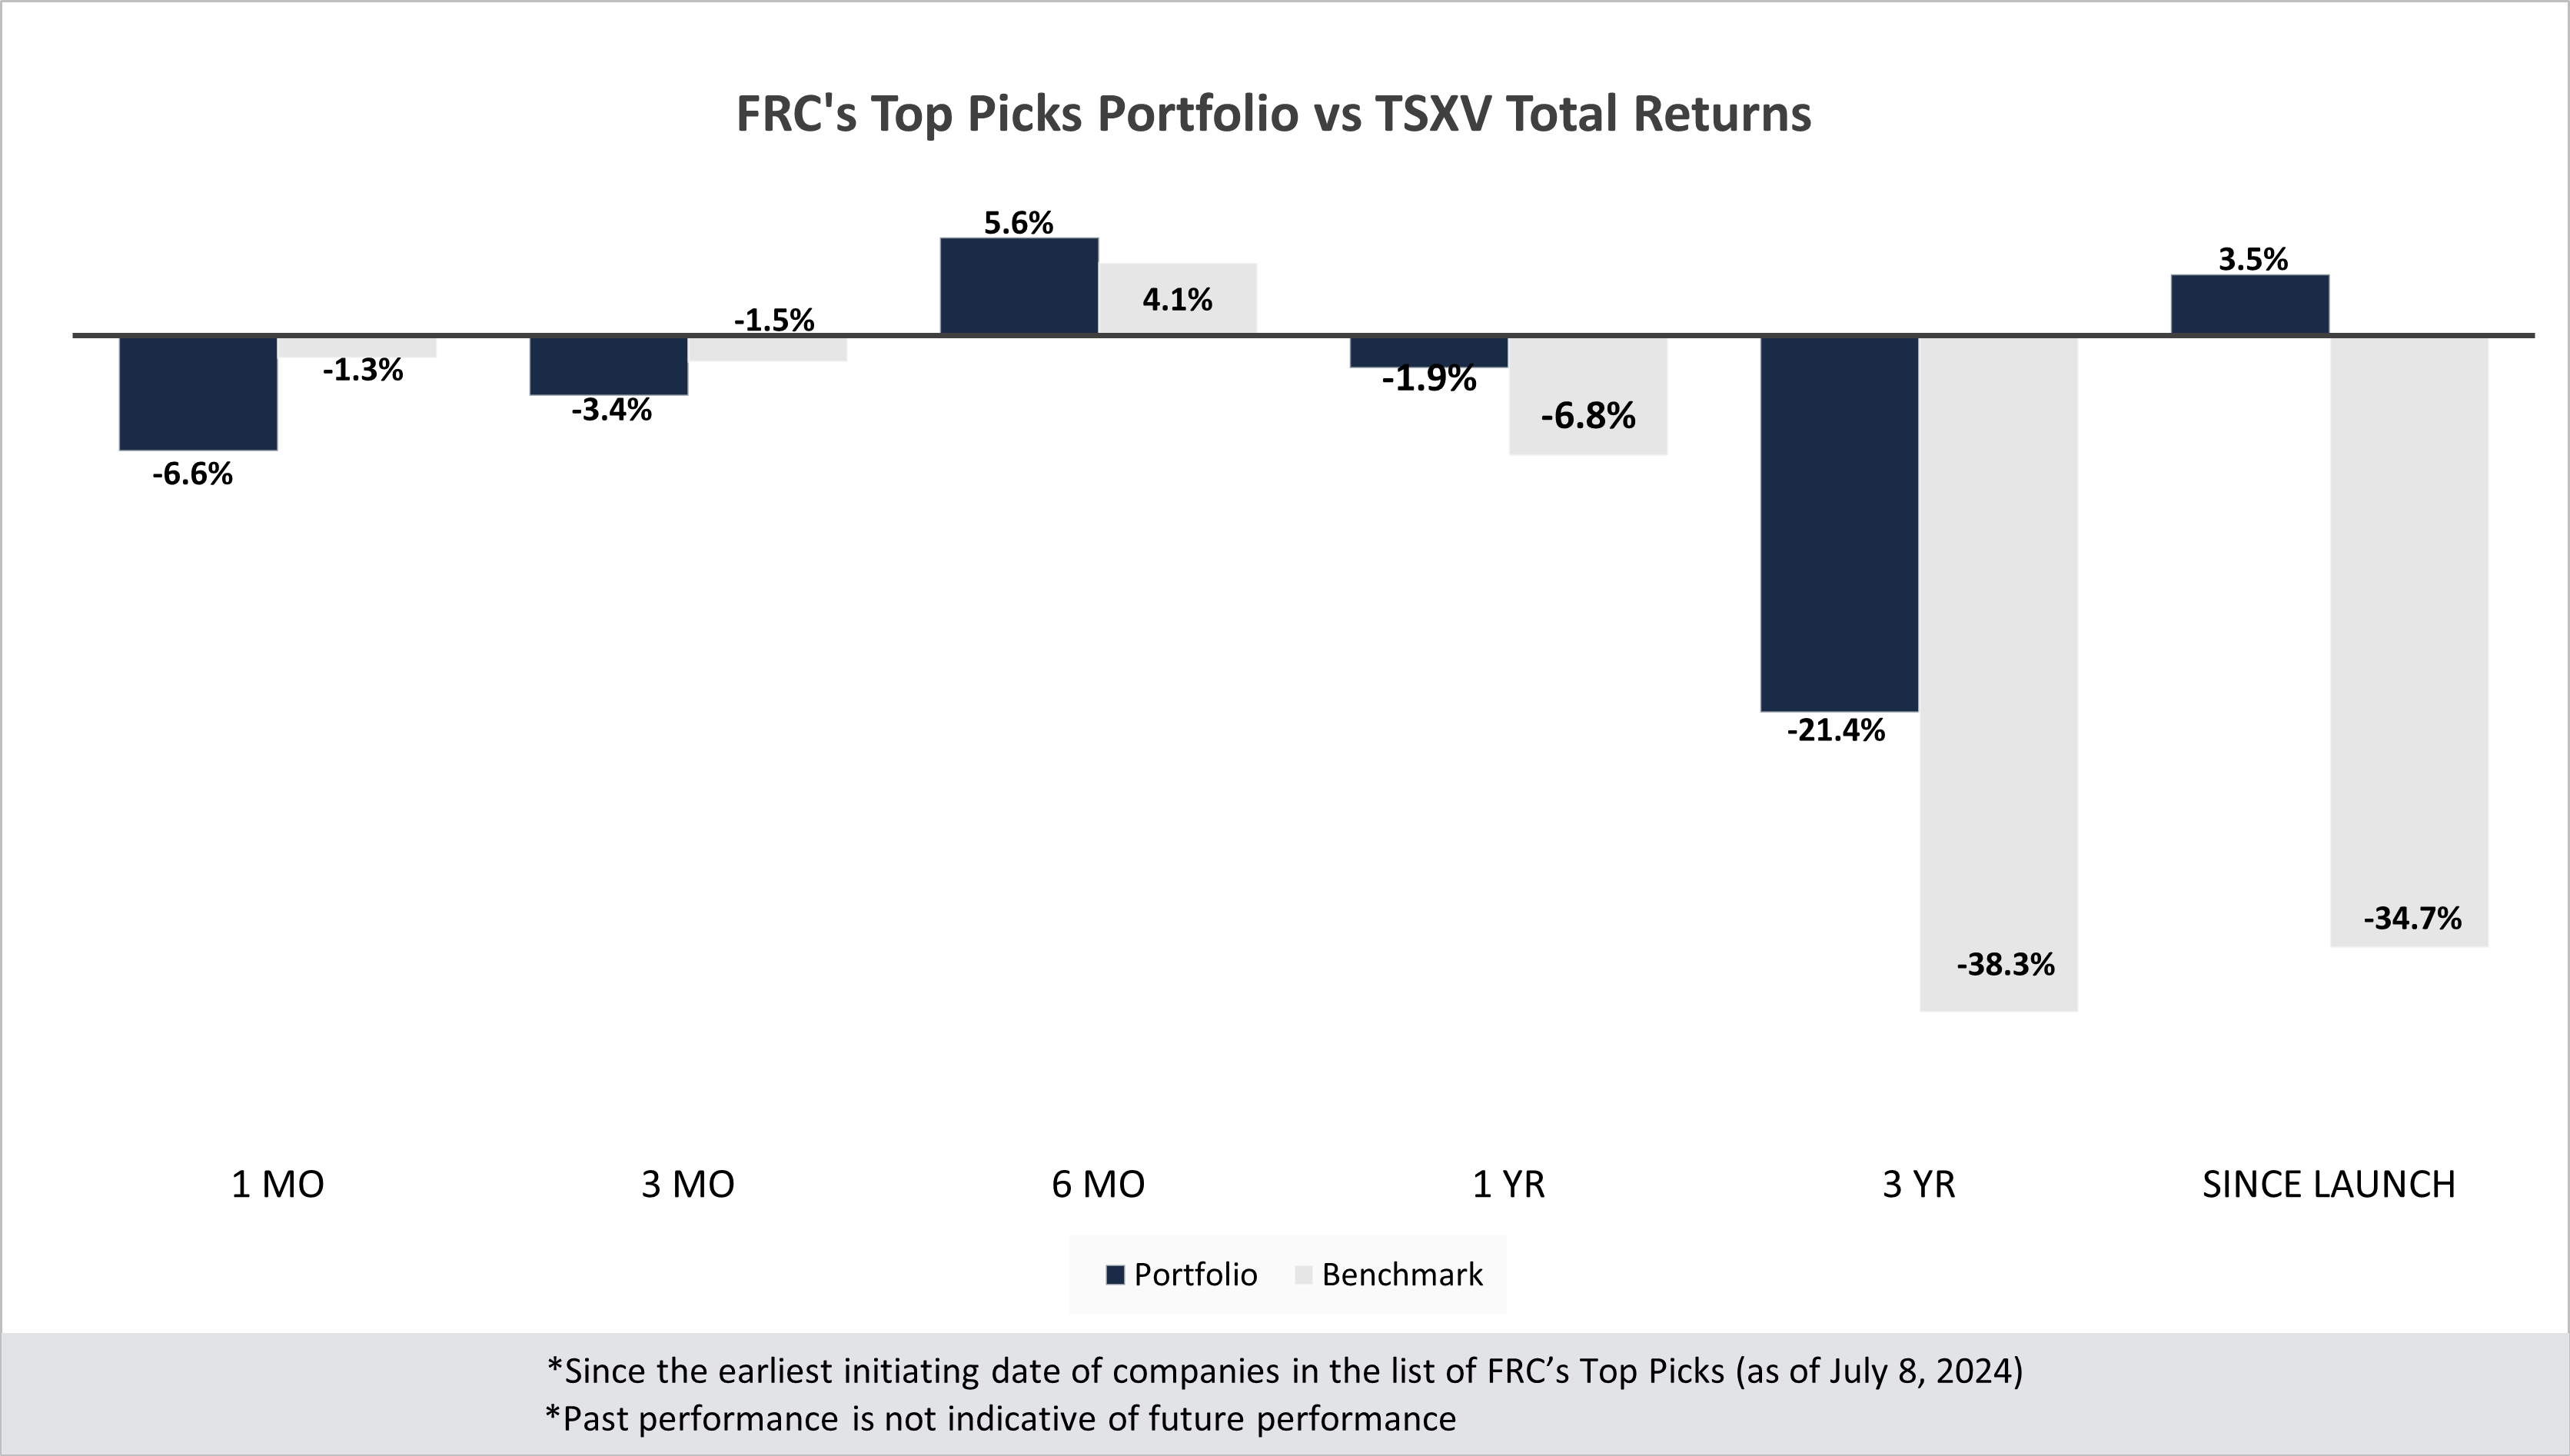
Our top picks have outperformed the benchmark (TSXV) in four out of six time periods listed below.
Performance by Sector
| Total Return | 1 mo | 3 mo | 6 mo | 1 yr | 3 yr | Since launch |
| Mining | -6.1% | 0.3% | 9.6% | -8.2% | -40.0% | 4.7% |
| Cannabis | N/A | N/A | N/A | N/A | -46.1% | -23.6% |
| Tech | -23.8% | -47.0% | 0.0% | -41.0% | -32.6% | -4.5% |
| Special Situations (MIC) | -5.2% | -5.4% | 5.9% | 26.4% | -18.5% | -11.3% |
| Private Companies | N/A | N/A | N/A | 6.7% | 20.5% | 30.5% |
| Portfolio (Total) | -6.6% | -3.4% | 5.6% | -1.9% | -21.4% | 3.5% |
| Benchmark (Total) | -1.3% | -1.5% | 4.1% | -6.8% | -38.3% | -34.7% |
| Portfolio (Annualized) | - | - | - | -1.9% | -7.7% | 0.3% |
| Benchmark (Annualized) | - | - | - | -8.1% | -15.0% | -4.0% |
1. Since the earliest initiating date of companies in the list of Top Picks (as of July 8, 2024) 2. Green (blue) indicates FRC's picks outperformed (underperformed) the benchmark. 3. Past performance is not indicative of future performance. 4. Our complete list of top picks (updated weekly) can be viewed here: Top Picks List
Market Updates and Insights: Mining
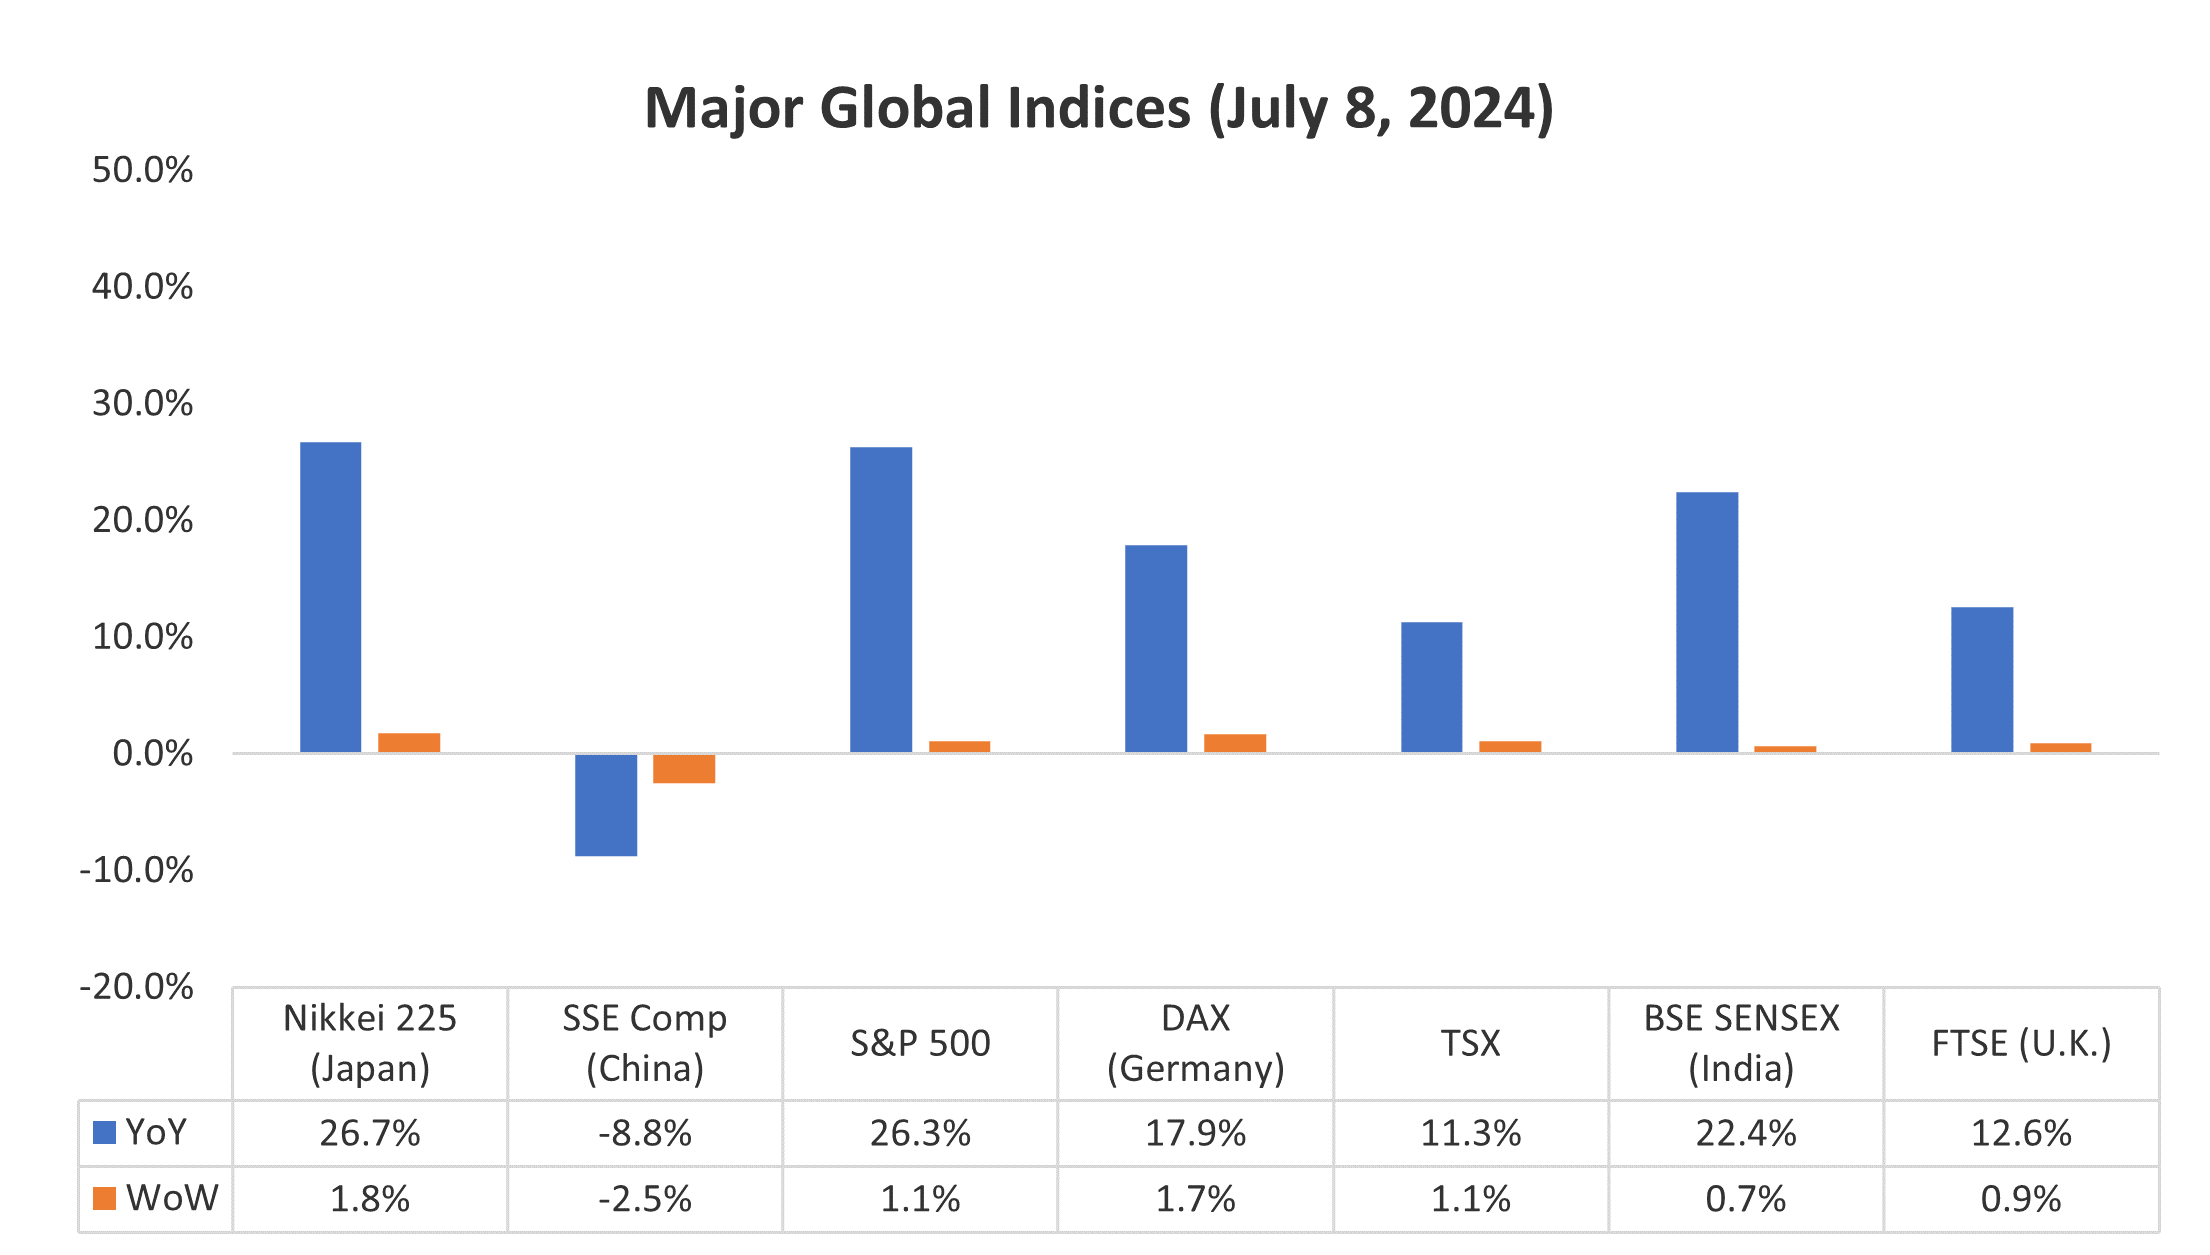
Last week, global equity markets were up 0.7% on average (up 0.7% in the previous week as well). The S&P 500 is up 1.1% WoW, reaching record highs, driven by growing anticipation of Fed rate cuts amid rising unemployment and easing wage growth. We continue to believe that the Fed will cut rates in Q4-2024.
Source: FRC / Various
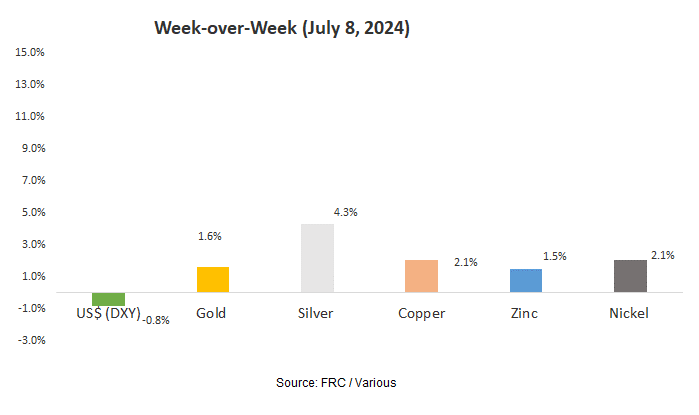
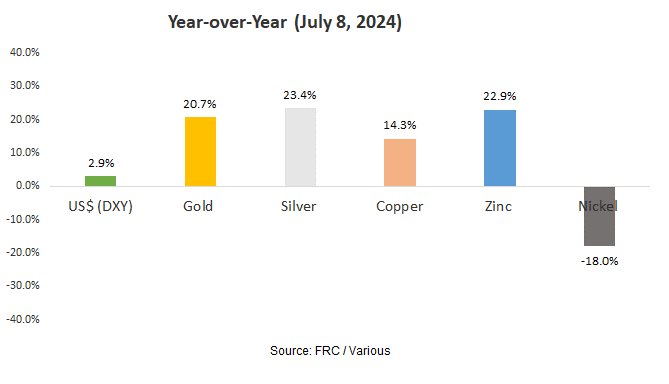
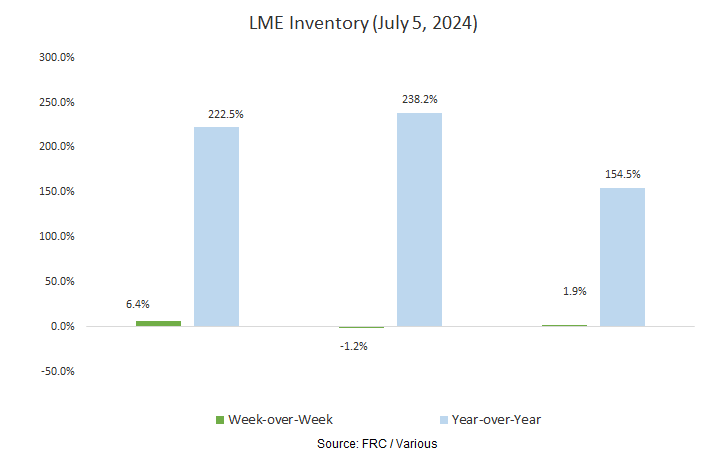
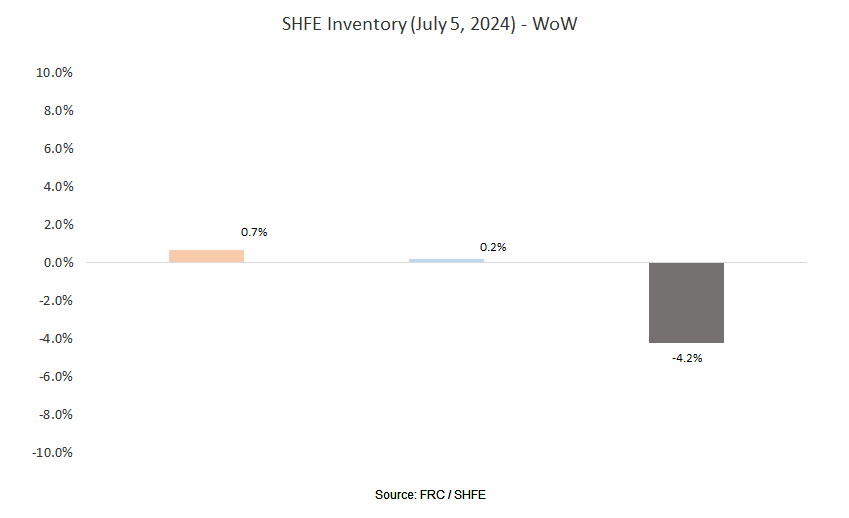
Last week, metal prices were up 2.3% on average (up 0.8% in the previous week), primarily driven by a weaker US$.
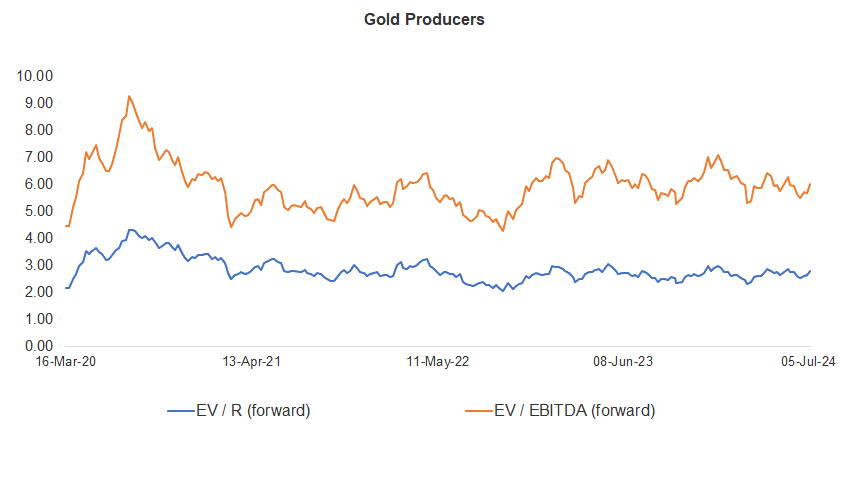
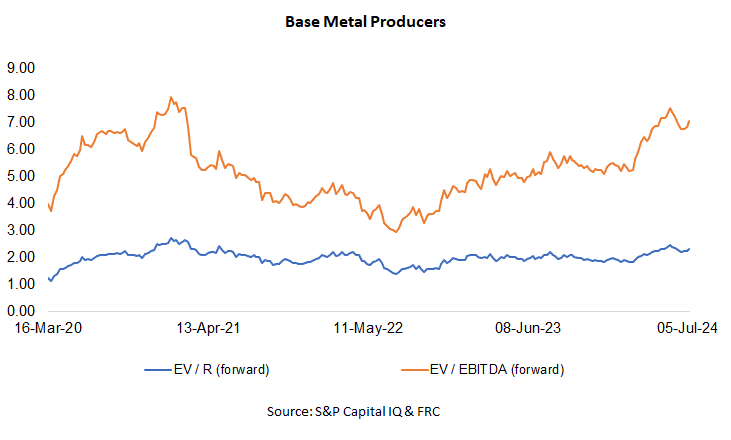
Gold producer valuations were up 5.6% last week (down 0.2% in the prior week); base metal producers were up 2.8% last week (up 0.9% in the prior week). On average, gold producer valuations are 17% lower (previously 21%) than the past three instances when gold surpassed US$2k/oz.
| 02-Jul-24 | 08-Jul-24 | ||||
| Gold Producers | EV / R (forward) | EV / EBITDA (forward) | EV / R (forward) | EV / EBITDA (forward) | |
| 1 | Barrick | 2.98 | 6.24 | 3.09 | 6.45 |
| 2 | Newmont | 3.12 | 7.10 | 3.30 | 7.51 |
| 3 | Agnico Eagle | 4.34 | 7.97 | 4.66 | 8.54 |
| 4 | AngloGold | 2.22 | 5.12 | 2.51 | 5.82 |
| 5 | Kinross Gold | 2.57 | 5.70 | 2.61 | 5.78 |
| 6 | Gold Fields | 2.70 | 4.97 | 2.78 | 5.14 |
| 7 | Sibanye | 0.63 | 3.45 | 0.70 | 3.86 |
| 8 | Hecla Mining | 4.21 | 12.93 | 4.54 | 13.94 |
| 9 | B2Gold | 1.60 | 3.14 | 1.67 | 3.27 |
| 10 | Alamos | 4.63 | 8.83 | 4.91 | 9.17 |
| 11 | Harmony | 1.72 | 5.25 | 1.76 | 5.27 |
| 12 | Eldorado Gold | 2.33 | 4.71 | 2.50 | 5.12 |
| Average (excl outliers) | 2.62 | 5.68 | 2.77 | 5.99 | |
| Min | 0.63 | 3.14 | 0.70 | 3.27 | |
| Max | 4.63 | 12.93 | 4.91 | 13.94 | |
| Base Metal Producers | EV / R (forward) | EV / EBITDA (forward) | EV / R (forward) | EV / EBITDA (forward) | |
| 1 | BHP Group | 2.94 | 5.65 | 2.99 | 5.75 |
| 2 | Rio Tinto | 2.20 | 4.67 | 2.22 | 4.73 |
| 3 | South32 | 1.62 | 7.37 | 1.63 | 7.38 |
| 4 | Glencore | 0.44 | 5.80 | 0.46 | 6.02 |
| 5 | Anglo American | 1.86 | 5.50 | 1.92 | 5.65 |
| 6 | Teck Resources | 2.89 | 6.67 | 2.97 | 7.00 |
| 7 | First Quantum | 3.76 | 12.28 | 3.93 | 12.80 |
| Average (excl outliers) | 2.24 | 6.85 | 2.30 | 7.05 | |
| Min | 0.44 | 4.67 | 0.46 | 4.73 | |
| Max | 3.76 | 12.28 | 3.93 | 12.80 | |
Source: S&P Capital IQ & FRC
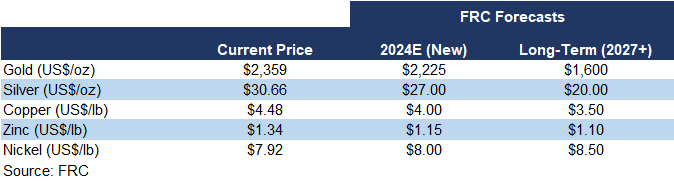
We are maintaining our metal price forecasts.
Key Developments:
- The Canadian government has announced a stricter stance on foreign takeovers of domestic mining companies, stating that they will now only approve critical minerals operations in "the most exceptional circumstances." We see this development as a setback for Canadian miners and exploration/development companies, potentially constraining their financing and M&A opportunities, ultimately resulting in lower valuations.
Market Updates and Insights: Cryptos
Prices of mainstream/popular cryptos were down 9% on average last week (up 3% in the previous week).
| July 8, 2024 | ||
| Cryptos | WoW | YoY |
| Bitcoin | -6% | 86% |
| Binance Coin | -9% | 114% |
| Cardano | -10% | 26% |
| Ethereum | -9% | 61% |
| Polkadot | -6% | 17% |
| XRP | -10% | -9% |
| Polygon | -13% | -27% |
| Solana | -7% | 533% |
| Average | -9% | 100% |
| Min | -13% | -27% |
| Max | -6% | 533% |
| Indices | ||
| Canadian | WoW | YoY |
| BTCC | -10% | 73% |
| BTCX | -11% | 86% |
| EBIT | -11% | 84% |
| FBTC | -10% | 20% |
| U.S. | WoW | YoY |
| BITO | -11% | 19% |
| BTF | -11% | 44% |
| IBLC | 3% | 52% |
Source: FRC/Yahoo Finance
The global MCAP of cryptos is US$2.21T, down 18% MoM, but up 81%YoY.
Total Crypto Market Cap Chart
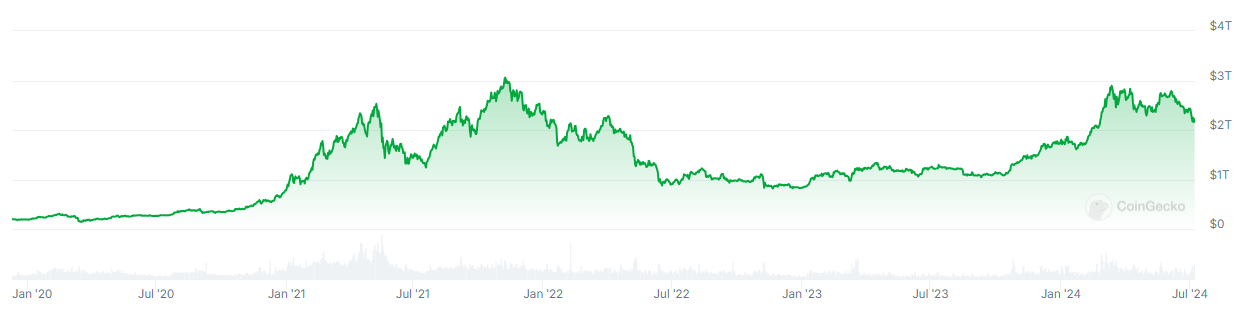
Source: CoinGecko
Last week, BTC was down 6.4%, while the S&P 500 was up 1.1%. The U.S. 10-year treasury yield was down 0.21 pp.
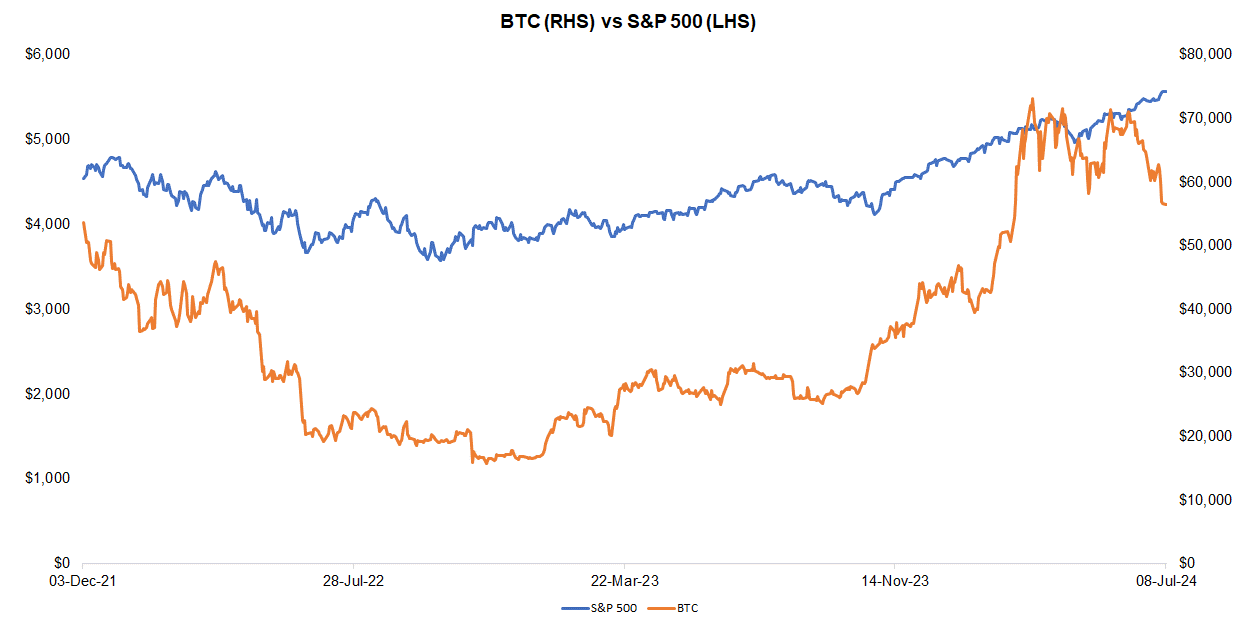
Source: FRC/ Yahoo Finance
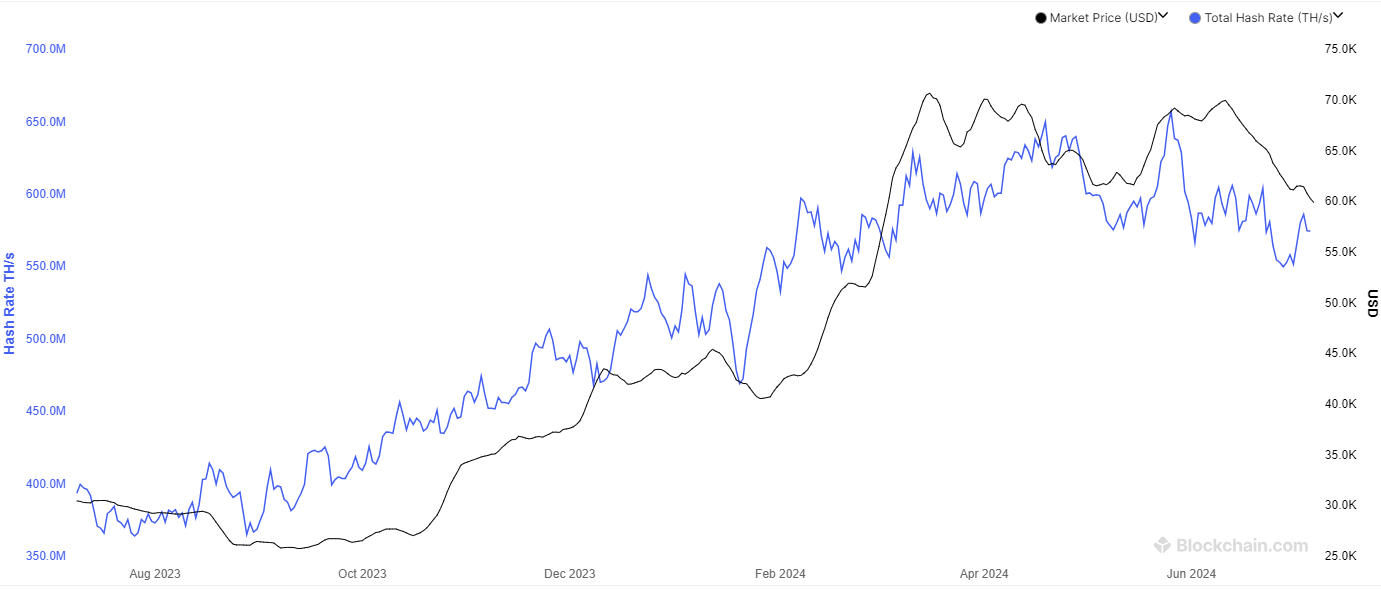
The global hash rate of BTC (defined as calculations performed per second/an indicator of network difficulty) is 575 exahashes per second (EH/s), up 3% WoW, but down 5% MoM. The increase in hash rates is negative for miners as their efficiency rates (BTC production per EH/s) are inversely linked to global hash rates.
Total Hash Rate (BTC)
The Realized HODL ratio (RHODL), which gauges the activity of short-term holders relative to long-term holders, was up 5% WoW, and 399% YoY. We interpret the increase in RHODL as a sign of strengthening demand, suggesting potential for an uptick in near-term prices. Historically, BTC prices have moved in tandem with this ratio. By tracking RHODL, we believe we can identify potential turning points in BTC prices.
Source: FRC/ Various
Companies operating in the crypto space are trading at an average EV/R of 6.1x (previously 6.4x).
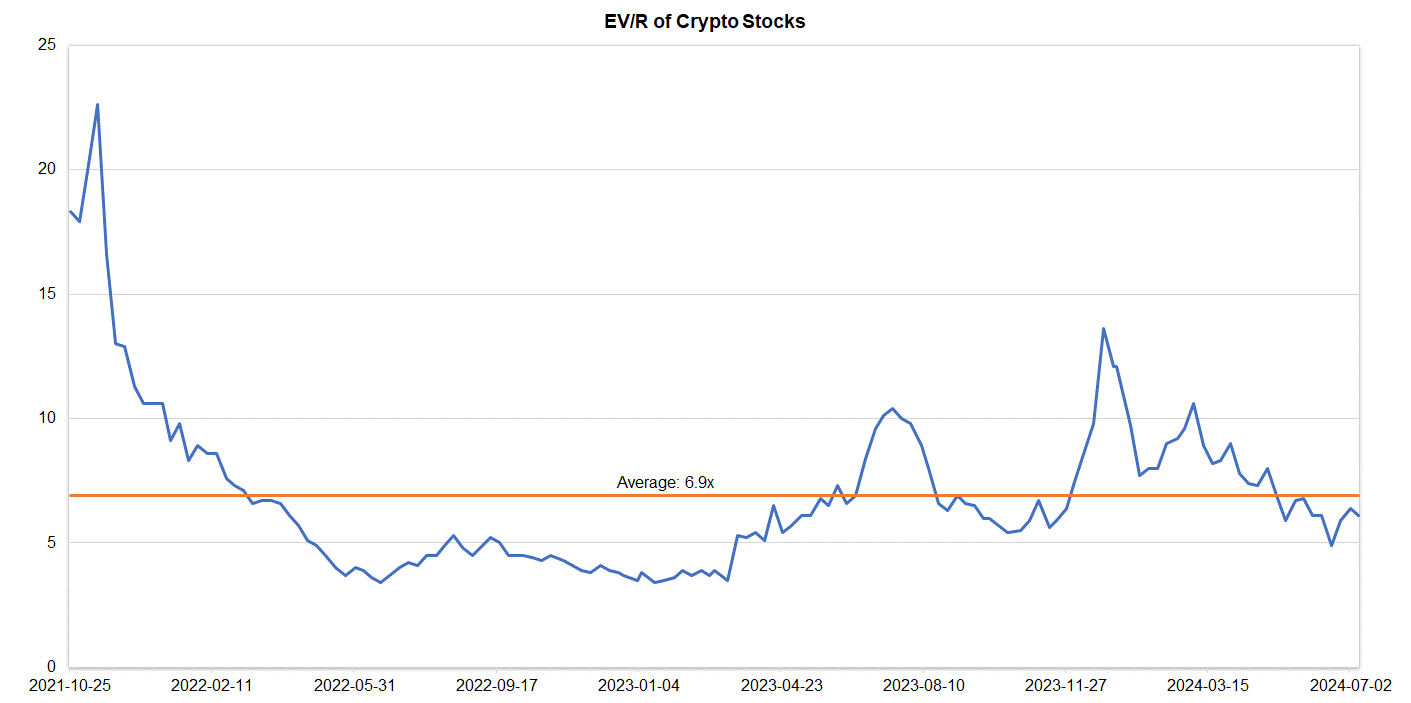
Source: S&P Capital IQ/FRC
| July 8, 2024 | ||
| Cryptos | WoW | YoY |
| Bitcoin | -6% | 86% |
| Binance Coin | -9% | 114% |
| Cardano | -10% | 26% |
| Ethereum | -9% | 61% |
| Polkadot | -6% | 17% |
| XRP | -10% | -9% |
| Polygon | -13% | -27% |
| Solana | -7% | 533% |
| Average | -9% | 100% |
| Min | -13% | -27% |
| Max | -6% | 533% |
| Indices | ||
| Canadian | WoW | YoY |
| BTCC | -10% | 73% |
| BTCX | -11% | 86% |
| EBIT | -11% | 84% |
| FBTC | -10% | 20% |
| U.S. | WoW | YoY |
| BITO | -11% | 19% |
| BTF | -11% | 44% |
| IBLC | 3% | 52% |
Source: S&P Capital IQ/FRC
Market Updates and Insights: Artificial Intelligence/AI
Major AI indices are up 2% WoW on average (up 1% in the previous week), and 15% YoY.
| July 8, 2024 | ||
| AI Indices | WoW | YoY |
| First Trust Nasdaq AI and Robotics ETF | 1.7% | -5% |
| Global X Robotics & AI ETF | 1.6% | 10% |
| Global X AI & Technology ETF | 2.5% | 32% |
| iShares Robotics and AI Multisector ETF | -0.1% | 2% |
| Roundhill Generative AI & Technology ETF | 3.7% | 35% |
| Average | 1.9% | 15% |
| Min | -0.1% | -5% |
| Max | 3.7% | 35% |
Source: FRC/Various
The following table highlights some of the most popular large-cap AI stocks. Shares of these companies are up 5% WoW on average, and 120% YoY. Their average P/E is 43.3x (previously 41.7x) vs the NASDAQ-100 Index’s average of 32.4x (previously 32.1x).
| AI Stocks | WoW | YoY | P/E |
| Arista Networks | 5.0% | 133% | 50.9 |
| Dell Technologies | 6.9% | 167% | 28.4 |
| Microsoft Corporation | 3.7% | 40% | 45.5 |
| NVIDIA Corp | 3.7% | 128% | 73.5 |
| Micron Technology | 0.1% | 107% | n/a |
| Palantir Technologies | 5.6% | 109% | n/a |
| Qualcomm | 3.77% | 77% | 27.4 |
| Super Micro Computer (SMCI) | 8.9% | 235% | 47.0 |
| Taiwan Semiconductor Manufacturing | 7.0% | 83% | 30.4 |
| Average | 5.0% | 120% | 43.3 |
| Median | 5.0% | 109% | 45.5 |
| Min | 0.1% | 40% | 27.4 |
| Max | 8.9% | 235% | 73.5 |
Source: FRC/Various
Key Developments:
-
With AI driving increased power demand for data centers, nuclear power companies are experiencing a surge in investor sentiment. This is evidenced by the significant rise in stock prices for firms like Constellation Energy (NASDAQ: CEG, up 84% YTD) and Vistra (NYSE: VST, up 141% YTD). Reports indicate ongoing discussions between U.S. nuclear plants and tech giants to ensure reliable electricity supply for AI-powered data centers. We believe this trend is highly beneficial for uranium miners and explorers.