S&P 500 Defies Downturn in Global Indices / Lithium Stock Soars / AI Market Insights
Published: 6/17/2024
Author: FRC Analysts

Key Highlights
- Last week, global equity markets were down 1.0% on average (up 0.1% in the previous week). However, the S&P 500 bucked the trend, rising 1.7% thanks to cooling inflation data.
- Policy meetings for both the Bank of England and the Reserve Bank of Australia are on the agenda this week
- Shares of a lithium junior under coverage doubled last week
- Introducing a new weekly feature: Market Updates and Insights - Artificial Intelligence/AI
- The Realized HODL ratio (RHODL) of Bitcoin decreased last week, suggesting potential for a downtick in near-term BTC prices
Noram Lithium Corp. (NRVTF, NRM.V)
PR Title: Announces an updated resource estimate for the Zeus project (Nevada)
Analyst Opinion: Positive – NRM has identified a high-grade zone averaging 1,121 ppm Li, which is significantly higher than comparable deposits. Detailed engineering studies are underway for this high-grade resource, aimed at potentially reducing the project’s OPEX. We will produce a detailed update report shortly.
Contango Ore, Inc. (CTGO)
PR Title: Announces a US$15M equity financing
Analyst Opinion: Positive – Kinross Gold (NYSE: KGC/70%) and Contango (30%), are on track to commence production at their Manh Choh project in Q3-2024. The previously announced acquisition of HighGold Mining (TSXV: HIGH) is scheduled to close next month. HIGH is advancing the Johnson Tract (JT) project, which is an ultra high-grade gold project in coastal Alaska, with resources totaling 1.1 Moz AuEq at 9.4 gpt. Proceeds from the current financing will be used to explore the Lucky Shot project, and the new JT project.
West High Yield (W.H.Y.) Resources Ltd. (WHYRF, WHY.V)
PR Title: Signs a letter of intent to construct and operate the Record Ridge mine in B.C.
Analyst Opinion: Positive – WHY has engaged a consulting/engineering company, in partnership with the local First Nations group, to plan the construction and operation of the Record Ridge mine. While construction and development activities are contingent upon receiving approvals, we consider this a major milestone for the company. Record Ridge hosts a large/high-grade magnesium deposit.
StrategX Elements Corp. (STGX.CN)
PR Title: Announces a $4.5M private placement
Analyst Opinion: Positive – Proceeds will be used to fund drilling at its flagship Nagvaak project (pre-resource stage) in Nunavut. This property features seven targets, with potential for hosting nickel, vanadium, cobalt, silver, PGE, and graphite.
Blue Sky Uranium Corp. (BSK.V, BKUCF)
PR Title: Launches exploration programs at two newly acquired uranium projects in Argentina
Analyst Opinion: Positive – The company has gained control over two early-stage uranium projects in Argentina. Earlier this month, BSK brought in a partner to fully fund and advance its advanced-stage Ivana uranium project, also in Argentina. This strategic deal allows BSK to allocate all of its resources and focus on the new projects.
FRC Top Picks
The following table shows last week’s top five performers among our Top Picks, including four junior resource companies, and a technology company. The top performer, Noram Lithium, was up 105%, driven by a promising resource update last week.
| Top 5 Weekly Performers | WoW Returns |
| Noram Lithium Corp. (NRM.V) | 105.0% |
| Fortune Minerals Limited (FT.TO) | 12.5% |
| Starcore International Mines Ltd. (SAM.TO) | 8.0% |
| Lumina Gold Corp. (LUM.V) | 3.6% |
| Zepp Health Corporation (ZEPP) | 2.0% |
| * Past performance is not indicative of future performance (as of June 17, 2024) |
Source: FRC
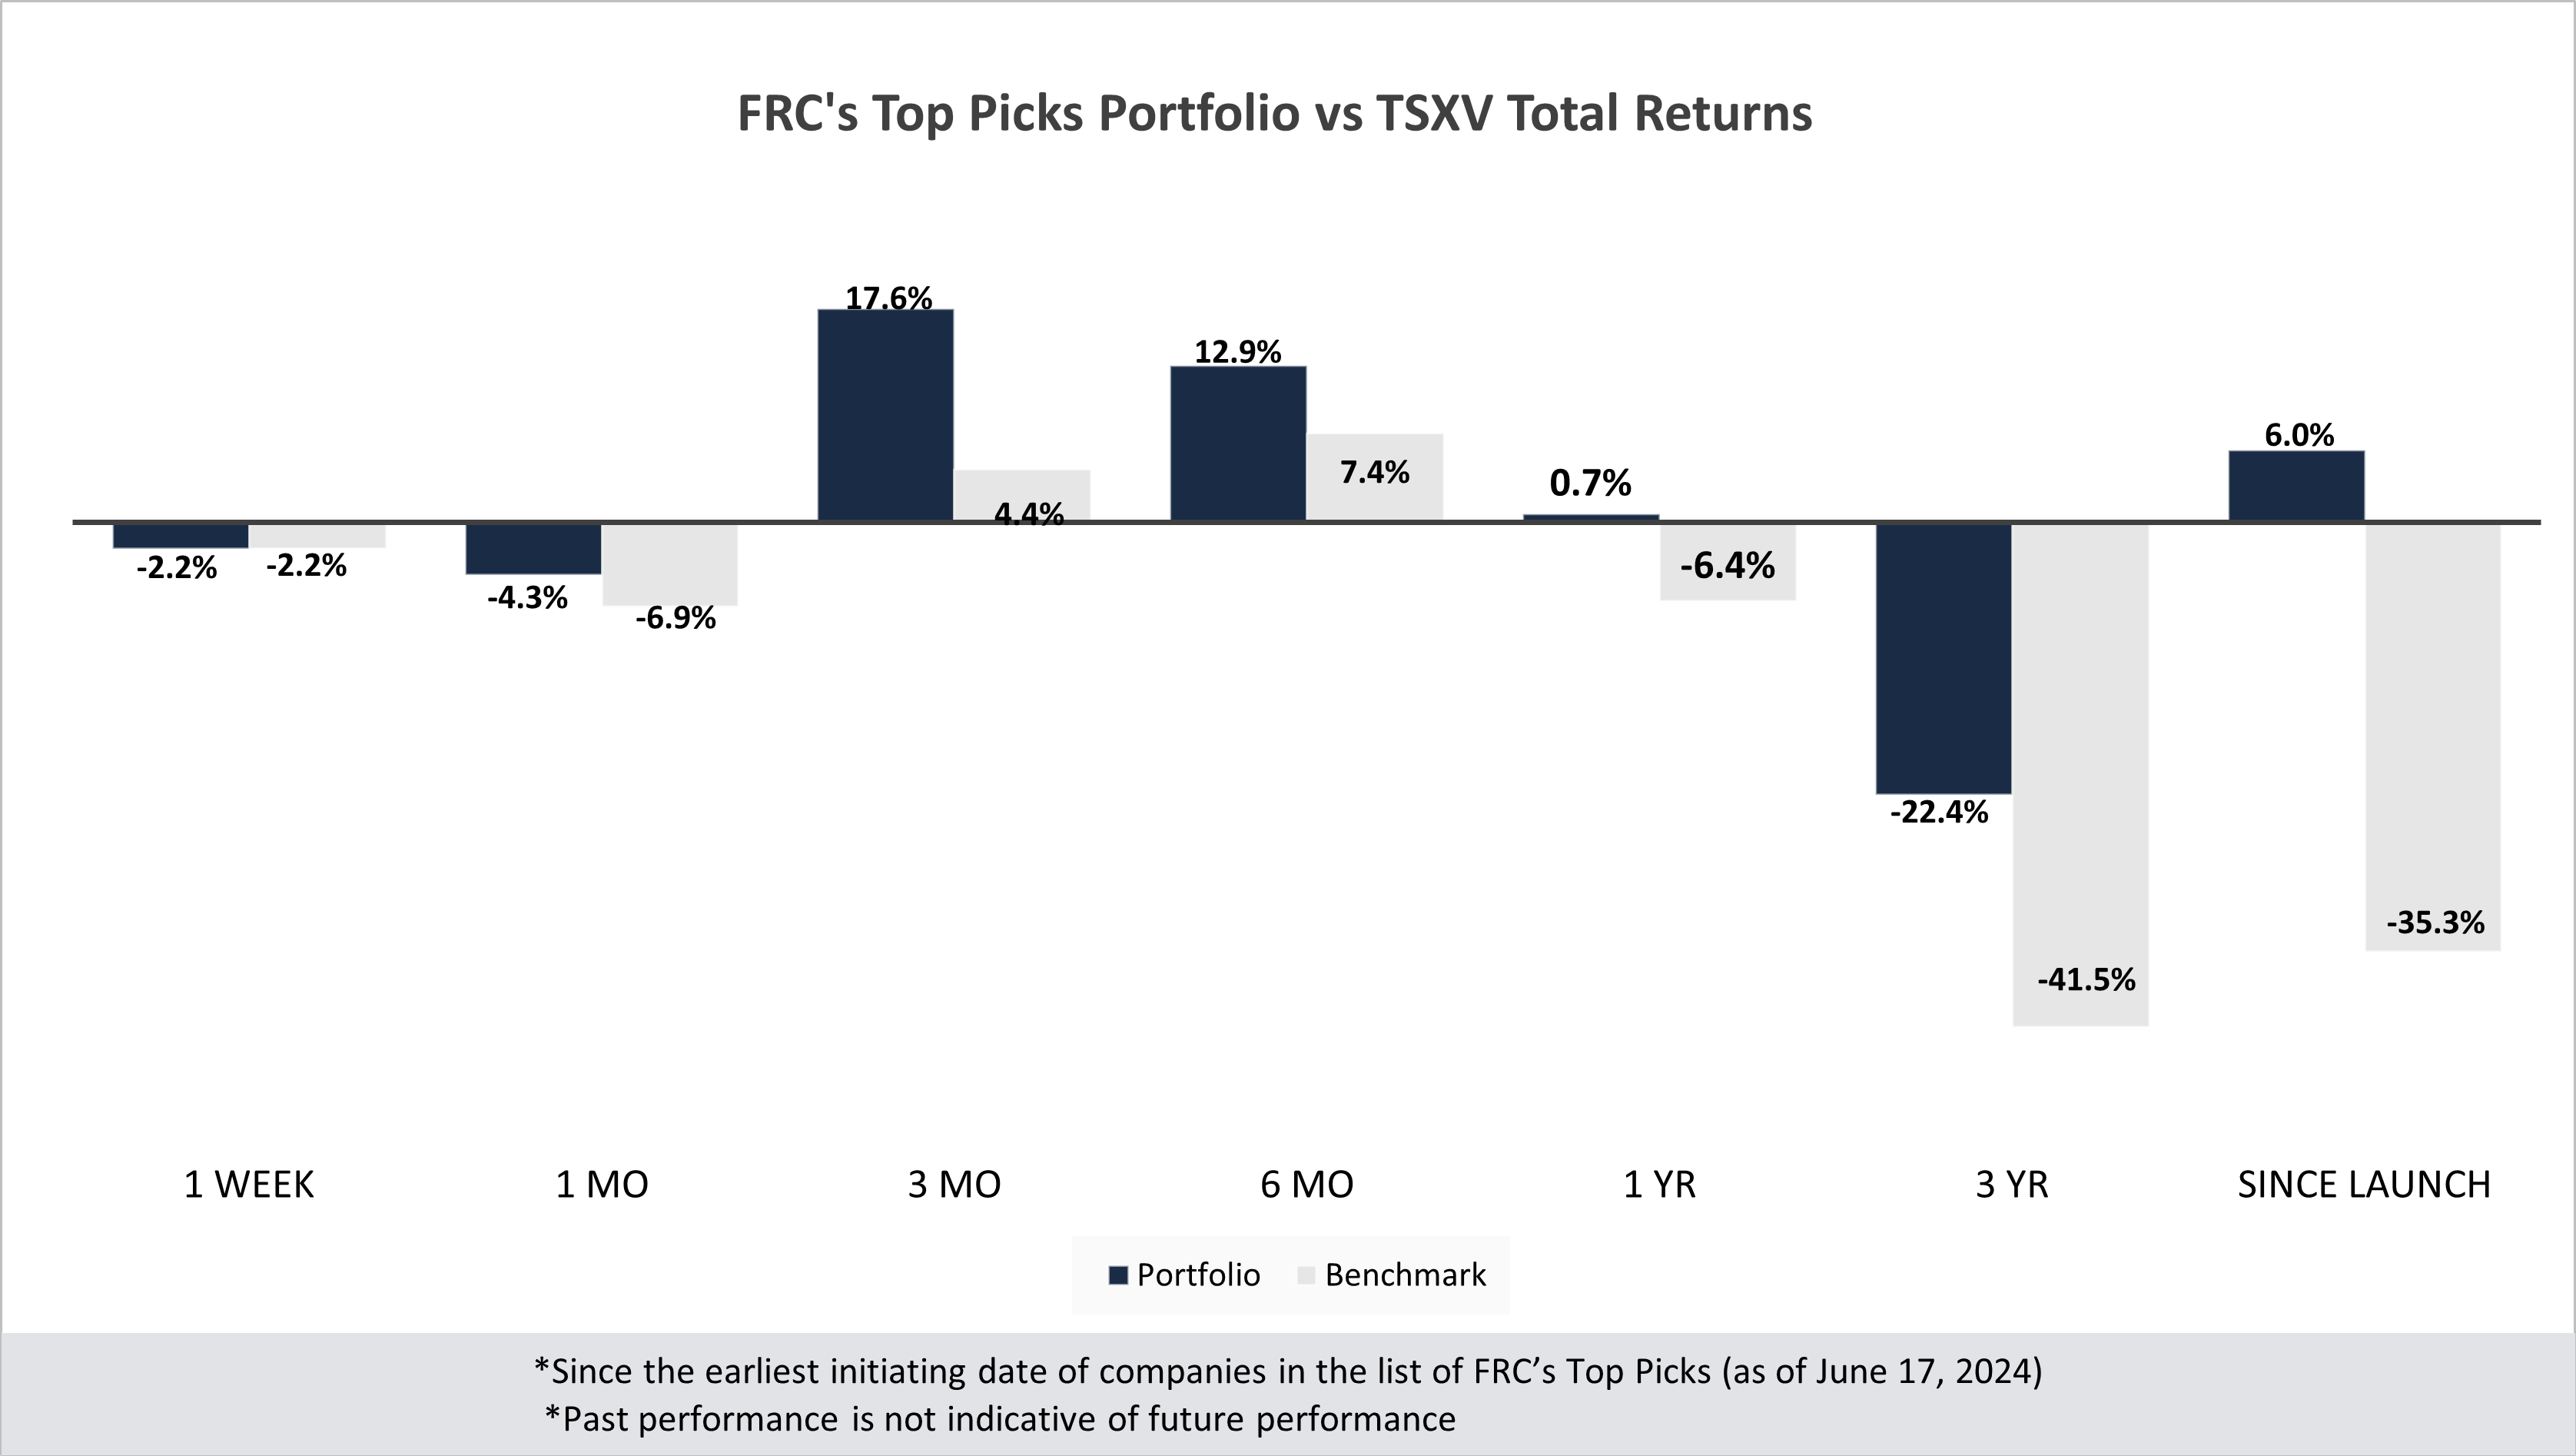
Last month, companies on our Top Picks list were down 4.3% on average vs -6.9% for the benchmark (TSXV). Our top picks have outperformed the benchmark in six out of seven time periods listed below.
Performance by Sector
| Total Return | 1 Week | 1 mo | 3 mo | 6 mo | 1 yr | 3 yr | Since launch |
| Mining | -0.4% | -4.9% | 24.8% | 17.5% | -3.7% | -38.8% | 9.4% |
| Cannabis | N/A | N/A | N/A | N/A | N/A | -42.0% | -23.6% |
| Tech | -12.0% | -14.0% | 13.0% | 20.0% | -25.0% | -33.7% | -4.4% |
| Special Situations (MIC) | -9.0% | 4.5% | -0.2% | 8.0% | 20.2% | -27.1% | -10.6% |
| Private Companies | N/A | N/A | N/A | N/A | 6.7% | 20.5% | 30.5% |
| Portfolio (Total) | -2.2% | -4.3% | 17.6% | 12.9% | 0.7% | -22.4% | 6.0% |
| Benchmark (Total) | -2.2% | -6.9% | 4.4% | 7.4% | -6.4% | -41.5% | -35.3% |
| Portfolio (Annualized) | - | - | - | - | 0.7% | -8.1% | 0.6% |
| Benchmark (Annualized) | - | - | - | - | -6.4% | -16.4% | -4.1% |
1. Since the earliest initiating date of companies in the list of Top Picks (as of June 17, 2024) 2. Green (blue) indicates FRC's picks outperformed (underperformed) the benchmark. 3. Past performance is not indicative of future performance. 4. Our complete list of top picks (updated weekly) can be viewed here: Top Picks List
Market Updates and Insights: Mining
Last week, global equity markets were down 1.0% on average (up 0.1% in the previous week). However, the S&P 500 bucked the trend, rising 1.7% thanks to cooling inflation data. This week, both the Bank of England and the Reserve Bank of Australia have policy meetings scheduled. While markets anticipate no changes in interest rates, we believe dovish remarks from either central bank could buoy equity markets.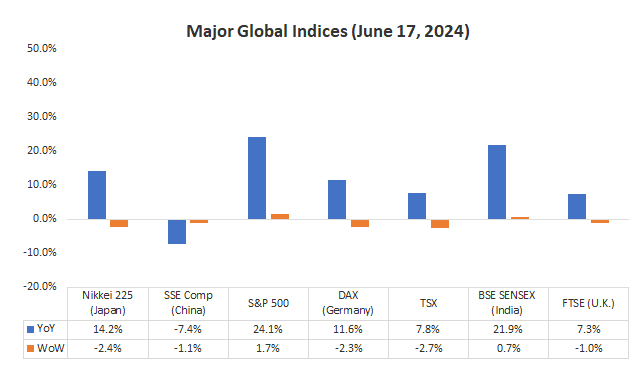
Source: FRC / Various
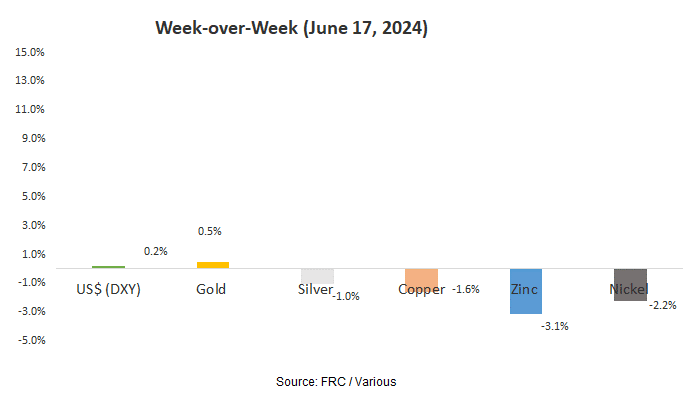
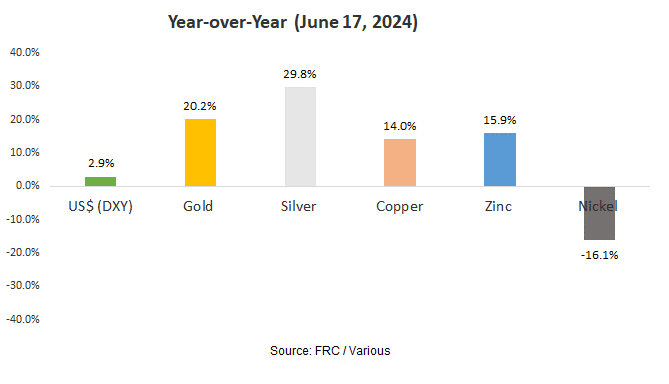
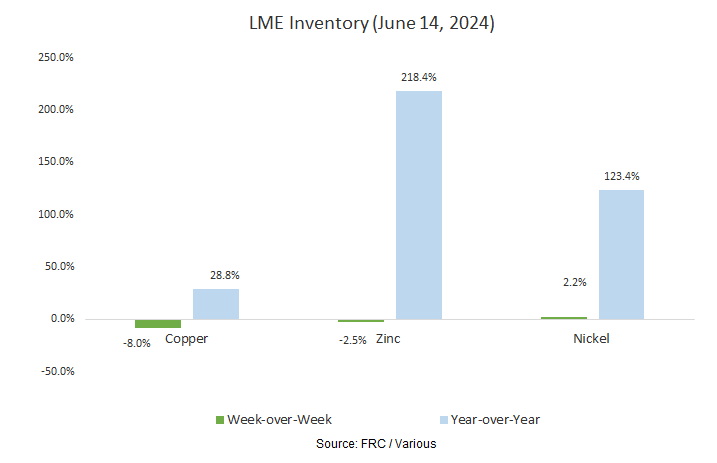
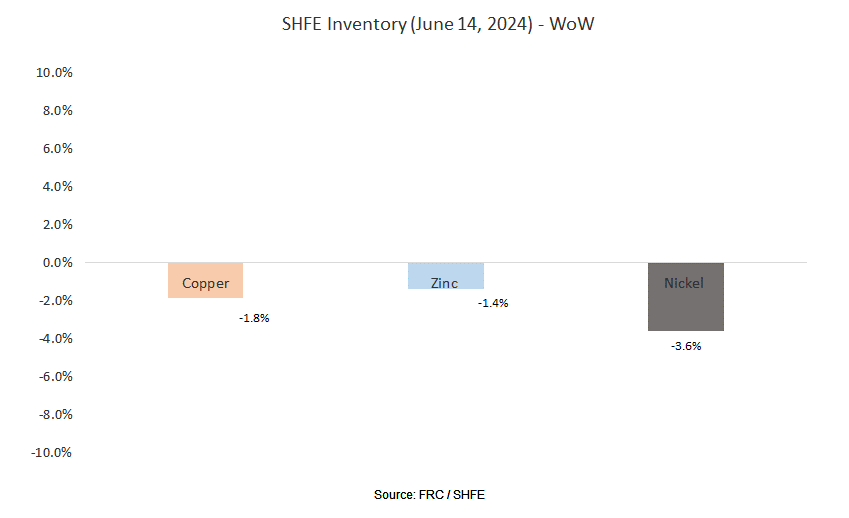
Last week, metal prices were down 1.5% on average (down 3.7% in the previous week).
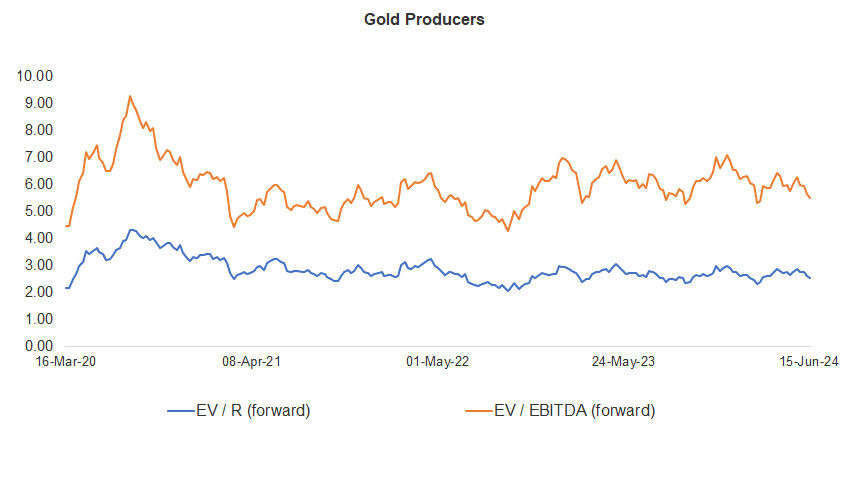
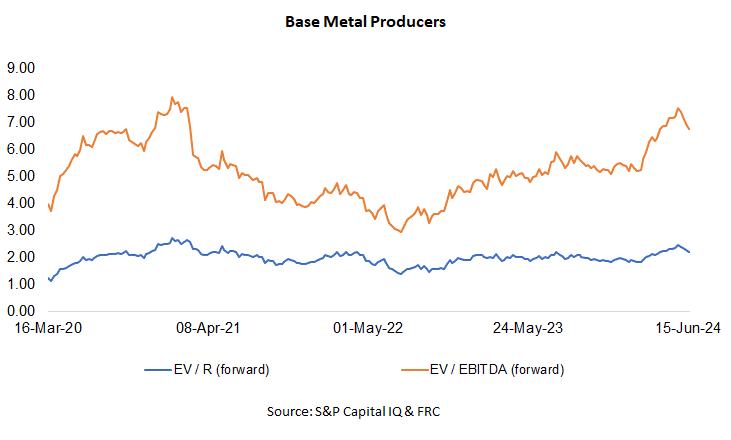
Gold producer valuations were down 2.4% last week (down 5.2% in the prior week); base metal producers were down 2.9% last week (down 3.4% in the prior week). On average, gold producer valuations are 23% lower (previously 22%) than the past three instances when gold surpassed US$2k/oz.
| 10-Jun-24 | 17-Jun-24 | ||||
| Gold Producers | EV / R (forward) | EV / EBITDA (forward) | EV / R (forward) | EV / EBITDA (forward) | |
| 1 | Barrick | 2.95 | 6.21 | 2.91 | 6.12 |
| 2 | Newmont | 3.09 | 7.14 | 3.11 | 7.18 |
| 3 | Agnico Eagle | 4.27 | 8.02 | 4.31 | 8.09 |
| 4 | AngloGold | 2.08 | 4.75 | 2.09 | 4.78 |
| 5 | Kinross Gold | 2.35 | 5.24 | 2.35 | 5.24 |
| 6 | Gold Fields | 2.83 | 5.06 | 2.40 | 4.30 |
| 7 | Sibanye | 0.70 | 3.74 | 0.67 | 3.58 |
| 8 | Hecla Mining | 4.63 | 14.35 | 4.53 | 14.03 |
| 9 | B2Gold | 1.56 | 3.05 | 1.55 | 3.06 |
| 10 | Alamos | 4.74 | 9.05 | 4.52 | 8.63 |
| 11 | Harmony | 1.61 | 4.80 | 1.57 | 4.79 |
| 12 | Eldorado Gold | 2.39 | 4.92 | 2.34 | 4.82 |
| Average (excl outliers) | 2.60 | 5.63 | 2.53 | 5.51 | |
| Min | 0.70 | 3.05 | 0.67 | 3.06 | |
| Max | 4.74 | 14.35 | 4.53 | 14.03 | |
| Industry (three year average) | 110.70 | 116.70 | 110.70 | 116.70 | |
| Base Metal Producers | EV / R (forward) | EV / EBITDA (forward) | EV / R (forward) | EV / EBITDA (forward) | |
| 1 | BHP Group | 2.99 | 5.76 | 2.88 | 5.56 |
| 2 | Rio Tinto | 2.27 | 4.83 | 2.18 | 4.62 |
| 3 | South32 | 1.66 | 7.68 | 1.57 | 7.28 |
| 4 | Glencore | 0.46 | 5.99 | 0.44 | 5.77 |
| 5 | Anglo American | 1.88 | 5.56 | 1.86 | 5.49 |
| 6 | Teck Resources | 2.97 | 6.83 | 2.90 | 6.69 |
| 7 | First Quantum | 3.70 | 12.04 | 3.64 | 11.85 |
| Average (excl outliers) | 2.28 | 6.96 | 2.21 | 6.75 | |
| Min | 0.46 | 4.83 | 0.44 | 4.62 | |
| Max | 3.70 | 12.04 | 3.64 | 11.85 | |
Source: S&P Capital IQ & FRC
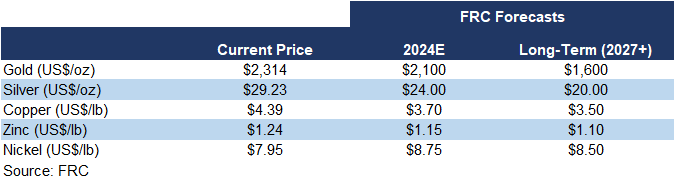
We are maintaining our metal price forecasts.
Market Updates and Insights: Cryptos
Prices of mainstream/popular cryptos were down 3% on average last week (down 5% in the previous week).
| June 17, 2024 | ||
| Cryptos | WoW | YoY |
| Bitcoin | -2% | 152% |
| Binance Coin | -2% | 149% |
| Cardano | -4% | 57% |
| Ethereum | 0% | 106% |
| Polkadot | -4% | 39% |
| XRP | 5% | 8% |
| Polygon | -8% | -3% |
| Solana | -10% | 826% |
| Average | -3% | 167% |
| Min | -10% | -3% |
| Max | 5% | 826% |
| Indices | ||
| Canadian | WoW | YoY |
| BTCC | -1% | 142% |
| BTCX | -1% | 157% |
| EBIT | 0% | 156% |
| FBTC | -1% | 43% |
| U.S. | WoW | YoY |
| BITO | -1% | 60% |
| BTF | -1% | 86% |
| IBLC | 14% | 83% |
Source: FRC/Yahoo Finance
The global MCAP of cryptos is US$2.52T, down 1% MoM, but up 127%YoY.
Total Crypto Market Cap Chart
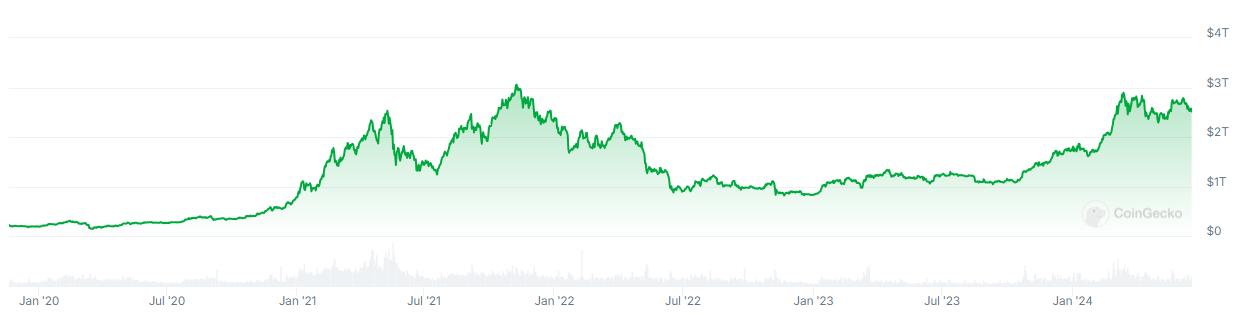
Source: CoinGecko
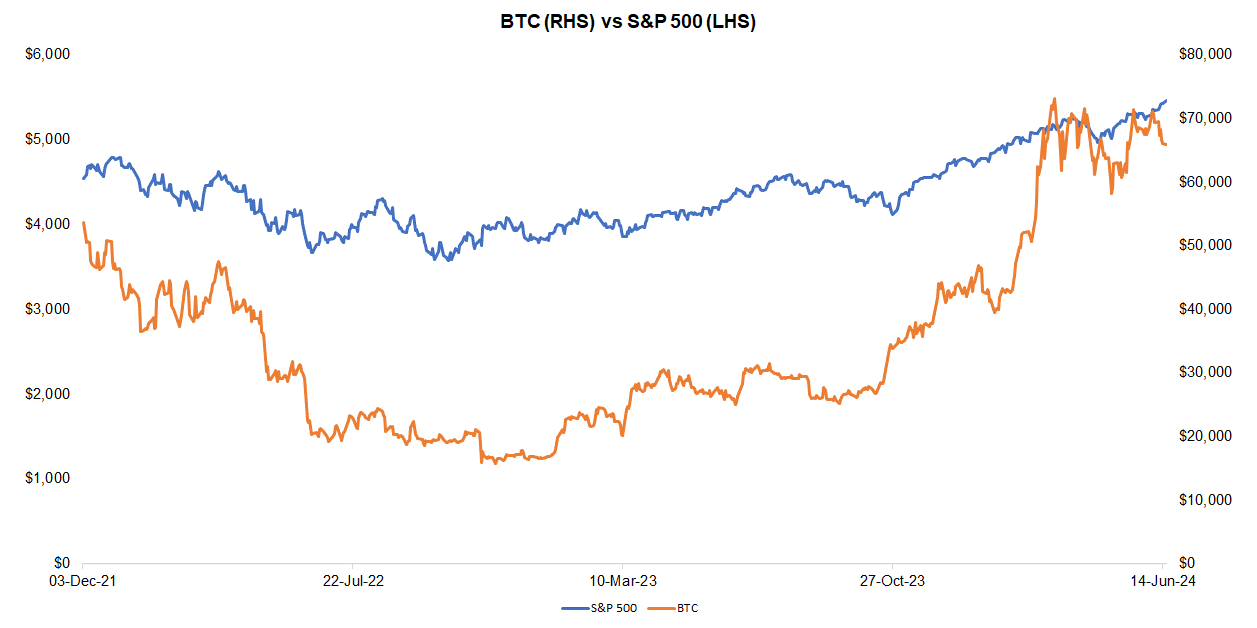
Last week, BTC was down 2.1%, while the S&P 500 was up 1.7%. The U.S. 10-year treasury yield was down 4.4%.
Source: FRC/ Yahoo Finance
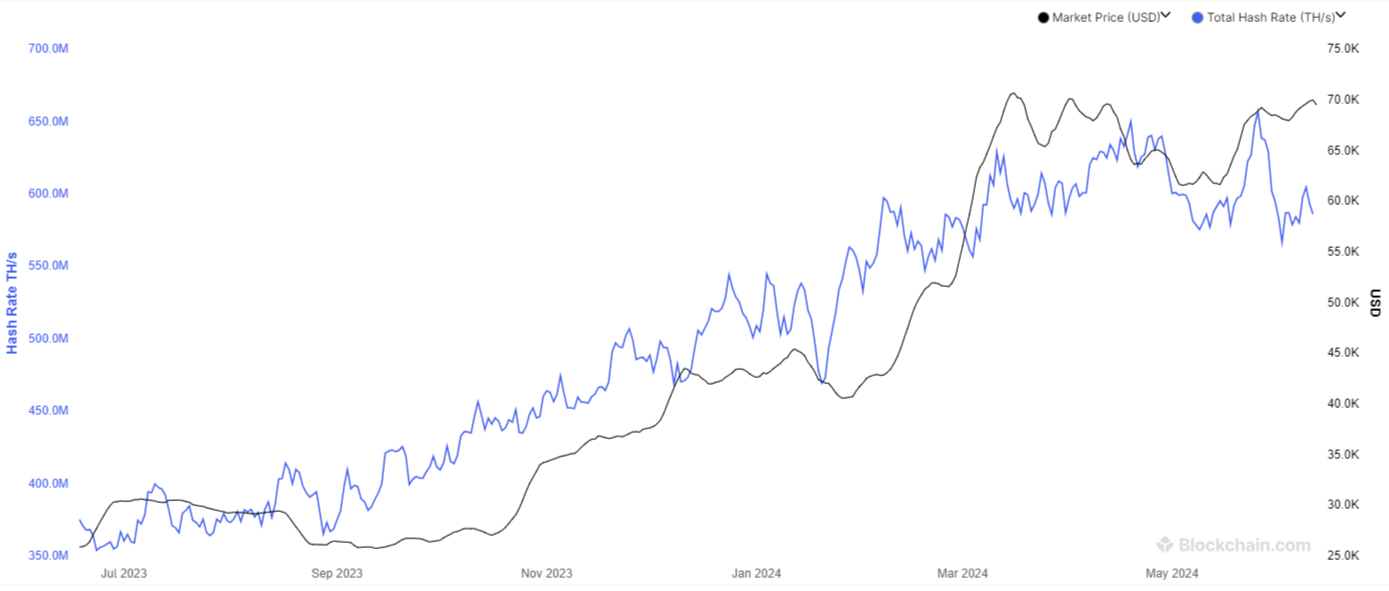
The global hash rate of BTC (defined as calculations performed per second/an indicator of network difficulty) is 650 exahashes per second (EH/s), up 9% WoW, and 9% MoM. The increase in hash rates is negative for miners as their efficiency rates (BTC production per EH/s) are inversely linked to global hash rates.
Total Hash Rate (BTC)
The Realized HODL ratio (RHODL), which gauges the activity of short-term holders relative to long-term holders, was down 25% WoW, but up 460% YoY. We interpret the decrease in RHODL as a sign of weakening demand, suggesting potential for a downtick in near-term prices. Historically, BTC prices have moved in tandem with this ratio. By tracking RHODL, we believe we can identify potential turning points in BTC prices.
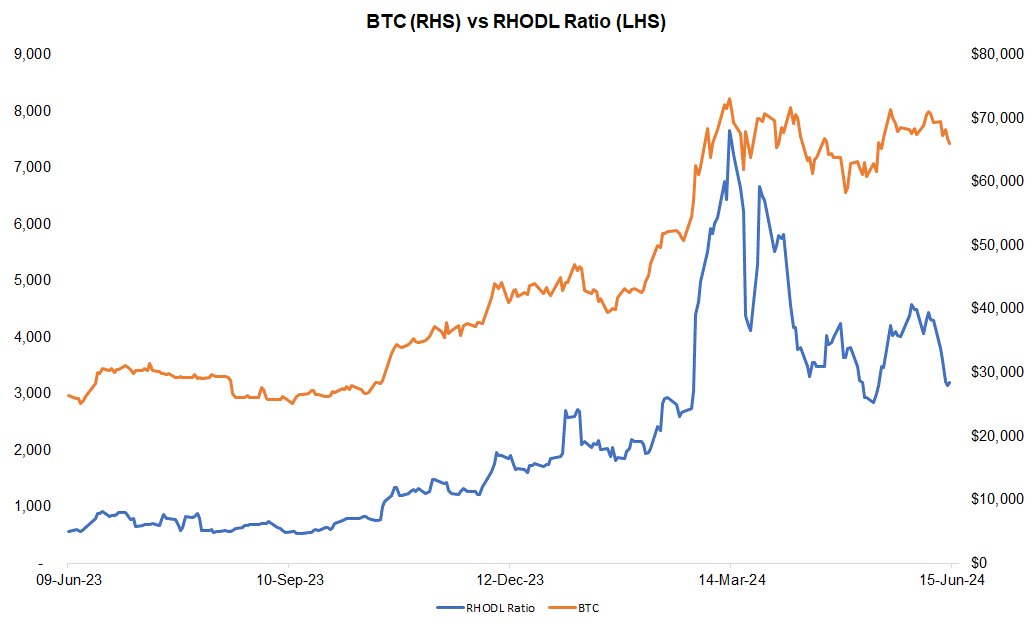
Source: FRC/ Various
Companies operating in the crypto space are trading at an average EV/R of 4.9x (previously 6.1x).
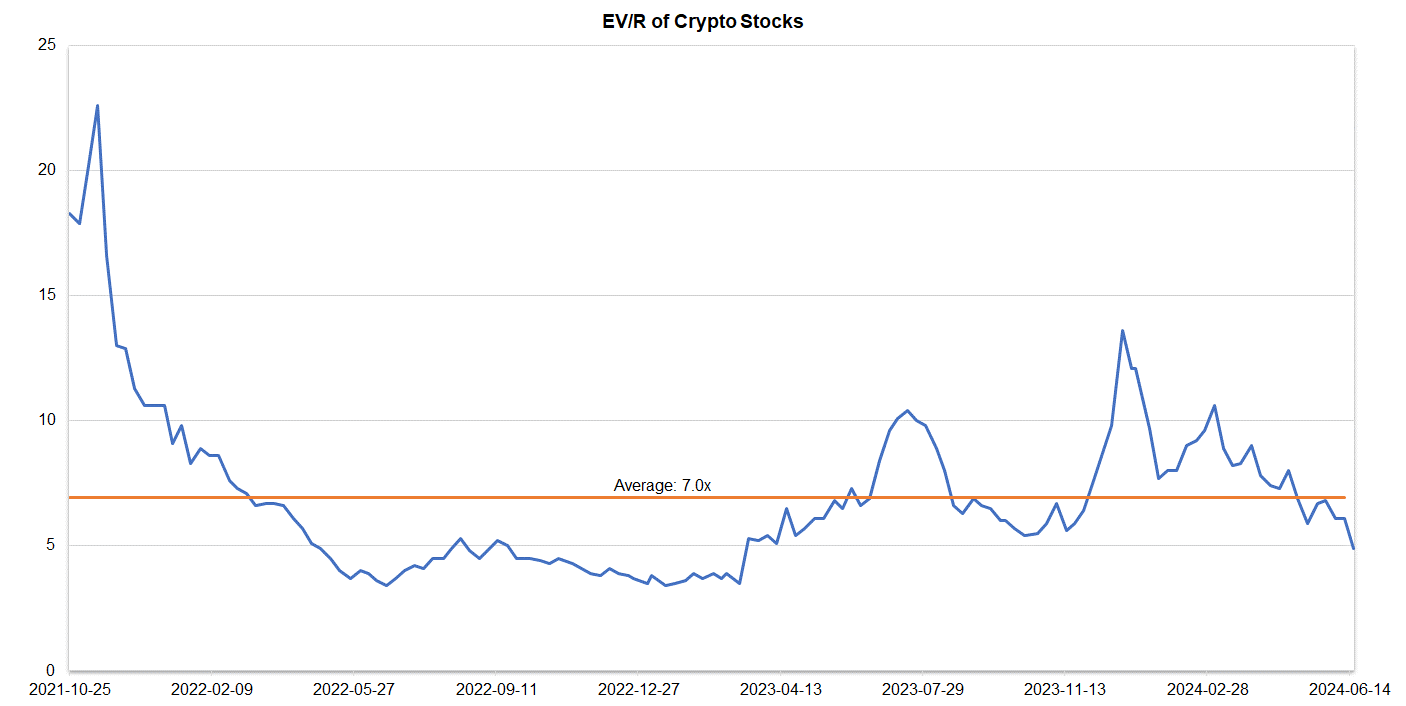
Source: S&P Capital IQ/FRC
| June 17, 2024 | |
| Crypto Stocks | EV/Revenue |
| Argo Blockchain | 2.0 |
| BIGG Digital | 4.4 |
| Bitcoin Well | 0.9 |
| Canaan Inc. | 1.1 |
| CleanSpark Inc. | 9.1 |
| Coinbase Global | 10.3 |
| Galaxy Digital Holdings | N/A |
| HIVE Digital | 3.0 |
| Hut 8 Mining Corp. | 8.2 |
| Marathon Digital Holdings | 7.8 |
| Riot Platforms | 5.7 |
| SATO Technologies | 2.0 |
| Average | 4.9 |
| Median | 4.4 |
| Min | 0.9 |
| Max | 10.3 |
Source: S&P Capital IQ/FRC
Market Updates and Insights: Artificial Intelligence/AI
In response to the increasing interest in AI stocks, we are pleased to introduce our new weekly feature. Starting this week, we will provide weekly updates and insightful commentary on the latest trends, movements, and news in the AI market.
Major AI indices are up 2% WoW on average, and 14% YoY.
| June 17, 2024 | ||
| AI Indices | WoW | YoY |
| First Trust Nasdaq AI and Robotics ETF | 0% | 8% |
| Global X Robotics & AI ETF | 1% | 7% |
| Global X AI & Technology ETF | 4% | 27% |
| iShares Robotics and AI Multisector ETF | 1% | 1% |
| Roundhill Generative AI & Technology ETF | 4% | 25% |
| Average | 2% | 14% |
| Min | 0% | 1% |
| Max | 4% | 27% |
Source: FRC/Various
The following table highlights some of the most popular large-cap AI stocks. Shares of these companies are up 0.3% WoW on average, and 108% YoY. Their average EV/R is 10.4x. Going forward, should there be any materials advancements in the sector, we will cover them to ensure you remain well-informed.
| June 17, 2024 | |||
| AI Stocks | WoW | YoY | EV/Revenue |
| AeroVironment Inc. | 5% | 126% | 8.4 |
| Celestica (CLS) | 6% | 286% | 0.8 |
| Helix Energy Solutions Group Inc | -3% | 53% | 1.5 |
| Intuitive Surgical Inc | 3% | 31% | 18.2 |
| NVIDIA Corp | -1% | 199% | 26.8 |
| Pegasystems Inc. | -1% | 12% | 3.4 |
| Procept BioRobotics Corp | -9% | 77% | 19.9 |
| SoundHound AI Inc | -9% | 8% | 19.0 |
| STMicroelectronics (STM) | -1% | -12% | 2.5 |
| Super Micro Computer (SMCI) | 14% | 299% | 3.3 |
| Average | 0.3% | 108% | 10.4 |
| Median | -1% | 65% | 5.9 |
| Min | -9% | -12% | 0.8 |
| Max | 14% | 299% | 26.8 |
Source: FRC/Various


