
We reiterate our BUY rating, and adjust our fair value estimate from $8.03 to $8.47/share (the average of our DCF and comparables valuations). Despite near-term sentiment and valuation pressures across the AI infrastructure sector, record backlog, a growing share of higher-margin proprietary projects, and upgraded guidance strengthen NRGV’s growth outlook.

Record Backlog, Upbeat Guidance Amid AI Sector Turbulence
Paused · 10:44 left · FRC · read by an AI voice
Disclosure: Energy Vault Holdings, Inc. has paid FRC a fee for research coverage and distribution of reports. This fee creates a potential conflict of interest which readers should consider. See last page for other important disclosures, rating, and risk definitions.
All figures in US$ unless otherwise specified.
Price and Volume (1-year)
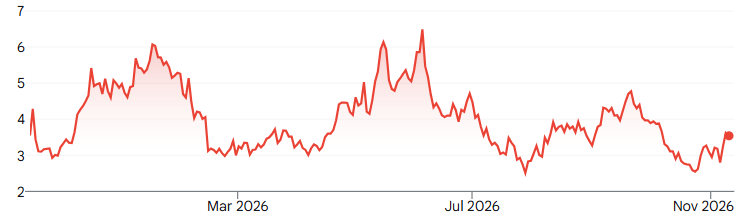
| YTD | 12M | |
|---|---|---|
| NRGV | -27% | 14% |
| NYSE | 10% | 14% |
| ZAP* | 9% | 6% |
| Key Financial Data (YE - Dec 31st) | |||||||
|---|---|---|---|---|---|---|---|
| US$, 000s except EPS | 2025 | Q1-2026 | Q2-2026 | Q3-2026 | Q4-2026E | 2026E | 2027E |
| Revenue | $203,671 | $21,879 | $17,369 | $13,069 | $245,783 | $298,100 | $628,302 |
| EBITDA (Adj.) | -$21,232 | -$13,576 | -$17,044 | -$14,696 | $21,644 | -$23,672 | $39,744 |
| Net Income (Adj.) | -$53,834 | -$20,021 | -$24,627 | -$25,596 | $8,938 | -$62,162 | -$8,397 |
| EPS (Adj.) | -$0.34 | -$0.12 | -$0.14 | -$0.14 | $0.05 | -$0.34 | -$0.05 |
NRGV manages 1,448 MW of assets (1,066 MW at the end of Q2), with 66 MW operational, and the remainder expected online within two to three years. Management projects ~$210M in annual EBITDA at full operation, with a long-term target of $1.8B+ from a ~4.8 GW portfolio by 2030. We view the expansion into digital infrastructure as a significant growth opportunity, supported by accelerating AI adoption, rising cloud workloads, and increasing power demand.
| Management Guidance | Projected Economics (FRC Est.) | |||||
|---|---|---|---|---|---|---|
| Project | Location / Customer | Output | Status | Summary | ||
| Asset Vault - Owned & Operated | ||||||
| 1 | Calistoga - Hydrogen | Calistoga, CA / PG&E | 8.5 MW / 293 MWh | Completed Aug 2025 | Hybrid system of hydrogen fuel cells and batteries providing 48 hours of backup power for the community during blackouts (10-year offtake) | ~ $8M in EBITDA ($0.12 per W) |
| 2 | Cross Trails | Snyder, Texas | 57 MW / 114 MWh | Completed May 2025 | A battery system supporting Texas grid and renewables. Has a 10-year offtake agreement with Gridmatic for energy sales. | |
| 3 | Stoney Creek | NSW, Australia | 125 MW / 1 GWh | Pre-Construction Phase (Target Start: 2027) | Large eight-hour battery system for grid stability and renewable integration. Secured a 14-year long-term energy services agreement (LTESA) with AusEnergy Services. | ~$20M in EBITDA ($0.16 per W or $0.02 per Wh) |
| 4 | SOSA Energy Center | Madison County, Texas | 150 MW / 300 MWh | Pre-Construction Phase (Target Start: 2027) | A battery system supporting Texas grid and renewables; a 6-8-year offtake agreement under negotiation | ~$12M in EBITDA ($0.08 per W) |
| 5 | Snyder AI + Offtakes | Texas / APAC | 8 MW + 100 MW | Expected completion (Snyder AI: H1 2027) | Lifetime revenue potential (offtakes): $0.5B | ~$27M in EBITDA ($0.25 per W) |
| 6 | Controlled or Ready to Build | AMER / APAC | 1,000 MW | - | Lifetime revenue potential: $3.6B | ~$128M in EBITDA ($0.13 per W) |
| 7 | Service Agreeements | Global | - | - | Lifetime revenue potential: $0.1B | ~$15M in EBITDA |
| Total | 1,448 MW | ~$210M | ||||
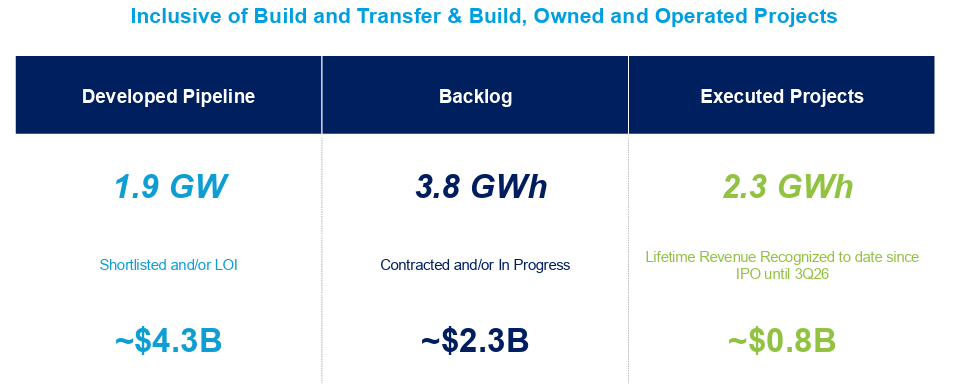
In Q3, contracted backlog rose to $2.30B (Q2: $2.00B), with ~64% attributable to internal projects, and the remainder to third-party deployments. In addition, management expects the pipeline to exceed $3B by year-end.
Q3 revenue, largely driven by third-party deployments, declined 61% YoY, coming in 9% below our estimate. Quarterly revenue is difficult to forecast given the variability in project completion timelines.
| $, 000s / YE - Dec 31st | 2025 (6M) | 2026 (6M) | YoY | Q3-2025 | Q3-2026 | YoY | 2025 (9M) | 2026 (9M) | YoY |
|---|---|---|---|---|---|---|---|---|---|
| Revenue | $17,046 | $39,248 | 130% | $33,319 | $13,069 | -61% | $50,365 | $52,317 | 4% |
| Cost of Revenue | $9,654 | $29,084 | 201% | $24,309 | $3,794 | -84% | $33,963 | $32,878 | -3% |
| Gross Profit | $7,392 | $10,164 | 38% | $9,010 | $9,275 | 3% | $16,402 | $19,439 | 19% |
| EBITDA | -$48,263 | -$44,718 | N/A | -$17,285 | -$22,930 | N/A | -$65,548 | -$67,648 | N/A |
| EBITDA (Adj.)* | -$24,967 | -$30,620 | N/A | -$6,026 | -$14,696 | N/A | -$30,995 | -$45,316 | N/A |
| Net Income (Loss) | -$56,063 | -$62,177 | N/A | -$26,817 | -$28,162 | N/A | -$82,880 | -$90,339 | N/A |
| Net Income (Adj.)* | -$30,185 | -$44,648 | N/A | -$15,623 | -$25,596 | N/A | -$45,810 | -$74,839 | N/A |
| EPS | -$0.36 | -$0.37 | N/A | -$0.16 | -$0.17 | N/A | -$0.52 | -$0.55 | N/A |
| EPS (Adj.)* | -$0.19 | -$0.26 | N/A | -$0.10 | -$0.14 | N/A | -$0.29 | -$0.42 | N/A |
We view the Q3 shortfall as timing-related, with higher full-year revenue guidance reinforcing our positive outlook. Operating expenses increased 64% YoY, coming in 8% above our estimate. Consequently, adjusted EPS declined from ($0.10) to ($0.14), reflecting lower revenue and higher operating expenses, missing our ($0.12) estimate.
| Margins | 2025 (6M) | 2026 (6M) | Q3-2025 | Q3-2026 | 2025 (9M) | 2026 (9M) | Sector |
|---|---|---|---|---|---|---|---|
| Gross | 43.4% | 25.9% | 27.0% | 71.0% | 32.6% | 37.2% | 18.8% |
| EBITDA | -283.1% | -113.9% | -51.9% | -175.5% | -130.1% | -129.3% | |
| EBITDA (Adj.) | -146.5% | -78.0% | -18.1% | -112.4% | -61.5% | -86.6% | |
| EBIT | -287.7% | -124.5% | -52.8% | -188.1% | -132.3% | -140.4% | 14.4% |
| Net | -328.9% | -158.4% | -80.5% | -215.5% | -164.6% | -172.7% | 11.5% |
| Net (Adj.) | -177.1% | -113.8% | -46.9% | -195.9% | -91.0% | -143.0% |
| Expense % of Revenue | 2025 (6M) | 2026 (6M) | Q3-2025 | Q3-2026 | 2025 (9M) | 2026 (9M) |
|---|---|---|---|---|---|---|
| Sales and Marketing | 30.6% | 11.3% | 6.8% | 17.6% | 14.9% | 12.8% |
| R&D | 53.5% | 12.5% | 8.4% | 24.0% | 21.2% | 13.9% |
| G&A | 240.1% | 121.4% | 49.0% | 615.9% | 103.3% | 178.5% |
| Stock Compensation | 107.1% | 29.1% | 30.5% | 42.8% | 56.4% | 32.5% |
| Provision for Credit Losses | 22.5% | 0.2% | -0.2% | 0.3% | 7.4% | 0.2% |
| Total (excl. SBC) | 346.7% | 145.4% | 64.0% | 657.8% | 146.8% | 205.4% |
Cash increased 60% QoQ to $236M, supported by additional debt financing for pipeline projects.
| Summary of Cash Flows | ||||
|---|---|---|---|---|
| $, 000s / YE - Dec 31st | 2024 (9M) | 2025 (9M) | 2026 (9M) | YoY |
| Funds Flow from Operations | -$40,966 | -$48,521 | -$54,603 | 13% |
| Cash Flow From Operations | -$21,040 | $921 | $69,786 | N/A |
| Cash Flow From Investing | -$48,085 | -$32,792 | -$89,859 | 174% |
| Cash Flow From Financing | $565 | $63,429 | $151,314 | 139% |
| Net Change in Cash | -$67,871 | $31,855 | $132,773 | 317% |
| Free Cash Flows | -$69,125 | -$29,729 | -$20,073 | -32% |
Debt-to-capital remains elevated, reflecting a relatively low equity base following several years of losses. Management does not anticipate any new capital raises in Q4.
| Liquidity Analysis | ||||||
|---|---|---|---|---|---|---|
| US$M / YE Dec 31st | 2024 | 2025 | Q1-2026 | Q2-2026 | Q3-2026 | Sector |
| Cash And Equivalents | $32,065 | $103,443 | $117,127 | $148,021 | $236,216 | |
| Working Capital | $14,250 | -$43,947 | $82,303 | $70,019 | $26,169 | |
| Current Ratio | 1.3 | 0.7 | 2.3 | 1.5 | 1.1 | 1.3 |
| Debt/Capital | 0.0% | 51.6% | 76.1% | 88.2% | 94.6% | 44.0% |
| LT Debt/Capital | 0.0% | 20.6% | 71.2% | 59.9% | 71.1% | 24.0% |
We are raising our 2026/27 revenue estimates, reflecting higher management guidance, and an expanded backlog.
| $, 000s | 2026E (Old) | 2026E (New) | 2027E (Old) | 2027E (New) |
|---|---|---|---|---|
| Revenue | $288,100 | $298,100 | $498,302 | $628,302 |
| Adj. EBITDA | -$18,770 | -$23,672 | $24,786 | $39,744 |
| Adj. Net Loss | -$60,771 | -$62,162 | -$16,395 | -$8,397 |
| Adj. EPS | -$0.33 | -$0.34 | -$0.09 | -$0.05 |
Q4 is expected to be the largest revenue quarter in the company’s history. We are lowering our 2026 EPS estimate to reflect higher operating expenses, while raising 2027+ estimates on stronger backlog visibility. Additionally, we anticipate the first full year of positive EBITDA in 2027.
| FRC Projections | 2027E | 2028E | 2029E | 2030E |
|---|---|---|---|---|
| 1 EPC (Third-Party Deployments)¹ | $570,000 | $575,700 | $581,457 | $587,272 |
| 2 Asset Vault | ||||
| Installed MW (Capacity) | 341 | 966 | 1,166 | 1,366 |
| Tolling Revenue | $30,450 | $97,950 | $159,825 | $189,825 |
| 3 Modular AI Data Centers (Crusoe) | ||||
| Installed MW (Capacity) | 25 | 50 | 100 | 150 |
| Revenue (NRGV's Share) | $8,789 | $23,438 | $46,875 | $70,313 |
| 4 Powered Land | ||||
| Installed MW (Capacity) | 100 | 200 | 300 | 600 |
| Revenue | $19,063 | $152,500 | $228,750 | $457,500 |
| Total Revenue | $628,302 | $849,588 | $1,016,907 | $1,304,909 |
| Gross Profit² | $137,711 | $316,979 | $447,208 | $673,946 |
| GM % | 22% | 37% | 44% | 52% |
| CAPEX | -$575,000 | -$415,250 | -$446,500 | -$946,500 |
| Profit - AV Installations (15% of CAPEX) | $86,250 | $62,288 | $66,975 | $141,975 |
As a result, our DCF valuation increased from $8.43 to $8.65/share.
| DCF Model (US$, 000s) | Q4-2026E | 2027E | 2028E | 2029E | 2034E | Terminal |
|---|---|---|---|---|---|---|
| Net Income + Others | $25,125 | $57,368 | $172,263 | $223,643 | $870,830 | |
| Non-Cash Expenses | -$5,131 | $24,727 | $51,878 | $72,144 | $252,769 | |
| Change in Working Capital | -$142,534 | $80,790 | $25,124 | -$8 | -$24,278 | |
| Cash from Operations | -$122,540 | $162,885 | $249,266 | $295,779 | $1,099,321 | |
| CAPEX & Others | $58,109 | -$300,000 | -$250,250 | -$489,350 | -$812,500 | |
| Free Cash Flow | -$64,431 | -$137,115 | -$984 | -$193,571 | $286,821 | |
| Present Value | -$61,785 | -$114,335 | -$714 | -$122,050 | $89,912 | $749,270 |
| Discount Rate | 15.0% |
|---|---|
| Terminal Growth | 3.0% |
| Present Value (US$, 000s) | $1,616,407 |
| Cash - Debt (US$, 000s) | -$44,295 |
| Fair Value (US$, 000s) | $1,572,112 |
| Shares O/S (1000s) | 181,840 |
| Value per Share (US$) | $8.65 |
Consensus 2026 revenue growth forecasts for comparables have declined from 13% to 9% on average since our last report, while their share prices are down 29% YTD on average, reflecting a more pessimistic sector outlook. NRGV trades at 11.5x EBITDA (previously 12.6x) vs. a comparables average of 14.7x (previously 15.0x), a 23% discount. We arrive at a comparables valuation of $8.28/share (previously $7.63/share), given our higher long-term EBITDA forecasts, partially offset by lower sector multiples.
| EV ($M) | EV/EBITDA (f) | Gross Margin | 2025 Revenue Growth | 2026E Revenue Growth | ||
|---|---|---|---|---|---|---|
| 1 | XPLR Infrastructure, LP (NYSE:XIFR) | $13,680 | 7.58 | 56% | -3% | 9% |
| 2 | TeraWulf Inc. (NasdaqCM:WULF) | $9,865 | n/a | 69% | 20% | 43% |
| 3 | MARA Holdings, Inc. (NasdaqCM:MARA) | $4,802 | n/a | 33% | 38% | -20% |
| 4 | Allient Inc. (NasdaqGM:ALNT) | $1,636 | 17.31 | 34% | 5% | 11% |
| 5 | Eos Energy Enterprises, Inc. (NasdaqCM:EOSE) | $1,568 | n/a | n/a | n/a | n/a |
| 6 | Preformed Line Products Company (NasdaqGS:PLPC) | $1,354 | 11.78 | 32% | 13% | 21% |
| 7 | GrafTech International Ltd. (NYSE:EAF) | $1,352 | 22.07 | n/a | -6% | 3% |
| 8 | Hallador Energy Company (NasdaqCM:HNRG) | $925 | 21.79 | 15% | 16% | -2% |
| 9 | Fluence Energy, Inc. (NasdaqGS:FLNC) | $905 | n/a | 9% | -16% | 7% |
| 10 | Power Solutions International, Inc. (NasdaqCM:PSIX) | $898 | 7.80 | 26% | 52% | -5% |
| 11 | Ellomay Capital Ltd. (NYSEAM:ELLO) | $819 | 20.55 | 53% | 6% | n/a |
| 12 | Energy Vault Holdings, Inc. (NYSE:NRGV) | $702 | 11.45 | 26% | 341% | 46% |
| 13 | Montauk Renewables, Inc. (NasdaqCM:MNTK) | $540 | 9.48 | 35% | 0% | 21% |
| 14 | FuelCell Energy, Inc. (NasdaqGM:FCEL) | $441 | n/a | n/a | 41% | -6% |
| 15 | Stem, Inc. (NYSE:STEM) | $354 | 23.33 | 42% | 8% | -6% |
| Average | 14.74 | 36% | 17% | 9% | ||
| Fair Value of NRGV @ Average Metric | $8.28 | |||||
We reiterate our BUY rating, and adjust our fair value estimate from $8.03 to $8.47/share (the average of our DCF and comparables valuations). Despite near-term sentiment and valuation pressures across the AI infrastructure sector, record backlog, a growing share of higher-margin proprietary projects, and upgraded guidance strengthen NRGV’s growth outlook. Record Q4 revenue, and the expected transition to positive EBITDA in 2027, could serve as key catalysts for the stock.
While the company operates in a relatively low-risk market with potential for long-term steady cash flow, we believe its early-stage deployment of energy storage projects warrants a risk rating of 4 (Speculative).
We believe the company is exposed to the following key risks (not exhaustive):
| Income Statement | |||||||
|---|---|---|---|---|---|---|---|
| $, 000s / YE - Dec 31st | 2025 | Q1-2026 | Q2-2026 | Q3-2026 | Q4-2026E | 2026E | 2027E |
| Revenue | $203,671 | $21,879 | $17,369 | $13,069 | $245,783 | $298,100 | $628,302 |
| Cost of Revenue | $155,681 | $17,091 | $11,993 | $3,794 | $200,592 | $233,470 | $490,590 |
| Gross Profit | $47,990 | $4,788 | $5,376 | $9,275 | $45,191 | $64,630 | $137,711 |
| Sales and Marketing | $9,830 | $2,222 | $2,194 | $2,297 | $2,134 | $8,847 | $9,289 |
| R&D | $9,351 | $1,626 | $2,024 | $912 | $1,610 | $6,172 | $6,480 |
| G&A | $53,619 | $15,840 | $19,480 | $23,366 | $19,598 | $78,284 | $82,198 |
| Stock-Based Compensation (SBC) | $36,713 | $7,053 | $4,366 | $5,594 | $5,749 | $22,762 | $20,486 |
| Provision for Credit Losses | $9,409 | $25 | $52 | $36 | $5,849 | $5,962 | $21,991 |
| Total | $118,922 | $26,766 | $28,116 | $32,205 | $34,939 | $122,026 | $140,444 |
| EBITDA | -$70,932 | -$21,978 | -$22,740 | -$22,930 | $10,252 | -$57,396 | -$2,733 |
| EBITDA (Ad.)* | -$21,232 | -$13,576 | -$17,044 | -$14,696 | $21,644 | -$23,672 | $39,744 |
| D&A | $3,435 | $2,223 | $1,919 | $1,654 | $2,047 | $7,843 | $4,241 |
| EBIT | -$74,367 | -$24,201 | -$24,659 | -$24,584 | $8,205 | -$65,239 | -$6,974 |
| Interest | -$8,464 | -$3,466 | -$4,192 | -$5,017 | -$5,016 | -$17,691 | -$21,908 |
| Others | -$13,064 | -$4,817 | $14 | $2,577 | -$4,803 | ||
| EBT Incl. Unusual Items | -$95,895 | -$32,484 | -$28,837 | -$27,024 | $3,189 | -$87,733 | -$28,882 |
| Income Tax | -$7,763 | -$1 | -$855 | -$1,138 | -$1,994 | ||
| Non-Controlling | $47 | ||||||
| Net Income | -$103,611 | -$32,485 | -$29,692 | -$28,162 | $3,189 | -$89,727 | -$28,882 |
| Net Income (Adj.)* | -$53,834 | -$20,021 | -$24,627 | -$25,596 | $8,938 | -$62,162 | -$8,397 |
| EPS | -$0.65 | -$0.20 | -$0.17 | -$0.17 | $0.02 | -$0.49 | -$0.16 |
| EPS (Adj.)* | -$0.34 | -$0.12 | -$0.14 | -$0.14 | $0.05 | -$0.34 | -$0.05 |
| Balance Sheet | ||||
|---|---|---|---|---|
| $, 000s / YE - Dec 31st | 2024 | 2025 | 2026E | 2027E |
| ASSETS | ||||
| Cash And Equivalents | $30,073 | $103,443 | $186,498 | $149,383 |
| Inventory | $107 | $139 | $146 | $153 |
| Investments | - | - | - | - |
| A/R and Others | $40,717 | $57,954 | $86,931 | $138,226 |
| Total Current Assets | $70,897 | $161,536 | $273,575 | $287,762 |
| PPE and Others | $109,722 | $147,974 | $296,881 | $867,640 |
| Investments | $3,270 | $3,366 | $3,366 | $3,366 |
| Total Assets | $183,889 | $312,876 | $573,822 | $1,158,768 |
| LIABILITIES | ||||
| Debt | $56,628 | $77,978 | $77,978 | |
| A/P and Others | $54,655 | $108,389 | $119,228 | $251,321 |
| Total Current Liabilities | $54,655 | $165,017 | $197,206 | $329,299 |
| Debt | $37,790 | $185,000 | $285,000 | |
| Others | $2,978 | $21,453 | $21,453 | $21,453 |
| Total Liabilities | $57,633 | $224,260 | $403,659 | $635,752 |
| Share Capital and Others | $511,974 | $555,859 | $602,134 | $708,869 |
| Preferred | $21,156 | $48,695 | $229,538 | |
| Retained Earnings | -$385,718 | -$488,399 | -$480,665 | -$415,391 |
| Total Equity | $126,256 | $88,616 | $170,163 | $523,017 |
| Total Liabilities and Equity | $183,889 | $312,876 | $573,822 | $1,158,768 |
| Cash Flow | |||
|---|---|---|---|
| $, 000s / YE - Dec 31st | 2025 | 2026E | 2027E |
| Net Income | -$103,658 | -$89,727 | -$28,882 |
| Non-Cash Items | $67,297 | $30,605 | $24,727 |
| Changes in Working Capital | $30,712 | -$18,145 | $80,790 |
| Cash Flow From Operations | -$5,649 | -$77,268 | $76,635 |
| PPE | -$41,093 | -$156,750 | -$575,000 |
| Others | -$3,514 | ||
| Cash Flow From Investing | -$44,607 | -$156,750 | -$575,000 |
| Equity (Common) | $735 | ||
| Equity (Preferred) | $25,000 | $175,000 | |
| Distributions (Preferred) | |||
| ITC Financings | $100,000 | $100,000 | |
| Debt | $168,560 | $100,000 | |
| Others | $122,315 | $23,513 | $86,250 |
| Cash Flow From Financing | $123,050 | $317,073 | $461,250 |
The full report — the designed PDF with all charts and the complete disclosure — remains available as published, free of charge with a free account. This page is the same analysis in the form a search engine, an AI assistant and a phone screen can read.
Buy – Fair value is 12% above the current market price; or risk and reward is favorable
Hold – Fair value is between 5% to 12% above the current market price
Sell – Fair value is 5% above, or less, than the current market value; or risk and reward is unfavorable
Suspended or Rating N/A— Coverage and ratings suspended until more information can be obtained from the company regarding recent events.
1 (Low Risk) - The company operates in an industry where it has a strong position (for example a monopoly, high market share etc.) or operates in a regulated industry. The future outlook is stable or positive for the industry. The company generates positive free cash flow and has a history of profitability. The capital structure is conservative with little or no debt.
2 (Below Average Risk) - The company operates in an industry where the fundamentals and outlook are positive. The industry and company are relatively less sensitive to systematic risk than companies with a Risk Rating of 3. The company has a history of profitability and has demonstrated its ability to generate positive free cash flows (though current free cash flow may be negative due to capital investment). The company’s capital structure is conservative with little to modest use of debt.
3 (Average Risk) - The company operates in an industry that has average sensitivity to systematic risk. The industry may be cyclical. Profits and cash flow are sensitive to economic factors although the company has demonstrated its ability to generate positive earnings and cash flow. Debt use is in line with industry averages, and coverage ratios are sufficient.
4 (Speculative) - The company has little or no history of generating earnings or cash flow. Debt use is higher. These companies may be in start-up mode or in a turnaround situation. These companies should be considered speculative.
5 (Highly Speculative) - The company has no history of generating earnings or cash flow. They may operate in a new industry with new, and unproven products. Products may be at the development stage, testing, or seeking regulatory approval. These companies may run into liquidity issues and may rely on external funding. These stocks are considered highly speculative.
Definition of FRC’s Fair Value Estimate – Our fair value estimate is the theoretical value of the company’s equity using widely accepted methods of valuation such as discount cash flow or comparables. IT IS NOT A TARGET PRICE or PREDICTION OF THE FUTURE STOCK PRICE.
Analyst Certification: The views expressed in this report accurately reflect the personal views of the analyst, and no part of their compensation was, is, or will be directly or indirectly related to the specific recommendation or views expressed.
Any “forward looking statements” are our best estimates and opinions based upon information that is publicly available and that we believe to be correct, but we have not independently verified with respect to truth or correctness. There is no guarantee that our forecasts will materialize. Actual results will likely vary. The analyst and Fundamental Research Corp. “FRC” does not own any shares of the subject company, does not make a market or offer shares for sale of the subject company, and does not have any investment banking business with the subject company. Fees ranging between $25,000 and $35,000 have been paid to FRC by Energy Vault to commission this report, research coverage, and distribution of reports. This fee creates a potential conflict of interest which readers should consider. FRC takes steps to mitigate conflicts including setting fees in advance and utilizing analysts who must abide by CFA Institute Code of Ethics and Standards of Professional Conduct. Additionally, analysts may not trade in any security under coverage. Our full editorial control of all research, timing of release of the reports, and release of liability for negative reports are protected contractually. The issuer has agreed to a minimum coverage term and coverage cannot be unilaterally terminated. Distribution procedure: our reports are distributed first to our web-based subscribers on the date shown on this report then made available to delayed access users through various other channels for a limited time.
The distribution of FRC’s ratings are as follows: BUY (76%), HOLD (2%), SELL / SUSPEND (22%).
This report contains "forward looking" statements. Forward-looking statements regarding the Company and/or stock’s performance inherently involve risks and uncertainties that could cause actual results to differ from such forward-looking statements. Factors that would cause or contribute to such differences include, but are not limited to, continued acceptance of the Company's products/services in the marketplace; acceptance in the marketplace of the Company's new product lines/services; competitive factors; new product/service introductions by others; technological changes; dependence on suppliers; systematic market risks and other risks discussed in the Company's periodic report filings, including interim reports, annual reports, and annual information forms filed with the various securities regulators. By making these forward-looking statements, Fundamental Research Corp. and the analyst/author of this report undertakes no obligation to update these statements for revisions or changes after the date of this report. A report initiating coverage will most often be updated quarterly while a report issuing a rating may have no further or less frequent updates because the subject company is likely to be in earlier stages where nothing material may occur quarter to quarter.
Fundamental Research Corp DOES NOT MAKE ANY WARRANTIES, EXPRESSED OR IMPLIED, AS TO RESULTS TO BE OBTAINED FROM USING THIS INFORMATION AND MAKES NO EXPRESS OR IMPLIED WARRANTIES OR FITNESS FOR A PARTICULAR USE. ANYONE USING THIS REPORT ASSUMES FULL RESPONSIBILITY FOR WHATEVER RESULTS THEY OBTAIN FROM WHATEVER USE THE INFORMATION WAS PUT TO. ALWAYS TALK TO YOUR FINANCIAL ADVISOR BEFORE YOU INVEST. WHETHER A STOCK SHOULD BE INCLUDED IN A PORTFOLIO DEPENDS ON ONE’S RISK TOLERANCE, OBJECTIVES, SITUATION, RETURN ON OTHER ASSETS, ETC. ONLY YOUR INVESTMENT ADVISOR WHO KNOWS YOUR UNIQUE CIRCUMSTANCES CAN MAKE A PROPER RECOMMENDATION AS TO THE MERIT OF ANY PARTICULAR SECURITY FOR INCLUSION IN YOUR PORTFOLIO. This REPORT is solely for informative purposes and is not a solicitation or an offer to buy or sell any security. It is not intended as being a complete description of the company, industry, securities or developments referred to in the material. Any forecasts contained in this report were independently prepared unless otherwise stated and HAVE NOT BEEN endorsed by the Management of the company which is the subject of this report. Additional information is available upon request. THIS REPORT IS COPYRIGHT. YOU MAY NOT REDISTRIBUTE THIS REPORT WITHOUT OUR PERMISSION. Please give proper credit, including citing Fundamental Research Corp and/or the analyst, when quoting information from this report. The information contained in this report is intended to be viewed only in jurisdictions where it may be legally viewed and is not intended for use by any person or entity in any jurisdiction where such use would be contrary to local regulations or which would require any registration requirement within such jurisdiction.
Discussion
Comments reflect the views of individual users, not FRC. Nothing posted in the comments section — by users or otherwise — should be taken as investment advice.