
We are initiating coverage with a BUY rating, and a fair value estimate of $4.60/share, based on the average of our two valuation methodologies. We believe Cango offers an attractive, albeit high-risk, opportunity, combining an established Bitcoin mining business, with significant AI/HPC growth potential in a rapidly expanding market.

A Bitcoin Mining Leader with an AI Growth Catalyst
Paused · 24:57 left · FRC · read by an AI voice
Disclosure: Cango Inc. has paid FRC a fee for research coverage and distribution of reports. This fee creates a potential conflict of interest which readers should consider. See last page for other important disclosures, rating, and risk definitions.
All figures are in US$.
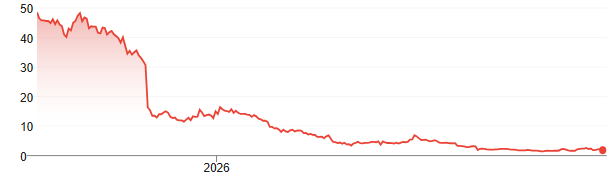
Price and Volume (1-year)
| YTD | 12M | |
|---|---|---|
| CANG | -91% | -97% |
| NYSE | 9% | 12% |
| DTCR* | 19% | 16% |
| WGMI** | -18% | -47% |
| US$ millions, except EPS | 2025 | 2026E | 2027E |
|---|---|---|---|
| Revenue | $688.10 | $228.52 | $233.47 |
| Adj. Net Income | -$453 | -$331 | -$124 |
| EPS | -$16.00 | -$8.07 | -$3.02 |
| Cash + Cryptos, net of Debt | $704 | $102 | $31 |
| Assets | $1,133 | $294 | $286 |
Cango operates a global Bitcoin mining business while diversifying into energy and AI computing infrastructure.
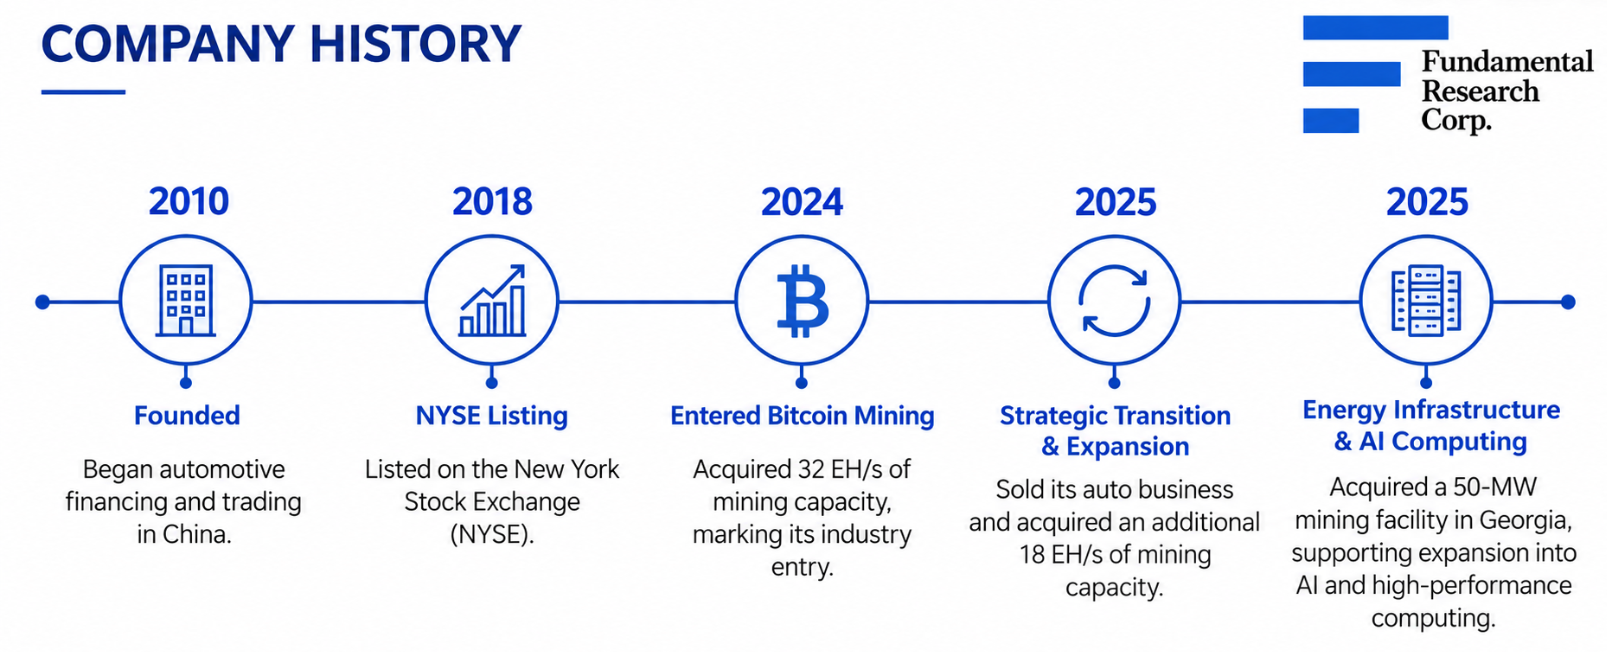
Cango has transformed from a China-based automotive financing platform into a global Bitcoin mining company, since entering the industry in 2024. The company is now diversifying into AI computing, and digital infrastructure, positioning itself to capitalize on growing demand for high-performance computing.
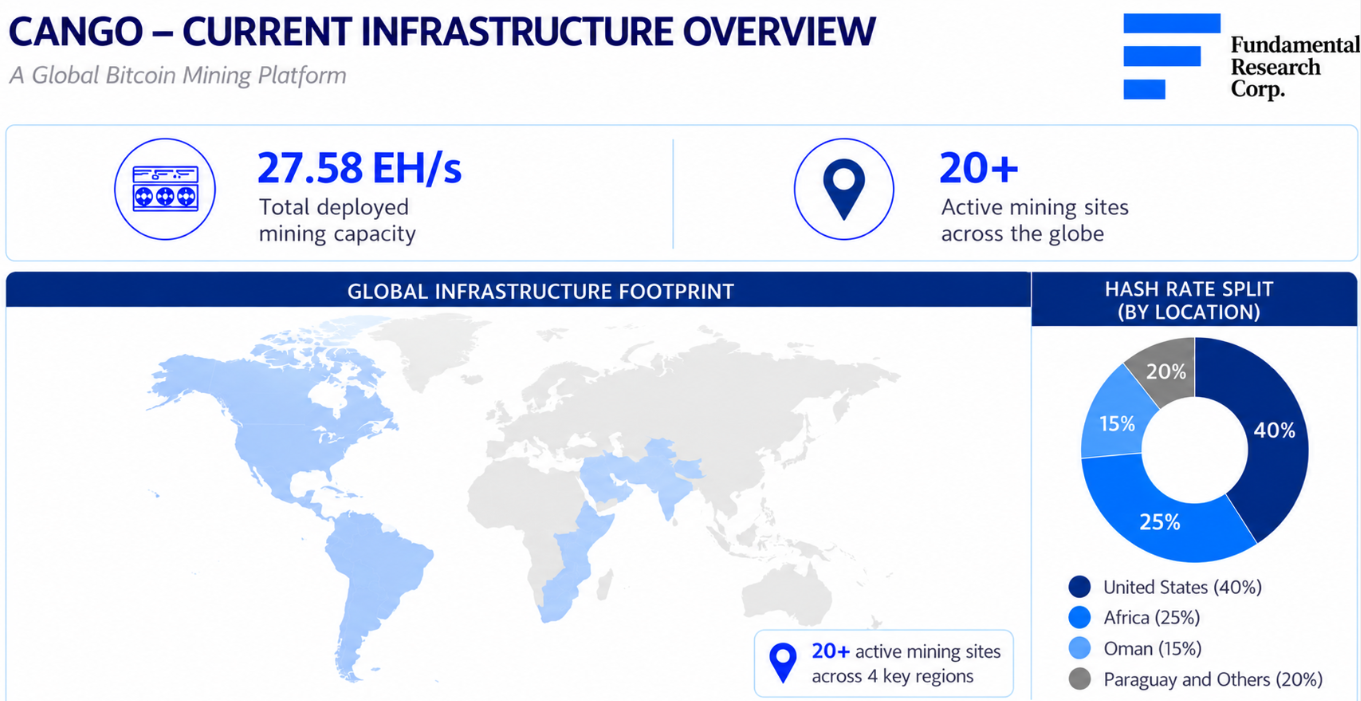
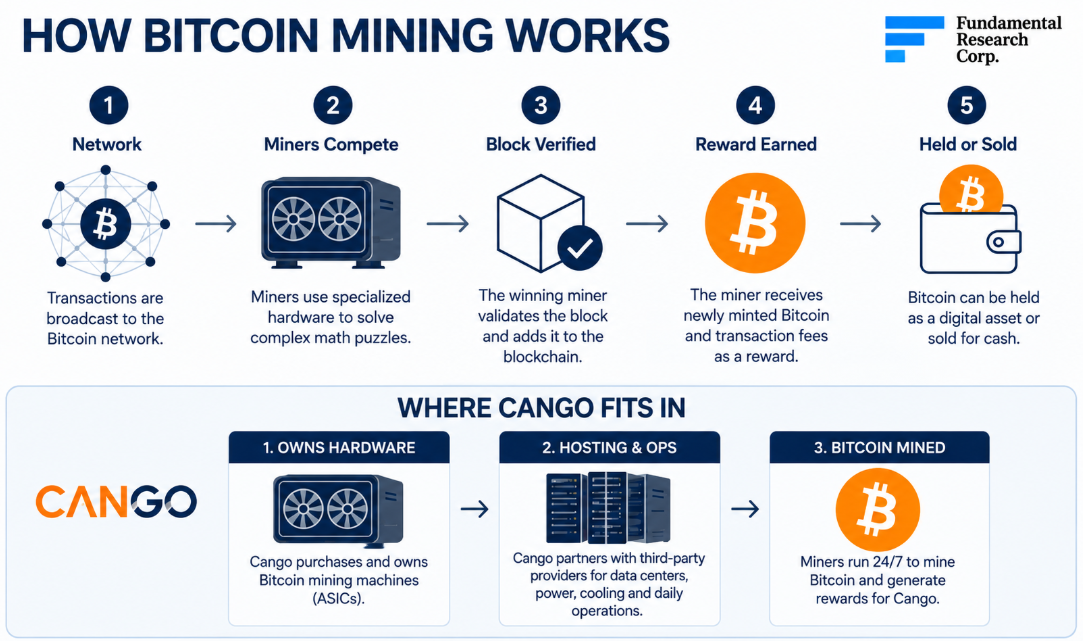
Cango owns the Bitcoin mining machines, while third-party companies provide the facilities, power, and day-to-day operations needed to run them. Cango operates 20+ mining sites across North America, the Middle East, South America, and East Africa, with 27.58 EH/s of Bitcoin mining capacity, representing 3% of the global hashrate, ranking it among the top 10 publicly traded Bitcoin miners by hashrate.
Over recent quarters, Cango has scaled back higher-cost operations to improve profitability, reducing cash costs from $83,091 in Q2 2025, to $73,313 in Q2 2026 vs. the sector average of ~$71,000 (spot BTC price: $80,500). The trade-off has been a lower hashrate and revenue.
Bitcoin Mining – Quarterly Operating Performance
| Metric | Q4-24 | Q1-25 | Q2-25 | Q3-25 | Q4-25 | Q1-26 | Q2-26 |
|---|---|---|---|---|---|---|---|
| Operating hashrate (EH/s) | 30.4 | ~32.0 | ~37.0 | ~43.0 | ~43.0 | 37.0 | 27.6 |
| BTC mined | 933.8 | 1,541.0 | 1,404.4 | 1,930.8 | 1,718.3 | 1,266.1 | 656.0 |
| Average BTC price | $91,600 | $93,392 | $88,684 | $114,471 | $99,799 | $76,503 | ~$69,000 |
| Cash cost/BTC | $67,770 | $70,602 | $83,091 | $81,072 | $84,552 | $76,928 | $73,313 |
| (BTC Price - Cash Cost)/BTC | $28,066 | $22,973 | $15,256 | $33,311 | $15,720 | $791 | ($1,057) |
| All-in cost/BTC | — | — | $98,636 | $99,383 | $106,251 | $98,747 | $98,405 |
| Bitcoin mining revenue (US$M) | $89.5 | $144.2 | $138.1 | $220.9 | $172.4 | $98.4 | $47.4 |
| Total revenue (US$M) | $91.5 | $145.2 | $139.8 | $224.6 | $179.5 | $102.0 | $50.8 |
| Adjusted EBITDA (US$M) | $2.4 | ($0.8) | $99.1 | $80.1 | ($156.3) | ($154.1) | ($10.7) |
| BTC Treasury | ~934 | ~2,425 | 3,879 | 5,810 | 7,528 | 1,026 | 1,056 |
In simple terms, Bitcoin mining uses specialized computers and hardware to validate transactions, with successful miners receiving newly created Bitcoin as compensation. Electricity typically accounts for over 90% of a miner’s direct costs, making access to low-cost power critical to profitability.
Bitcoin supply is capped at 21M, with over 20M already mined, reinforcing its scarcity. Every four years, new Bitcoin issuance falls 50%, reducing annual supply from the current 164,250 BTC, to 82,125 BTC after the next halving in 2028, tightening new supply.
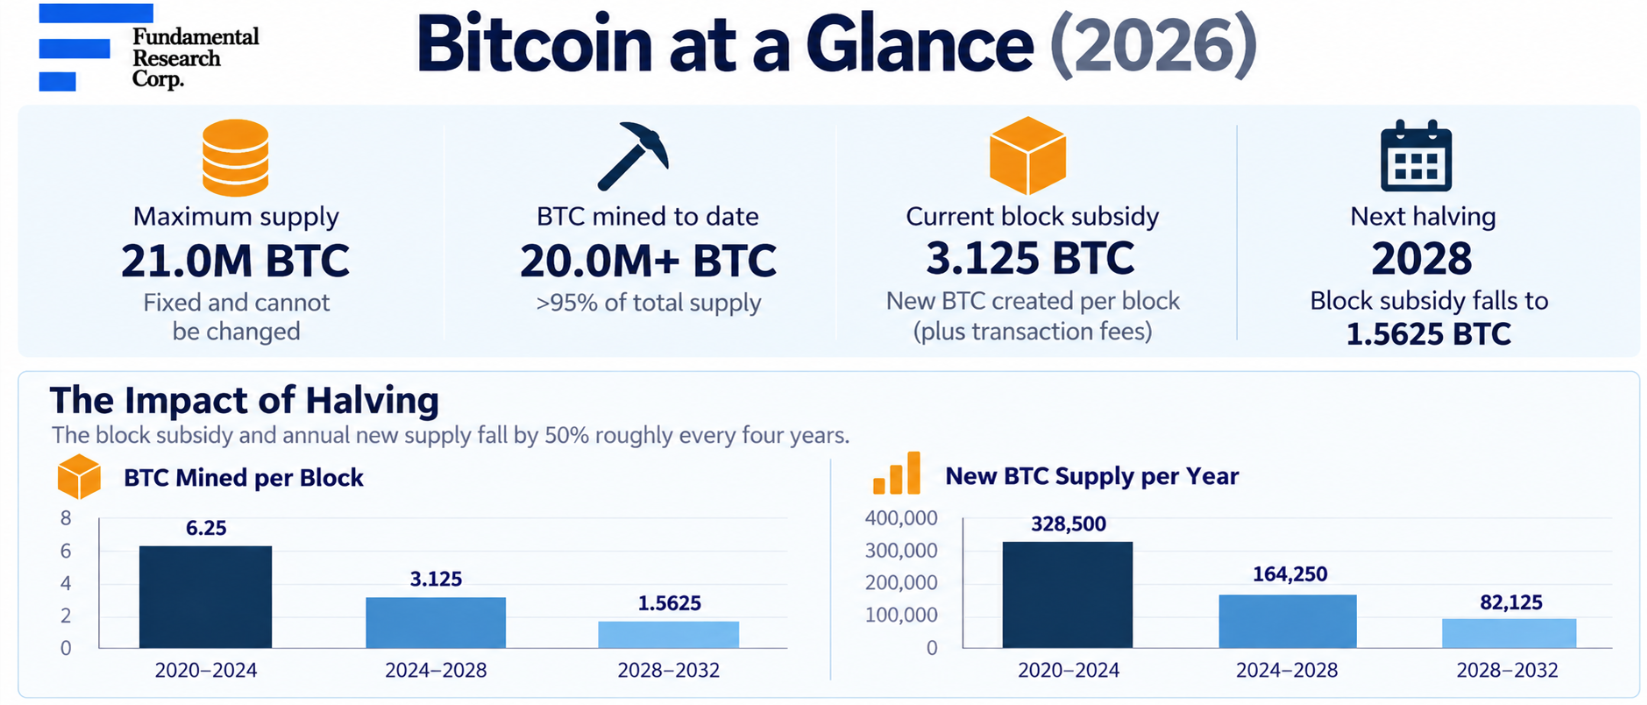
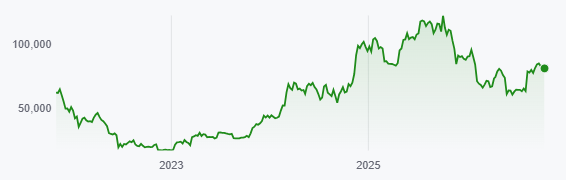
$13B worth of new Bitcoin is mined annually, at current prices. A key factor affecting a miner’s revenue is the global hashrate.
Bitcoin Prices
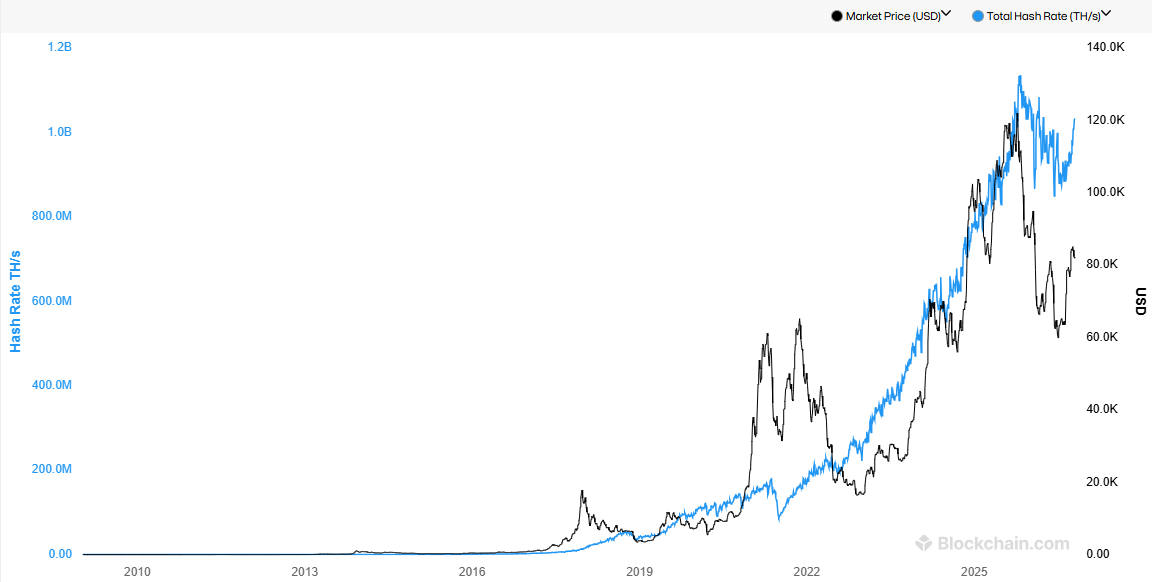
The network hashrate measures the total computing power used by Bitcoin miners to perform calculations. As the hashrate rises, mining becomes more competitive, requiring more computing power and capital.
The hashrate rises as more miners join the network, or existing miners deploy additional computing power. Specifically, the global hashrate rose from ~780 EH/s at year-end 2024, to ~1,000 EH/s currently (+28%). Cango’s 27.58 EH/s represents ~3% of the global network.
Global Hash Rate
Key Bitcoin Market Drivers:
Bitcoin benefits from institutional demand, scarcity and decentralization, but faces price volatility, and rising mining costs.
We use gold as a benchmark due to its established role as a store of value. We estimate BTC should be priced between $67,800 and $1.36M, assuming it captures 5%–100% of gold’s total market value. Cango aims to leverage its large-scale mining operations to improve efficiency, reduce operating costs, and capitalize on potential upside from Bitcoin prices.
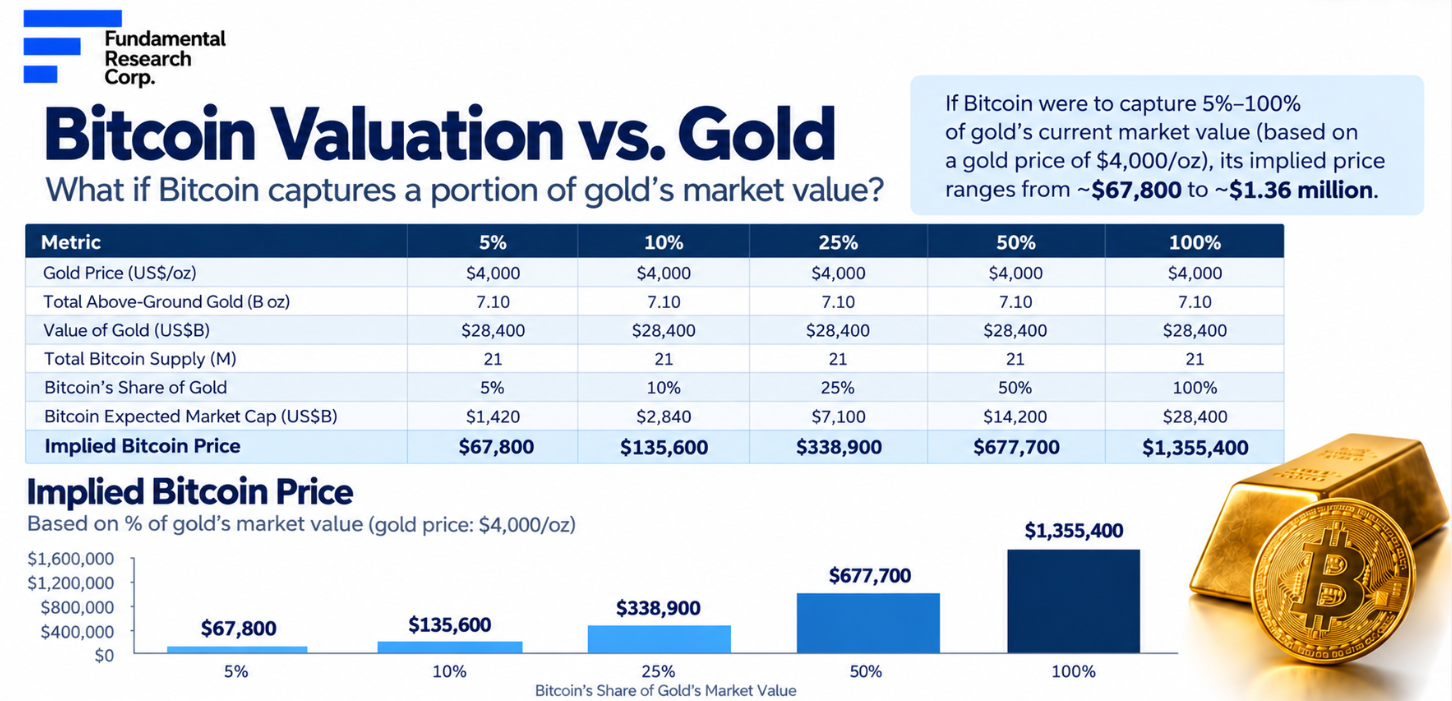
| Metric | 5% | 10% | 25% | 50% | 100% |
|---|---|---|---|---|---|
| Gold Price (US$/oz) | $4,000 | $4,000 | $4,000 | $4,000 | $4,000 |
| Total Above-Ground Gold (B oz) | 7.10 | 7.10 | 7.10 | 7.10 | 7.10 |
| Value of Gold (US$B) | $28,400 | $28,400 | $28,400 | $28,400 | $28,400 |
| Total Bitcoin Supply (M) | 21 | 21 | 21 | 21 | 21 |
| Bitcoin's Share of Gold | 5% | 10% | 25% | 50% | 100% |
| Bitcoin Expected Market Cap (US$B) | $1,420 | $2,840 | $7,100 | $14,200 | $28,400 |
| Implied Bitcoin Price | $67,800 | $135,600 | $338,900 | $677,700 | $1,355,400 |
Cango is among several Bitcoin miners transitioning into AI infrastructure.
In April 2026, Cango launched EcoHash, its high-performance computing (HPC) and AI inference subsidiary, to enter the growing AI/HPC infrastructure market. This initiative aims to diversify revenue beyond Bitcoin mining by providing computing resources for demanding workloads, while retaining mining as a complementary business.
Organizations across industry are adopting AI to improve efficiency and decision-making. As adoption accelerates, demand for high-performance AI computing infrastructure continues to grow. Demand for AI computing comes from a broad range of customers, including AI developers (e.g., OpenAI, Anthropic, and xAI), enterprises, startups, research institutions, and government agencies.
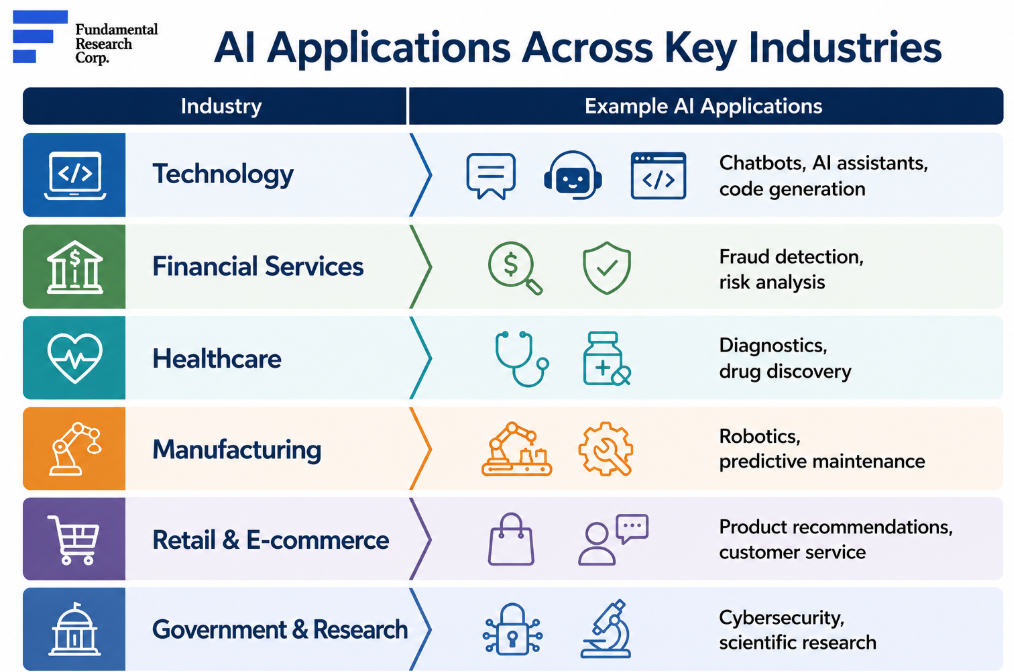
| Industry | Example AI Applications |
|---|---|
| Technology | Chatbots, AI assistants, code generation |
| Financial Services | Fraud detection, risk analysis |
| Healthcare | Diagnostics, drug discovery |
| Manufacturing | Robotics, predictive maintenance |
| Retail & E-commerce | Product recommendations, customer service |
| Government & Research | Cybersecurity, scientific research |
Data centers are the backbone of the AI ecosystem, providing the computing power needed to train and deploy AI models. Organizations requiring AI computing generally have three options:
Building AI infrastructure requires significant capital, power, and technical expertise, making leased AI computing the preferred option for most organizations, while enabling on-demand scalability.
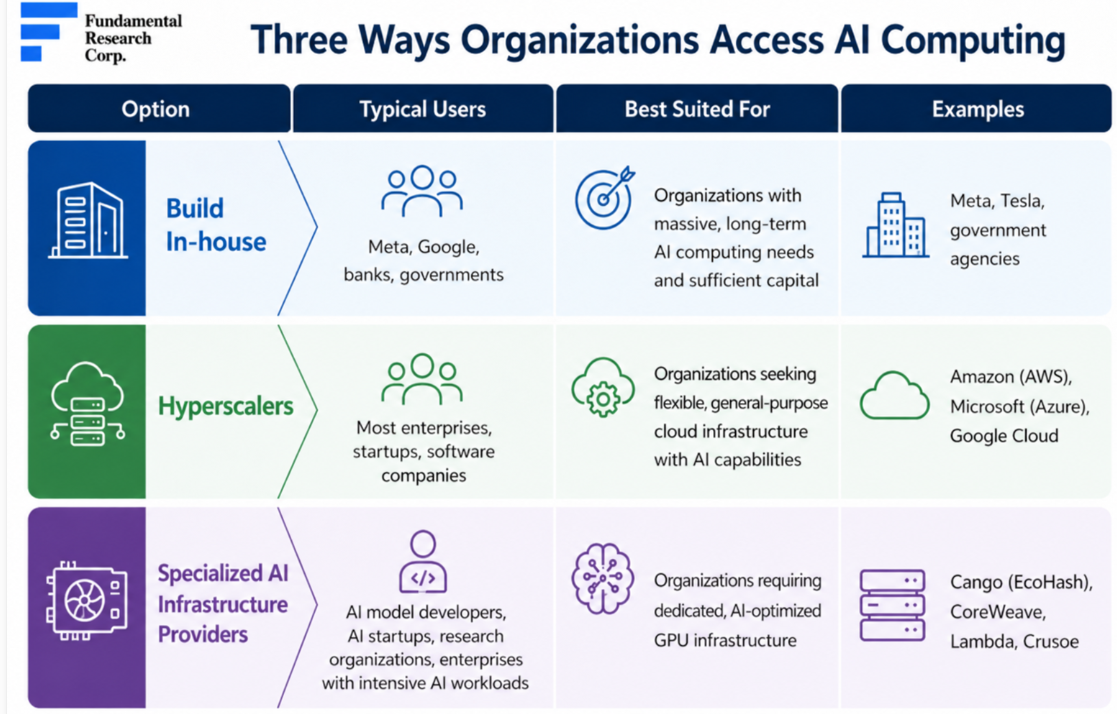
| Option | Typical Users | Best Suited For | Examples |
|---|---|---|---|
| Build In-house | Meta, Google, banks, governments | Organizations with massive, long-term AI computing needs and sufficient capital | Meta, Tesla, government agencies |
| Hyperscalers | Most enterprises, startups, software companies | Organizations seeking flexible, general-purpose cloud infrastructure with AI capabilities | Amazon (AWS), Microsoft (Azure), Google Cloud |
| Specialized AI Infrastructure Providers | AI model developers, AI startups, research organizations, enterprises with intensive AI workloads | Organizations requiring dedicated, AI-optimized GPU infrastructure | Cango (EcoHash), CoreWeave, Lambda, Crusoe |
While hyperscalers dominate the market, specialized providers help meet growing AI demand.
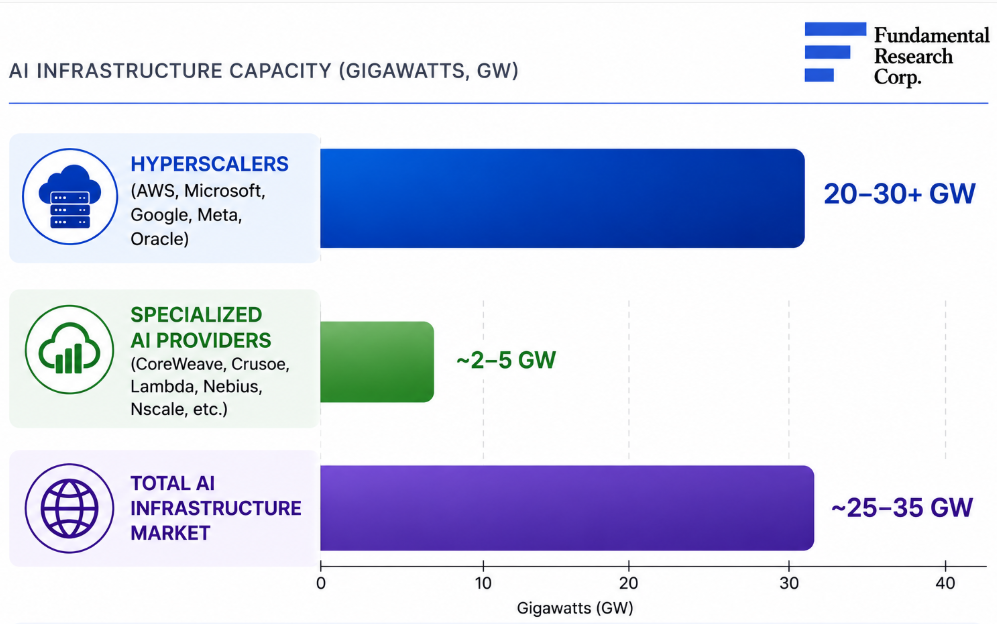
While hyperscalers offer AI as one of many cloud services, specialized providers focus exclusively on AI computing, complementing rather than replacing the major cloud platforms. We believe both business models can coexist, much like Amazon coexists with specialized retailers such as Best Buy and Home Depot, as the rapidly growing AI computing market is large enough to support both.
The specialized AI infrastructure market remains relatively fragmented, with a mix of established private companies, public companies, and emerging entrants. While most providers operate across North America and Europe, they differ in scale, geographic reach, and stage of development.
| Company | Founded | Regions | Relative Scale |
|---|---|---|---|
| CoreWeave (NASDAQ: CRWV) | 2017 | North America, Europe | Industry leader / AI cloud |
| Crusoe (Private) | 2018 | North America, Europe, Middle East | Large/private |
| Lambda (Private) | 2012 | North America | Large/private |
| Nebius (NASDAQ: NBIS) | 2024 | Europe, North America | Large/public |
| IREN (NASDAQ: IREN) | 2018 | North America, Australia | Large/public |
| Cipher Digital (NASDAQ: CIFR) | 2021 | North America | Large/public |
| TeraWulf (NASDAQ: WULF) | 2021 | North America | Large/public |
| Bitdeer Technologies (NASDAQ: BTDR) | 2018 | North America, Asia, Europe | Large/public |
| Cango Inc. (NYSE: CANG) | 2026 (AI) | North America (planned) | Early-stage/public |
CoreWeave (MCAP: $33B), a leading specialized AI infrastructure company, provides a useful case study of the sector's growth potential. Revenue grew from $16M (2022), to an estimated $13B in 2026. Estimated economics are ~$4.2M in gross profit per MW vs. ~$15M in initial CAPEX per MW, implying an attractive payback.
| Metric | CoreWeave |
|---|---|
| Founded | 2017 (pivoted to AI cloud in 2019) |
| IPO | March 2025 (NASDAQ: CRWV) |
| Revenue (2022) | $16M |
| Revenue (2023) | $229M (+1,300% YoY) |
| Revenue (2024) | $1.92B (+737% YoY) |
| Revenue (2025) | $5.13B (+168% YoY) |
| Revenue (2026E) | $12.67B (+147% YoY) |
| Key Customers | Microsoft, OpenAI, Meta, NVIDIA, IBM, Cohere |
| Gross Margin | ~70% |
| AI Data Centers | 43 |
| Active Power Capacity | >850 MW active; 3.1 GW contracted |
| Revenue / MW | ~6.0M |
| Gross Profit / MW | ~$4.2M |
| Estimated Initial CapEx / MW | ~$15M |
Cango is building an integrated platform spanning AI infrastructure and GPU computing services.
Growing demand for computing is constrained by power availability, high capital requirements, and lengthy construction timelines. Cango aims to help address this infrastructure gap through modular AI data centers, enabling faster deployment, and scalable expansion of computing capacity.
The AI computing value chain begins with access to reliable, affordable power, followed by data center infrastructure (facilities and cooling), GPU hardware (AI processors), and computing services delivered to customers. Cango operates across data center infrastructure, GPU deployment, and computing services, capturing value across multiple stages.
AI/HPC Value Chain
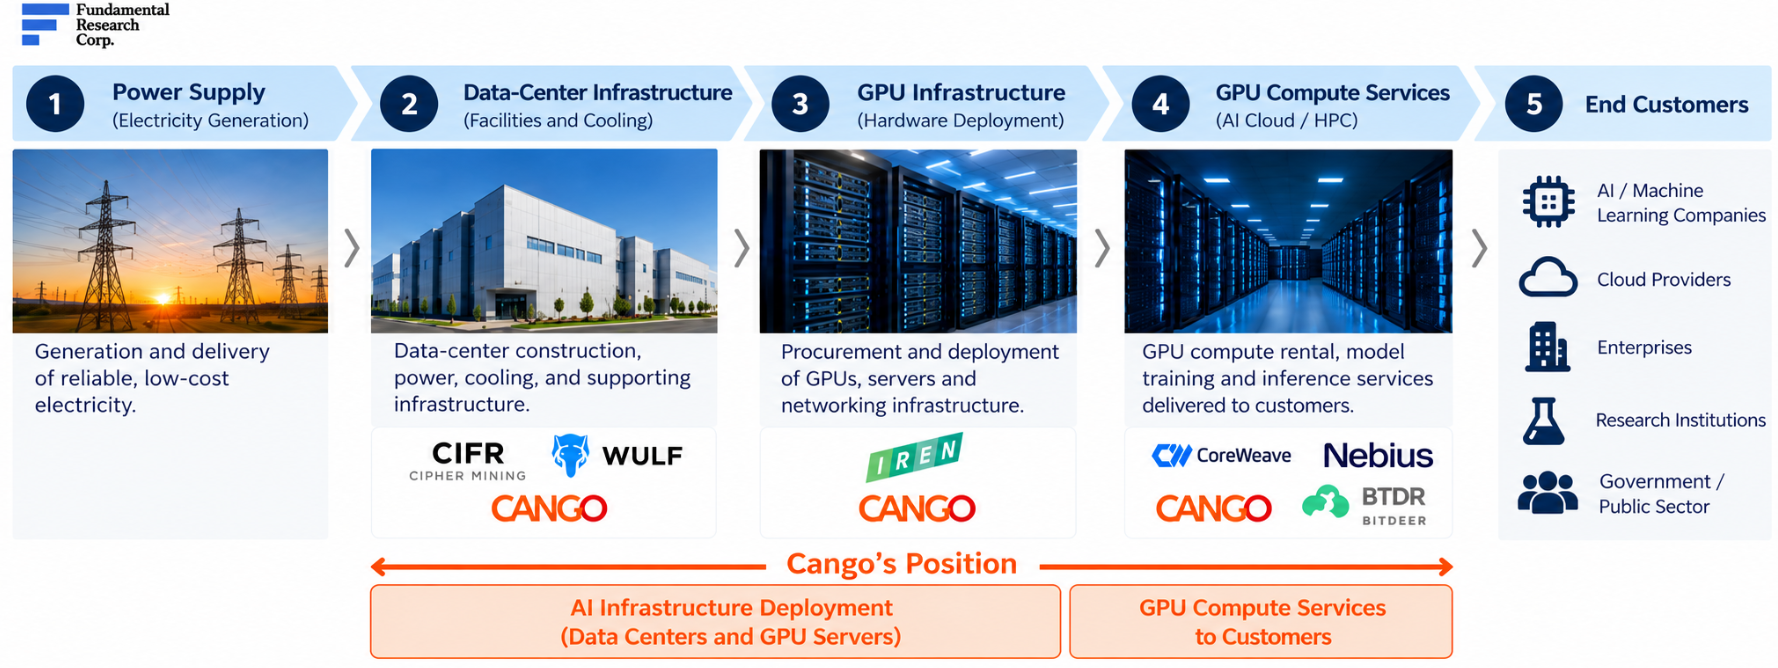
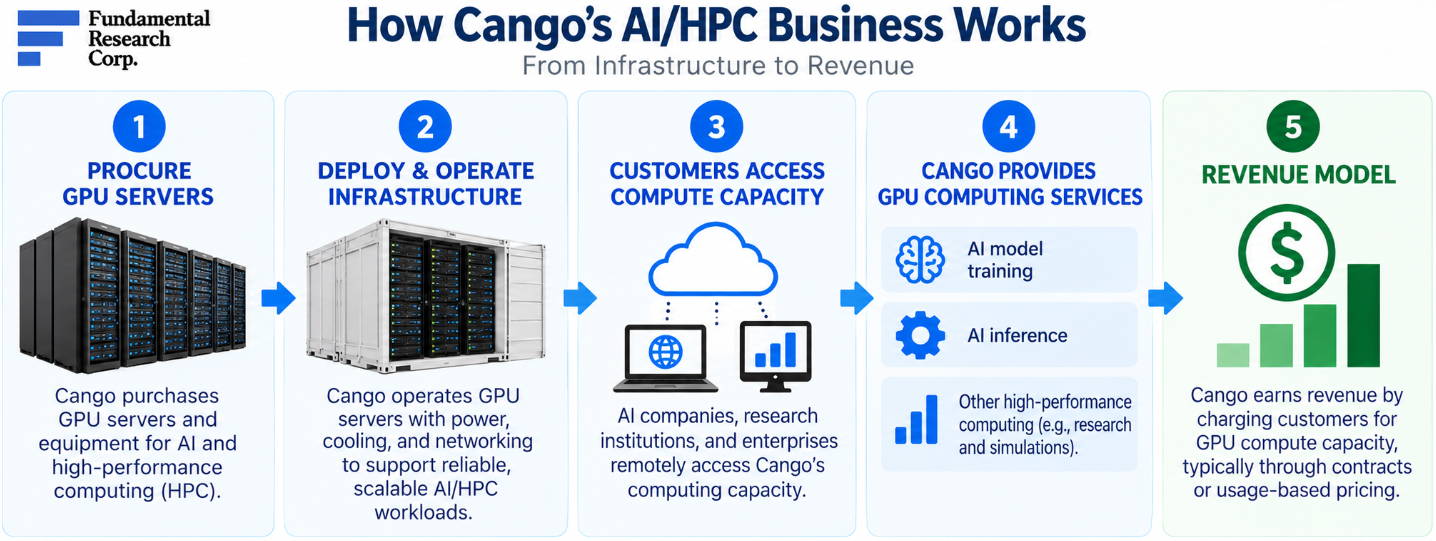
Customers can access AI computing resources on demand over the internet. The following chart outlines how Cango plans to deliver computing services.
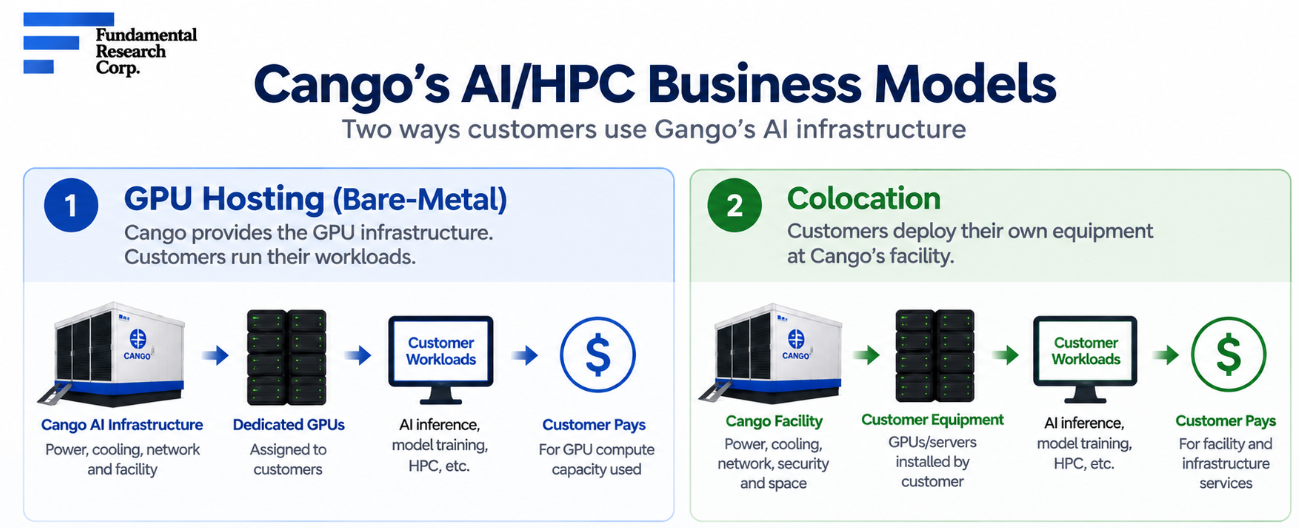
Cango intends to offer two types of services: bare-metal GPU hosting, and data center colocation. Both are designed to generate recurring revenue through customer fees.
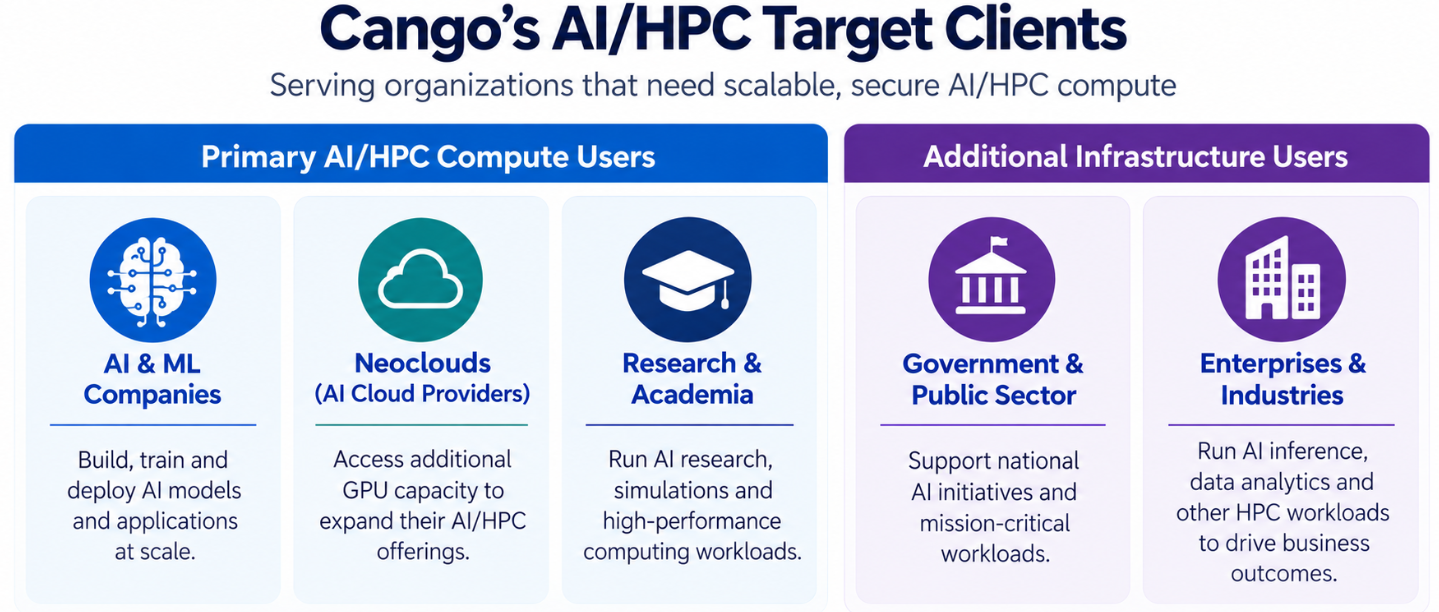
Cango targets other specialized AI cloud and GPU infrastructure providers, AI companies, and companies seeking scalable GPU capacity. Initial AI revenue began in Q3-26.
In August 2025, Cango acquired a 50 MW Georgia Bitcoin mining facility for $19.5M. In Q2-2026, it converted 3 MW of capacity to AI-enabled power infrastructure for a demonstration project. The remaining 47 MW continues to support Bitcoin mining, with potential for future AI/HPC expansion.
Cango began generating AI revenue in Q3-26. Management has not disclosed the number of AI customers or the associated revenue opportunity. Future deployments will depend on customer demand, and feedback from the demonstration project.
Upcoming revenue and performance updates should provide valuable insights into customer demand, workload types, and scalability. We note that this remains an early-stage business, with significant upside potential if management executes its growth strategy.
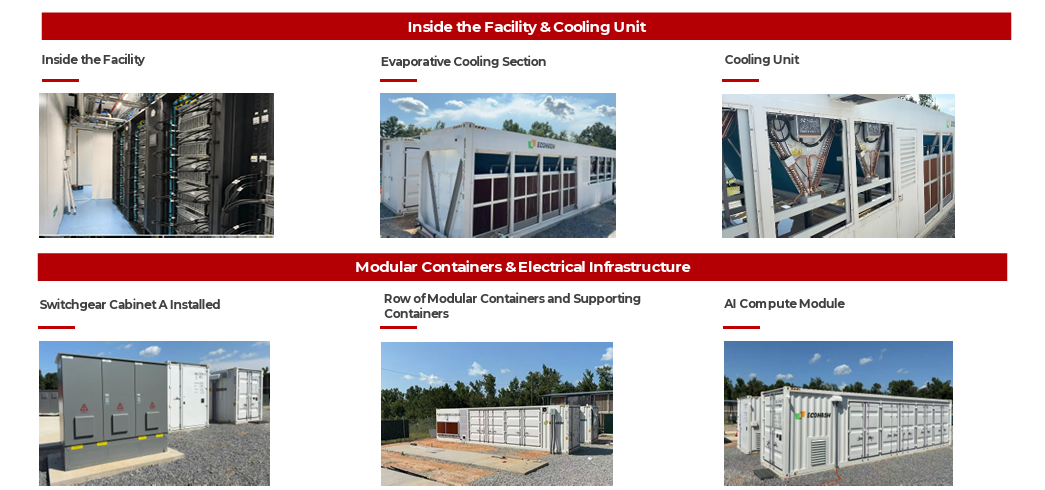
Cango plans to replicate its modular AI/HPC deployments across high-potential locations, but has not provided guidance on its expansion plans, or targeted capacity. For context, the U.S. AI infrastructure market size is estimated at 25–35 GW, 8,000–12,000 times Cango’s current 3 MW project.
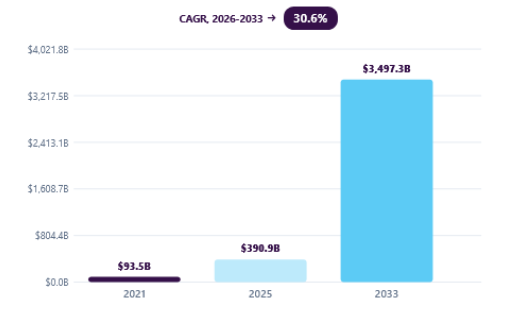
The global AI market is projected to grow from $391B (2025) to $3.5T (2033), a 31% CAGR.
Global AI Market Size
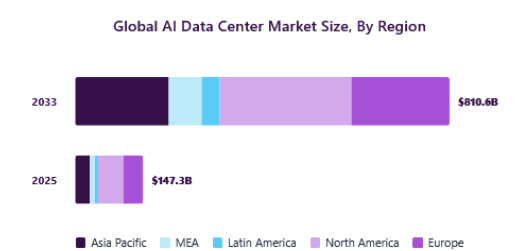
The global AI data center market is expected to expand from $147B (2025) to $811B (2033), a 24% CAGR.
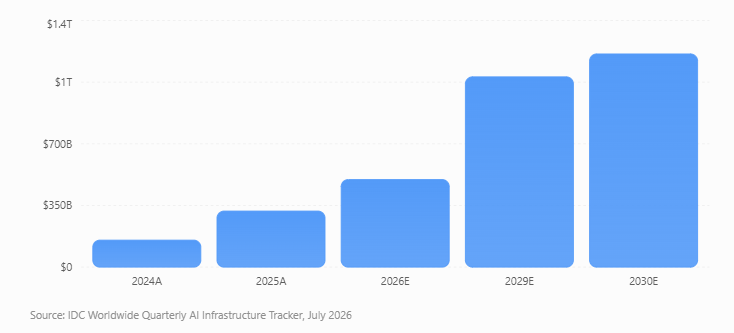
Global AI infrastructure spending is forecast to increase from $497B (2026) to $1.2T (2030), a 25% CAGR.
Global AI Infrastructure Spending Forecast
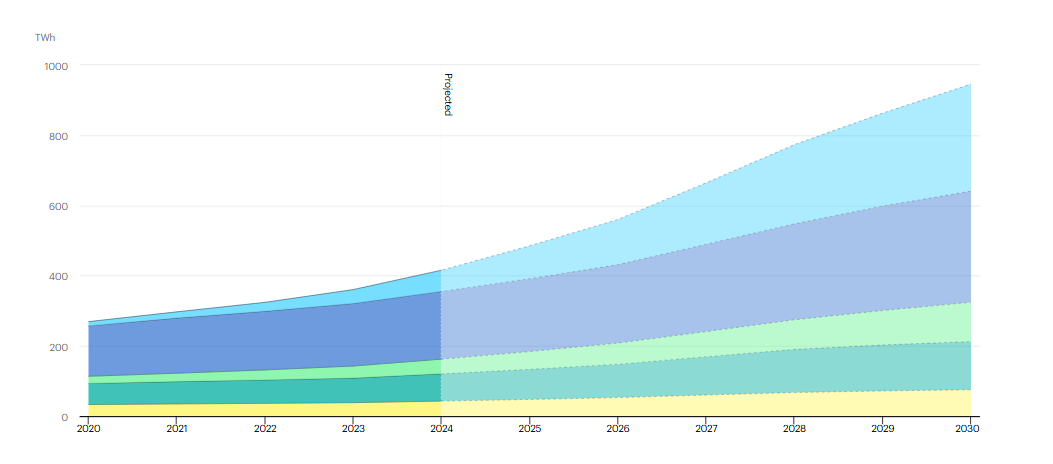
Data center electricity demand is projected to grow 15% p.a. through 2030, over 4x faster than other sectors. In summary, we believe the above-mentioned trends provide a favorable backdrop for specialized AI infrastructure providers such as Cango.
Global Data Centre Electricity Consumption
Cango’s head office is in Dallas, Texas. Management, board, and key investors own 60%. Three out of six directors are independent. Cango is led by a team with experience in cryptocurrency, digital infrastructure, AI/HPC computing, finance and corporate development.
| Management & Board Members | Shares | % of Total |
|---|---|---|
| Peng Yu – CEO & Director | — | — |
| Simon Ming Yeung Tang – CFO & Director | — | — |
| Xin Jin – Chairman & Non-Executive Director | 1,926,729 | 4.70% |
| Chi Ming Lee – Independent Director | — | — |
| Yanjun Lin – Independent Director | — | — |
| Haitian Lu – Independent Director | — | — |
| Significant Investors | Shares | % of Total |
| Enduing Wealth Capital Limited* | 1,700,000 | 4.15% |
| Golden TechGen Limited | 7,035,303 | 17.16% |
| Chang-Wei Chiu (former Director) | 4,920,251 | 12.00% |
| Xiaojun Zhang (former Chairman) | 3,269,549 | 7.97% |
| Jiayuan Lin (former Director) | 3,243,326 | 7.91% |
| Boyu Capital Group Management Ltd. | 2,363,564 | 5.76% |
| Total | 24,458,722 | 59.66% |
Brief biographies of the company’s management team and board members follow:
Mr. Jin is the founder and CEO of Antalpha Platform Holding Company and has extensive experience in cryptocurrency mining, mining hardware and digital infrastructure. Before founding Antalpha, he held management roles in mining-machine distribution and software businesses. His background provides Cango with significant expertise in the crypto-mining and digital-asset infrastructure sectors.
Mr. Yu has over 18 years of experience across Bitcoin mining, energy, M&A and asset management. Before joining Cango, he served as Managing Director of ABC International Investment Management and previously held senior positions at Zhongrong Huijin Asset Management and ORIX Asia Capital. He began his career in investment banking and property development.
Mr. Tang is an experienced corporate finance professional with extensive investment banking and legal experience. Before Cango, he served as CFO of two technology and new-energy companies and previously spent 11 years with Credit Suisse’s APAC TMT investment banking team. He also practiced corporate law at Linklaters and holds a degree in Jurisprudence from the University of Oxford.
Mr. Lee has extensive experience in finance, securities regulation and asset management. He previously held senior positions at Hong Kong’s Securities and Futures Commission and has served as an independent director of several financial and technology companies. He is a fellow of the ACCA and HKICPA and holds degrees in accountancy, law and business administration.
Mr. Lin is a FinTech and digital-asset specialist with experience in investment banking, virtual-asset banking and financial services. He was previously CEO for Asia at AMINA Bank and CFO of 9F Inc., and is a founding partner of I.N Capital, an investment and consulting firm focused on blockchain and AI.
Prof. Lu is a professor of accounting and finance at The Hong Kong Polytechnic University, with expertise in FinTech, RegTech and sustainable finance. He also holds directorships across financial and technology-related organizations. He earned a Ph.D. in law from the National University of Singapore and law degrees from Liverpool University and Nanjing University.
H1-26 revenue and EPS declined as Cango scaled back uneconomic mining operations, reducing BTC production, while lower BTC prices added further pressure. BTC prices declined YoY, from ~$89,000 in Q2-25, to ~$69,000 in Q2-26. In addition, cash costs per BTC declined YoY, from ~$83,000 in Q2-25, to ~$73,000 in Q2-26.
| INCOME STATEMENTS ($M) YE December 31 |
2025 | H1-2025 | H1-2026 | YoY |
|---|---|---|---|---|
| Revenue | $688.10 | $284.00 | $152.80 | -46% |
| Cost of revenue | -$543.30 | -$225.40 | -$150.30 | -33% |
| Gross profit | $144.80 | $58.50 | $2.50 | -96% |
| G&A | -$28.90 | -$13.00 | -$15.60 | 20% |
| EBITDA | $115.90 | $45.50 | -$13.10 | N/A |
| Adj. EBITDA (incl. FV changes) | $24.52 | $100.70 | -$164.80 | N/A |
| Depreciation | -$116.60 | -$43.20 | -$46.30 | 7% |
| EBIT | -$0.70 | $2.30 | -$43.80 | N/A |
| Interest expense | -$20.00 | -$3.40 | -$7.30 | N/A |
| Impairment & other | -$434.80 | -$256.90 | -$276.70 | N/A |
| Net income (loss) | -$452.80 | -$205.10 | -$342.70 | N/A |
| EPS | -$16.00 | -$9.73 | -$8.91 | N/A |
| Margins | 2025 | H1-2025 | H1-2026 |
|---|---|---|---|
| Gross | 21% | 21% | 2% |
| EBITDA | 17% | 16% | -9% |
| EBIT | 0% | 1% | -29% |
| Net | -66% | -72% | -224% |
| % of Revenue | 2025 | H1-2025 | H1-2026 |
|---|---|---|---|
| G&A | 4% | 5% | 10% |
We believe H2-2026 margins will be higher, as the current BTC price is 16% above the Q2 average.
| Summary of Cash Flows ($M) | 2024 | 2025 |
|---|---|---|
| Cash Flows from Operations | -$40.83 | -$109.83 |
| Cash Flows from Investing | -$178.67 | $78.68 |
| Cash Flows from Financing | -$17.70 | -$148.92 |
| Net Change | -$245.61 | -$176.30 |
| Free Cash Flows | -$168.92 | -$224.61 |
Cango has a healthy balance sheet at the end of Q2-2026, with 1,056 BTC (~$85M), $13M in other cryptos, $10M in cash, $40M in receivables from the disposal of the old auto-finance business, and $49M in debt.
| Liquidity and Capital Structure ($M) YE December 31 |
2025 | Q2-2026 |
|---|---|---|
| Cash | $41.20 | $10.10 |
| Cryptos | $663.04 | $74.40 |
| Working Capital | -$51.60 | $0.10 |
| Current Ratio | 0.71 | 1.00 |
| LT Debt | $557.60 | $41.20 |
| Total Debt | $557.60 | $49.20 |
| Total Debt / Capital | 58% | 27% |
| EBIT Interest Coverage | N/A | N/A |
We value Cango’s Bitcoin mining business at $46M, or $1.11/share. Similarly, we value the AI/HPC business at $215M, or $5.25/share, assuming Cango converts its entire 50 MW Georgia mining facility to AI/HPC infrastructure by 2030. Nonetheless, our AI/HPC valuation is preliminary and highly speculative, based on comparable-company assumptions for key operating metrics and capital structure, with a higher discount rate to reflect execution risks. Using a sum-of- parts valuation, we arrive at an overall DCF value of $5.36/share.
| BTC Mining (FRC Estimates) | # | 2026E | 2027E | 2028E | 2029E | 2030E | 2031E | 2032E | 2033E | Terminal |
|---|---|---|---|---|---|---|---|---|---|---|
| Hash Rate (EH/s) | 27.6 | 27.6 | 27.6 | 27.6 | 27.6 | 27.6 | 27.6 | 27.6 | ||
| BTC mined per month/EHs | 8 | 8 | 4 | 4 | 4 | 4 | 2 | 2 | ||
| Bitcoin mined per year | 2,841 | 2,624 | 1,312 | 1,312 | 1,312 | 1,312 | 656 | 656 | ||
| Bitcoin price | $78,000 | $78,000 | $78,000 | $89,000 | $89,000 | $89,000 | $89,000 | $89,000 | ||
| Cost Per Bitcoin | $75,000 | $71,760 | $71,760 | $71,200 | $71,200 | $71,200 | $71,200 | $71,200 | ||
| Gross Profit Per Bitcoin | $3,000 | $6,240 | $6,240 | $17,800 | $17,800 | $17,800 | $17,800 | $17,800 | ||
| Revenue ($M) | $226.27 | $204.67 | $102.34 | $116.77 | $116.77 | $116.77 | $58 | $58 | ||
| Direct Costs ($M) | $213.04 | $188.30 | $94.15 | $93.41 | $93.41 | $93.41 | $47 | $47 | ||
| Growth CAPEX ($M) | - | - | - | - | - | - | - | - | ||
| Maintenance CAPEX ($M) | $11.31 | $10.23 | $5.12 | $5.84 | $5.84 | $5.84 | $2.92 | $2.92 | ||
| Total CAPEX | $11.31 | $10.23 | $5.12 | $5.84 | $5.84 | $5.84 | $2.92 | $2.92 | ||
| Free Cash Flows | -$0.73 | $2.87 | $1.43 | $12.84 | $12.84 | $12.84 | $6.42 | $6.42 | ||
| Present Value | -$0.67 | $2.41 | $1.10 | $9.07 | $8.31 | $7.62 | $3.49 | $3.20 | $17.68 |
| AI/HPC Buildout (FRC Estimates) | 2026E | 2027E | 2028E | 2029E | 2030E | 2031E | 2032E | 2033E | Terminal |
|---|---|---|---|---|---|---|---|---|---|
| New Capacity Added (MW) | 3 | 10 | 10 | 10 | 10 | 7 | - | - | |
| Total Capacity (MW) | 3 | 13 | 23 | 33 | 43 | 50 | 50 | 50 | |
| Utilization (%) | 50% | 60% | 60% | 70% | 70% | 80% | 80% | 80% | |
| Revenue/MW ($M) | $6.00 | $6.00 | $6.00 | $6.00 | $6.00 | $6.00 | $6.00 | $6.00 | |
| Revenue ($M) | $2.25 | $28.80 | $64.80 | $117.60 | $159.60 | $223.20 | $240.00 | $240.00 | |
| Gross Margin | 70% | 70% | 70% | 70% | 70% | 70% | 70% | 70% | |
| Gross Profit ($M) | $1.58 | $20.16 | $45.36 | $82.32 | $111.72 | $156.24 | $168.00 | $168.00 | |
| CAPEX/MW ($M) | $15.00 | $15.00 | $15.00 | $15.00 | $15.00 | $15.00 | $15.00 | $15.00 | |
| Growth CAPEX ($M) | $45.00 | $150.00 | $150.00 | $150.00 | $150.00 | 105.00 | - | - | |
| Maintenance CAPEX ($M) | — | $2.88 | $6.48 | $11.76 | $15.96 | $22.32 | $24.00 | $24.00 | |
| Total CAPEX | $45.00 | $152.88 | $156.48 | $161.76 | $165.96 | $127.32 | $24.00 | $24.00 | |
| Free Cash Flows | -$43.76 | -$137.04 | -$120.84 | -$97.08 | -$78.18 | -$4.56 | $108.00 | $108.00 | |
| Present Value | -$38.93 | -$108.47 | -$85.10 | -$60.82 | -$43.58 | -$2.26 | $47.65 | $42.39 | $464.52 |
| BTC Mining | AI/HPC | |
|---|---|---|
| Cost of equity | 10% | 25% |
| Cost of debt | 7% | 7% |
| Debt to Capital | 30% | 70% |
| Weighted Avg Cost of Capital | 9% | 12% |
| AT-NPV $M) | $45.52 | $215.40 |
| AT-NPV ($M) - Consolidated | $260.91 | |
| Working Capital - LT Debt ($M) | -$41.10 | |
| Fair Value ($M) | $219.81 | |
| # of Shares (M) | 41.02 | |
| Fair Value per Share | $5.36 | |
| Key Assumptions | |
|---|---|
| Revenue/MW ($M) - HP/AI | $6 |
| Initial CAPEX/MW ($M) - HPC/AI | $15 |
| Maintenance CAPEX (% of Revenue) | 10% |
Similar to our DCF valuation, we value Cango’s Bitcoin mining and AI/HPC businesses separately using comparable-company multiples, as the market assigns a premium to AI/HPC for its growth potential and robust industry outlook (9x vs. 4x EV/revenue). Cango trades at an 88% discount to Bitcoin mining comparables (0.5x vs. 4.0x forward EV/revenue). Applying sector multiples to both business lines yields a valuation of $3.83/share. Given Cango’s smaller size, we apply a 90% discount for conservatism.
| Cango vs BTC Miners | MCAP ($M) | Enterprise Value (EV, $M) | Gross Margin | Debt / Capital | Current Hashrate (EH/s) | BTC Mined per Year | Cash Cost per BTC | Revenue ($M) | EV/Revenue |
|---|---|---|---|---|---|---|---|---|---|
| IREN | $10,021 | $11,964 | 69% | 65% | 23 | 3,700 | $65,000 | $707 | 4.54 |
| Hut 8 | $7,762 | $15,508 | 62% | 81% | 15 | 3,504 | $73,000 | $318 | 53.62 |
| TeraWulf | $5,978 | $8,595 | 69% | 97% | 6 | 690 | $175,000 | $165 | 35.27 |
| Riot Platforms | $4,725 | $5,131 | 28% | 29% | 44 | 6,120 | $75,000 | $675 | 8.11 |
| Cipher Digital | $3,199 | $7,981 | n/a | 91% | 12 | 1,380 | $216,000 | $191 | 38.15 |
| MARA Holdings | $2,642 | $4,785 | 40% | 58% | 70 | 9,340 | $86,000 | $804 | 6.90 |
| CleanSpark | $1,996 | $3,579 | 47% | 70% | 50 | 7,450 | $72,000 | $679 | 6.19 |
| Bitdeer | $1,926 | $3,417 | n/a | 64% | 86 | 8,730 | $61,000 | $812 | 3.70 |
| HIVE Digital | $522 | $678 | 35% | 47% | 24 | 3,600 | $60,000 | $331 | 1.92 |
| Cango Inc. | $51 | $92 | 6% | 27% | 28 | 2,841 | $73,000 | $205 | 0.45 |
| Average (excl. outliers) | 45% | 63% | 36 | 4,735 | $70,625 | 3.95 | |||
| Cango (Discount) | -89% | ||||||||
| Cango (Fair Value @ Average EV/R) - 90% discount | $1.97 |
| AI/HC Larger Players | MCAP ($M) | Enterprise Value (EV, $M) | Gross Margin | Debt / Capital | EV/R (f) |
|---|---|---|---|---|---|
| Nebius Group N.V. | $42,011 | $44,165 | 74% | 50% | 14.61 |
| CoreWeave, Inc. | $30,439 | $76,468 | 67% | 91% | 6.13 |
| IREN Limited | $10,020 | $11,965 | 68% | 65% | 4.54 |
| Hut 8 Corp. | $7,762 | $15,508 | 62% | 81% | 53.62 |
| TeraWulf Inc. | $5,978 | $8,595 | 69% | 97% | 35.27 |
| Applied Digital Corporation | $5,392 | $11,123 | 22% | 63% | 12.15 |
| Cipher Digital Inc. | $3,199 | $7,981 | n/a | 91% | 38.15 |
| Bit Digital, Inc. | $302 | $821 | 57% | 46% | 5.68 |
| Average (excl. outliers) | 60% | 73% | 8.62 | ||
| Cango (Fair Value @ Average EV/R) - 90% Discount | $2.86 |
| Consolidated Fair Value (Sum of Parts + Working Capital - LT Debt) | $3.83 |
|---|
We are initiating coverage with a BUY rating, and a fair value estimate of $4.60/share, based on the average of our two valuation methodologies. We believe Cango offers an attractive, albeit high-risk, opportunity, combining an established Bitcoin mining business, with significant AI/HPC growth potential in a rapidly expanding market. Following a 97% YoY share price decline, its 88% discount to Bitcoin mining comparables may offer substantial upside, if management successfully executes its AI/HPC strategy, and captures market share.
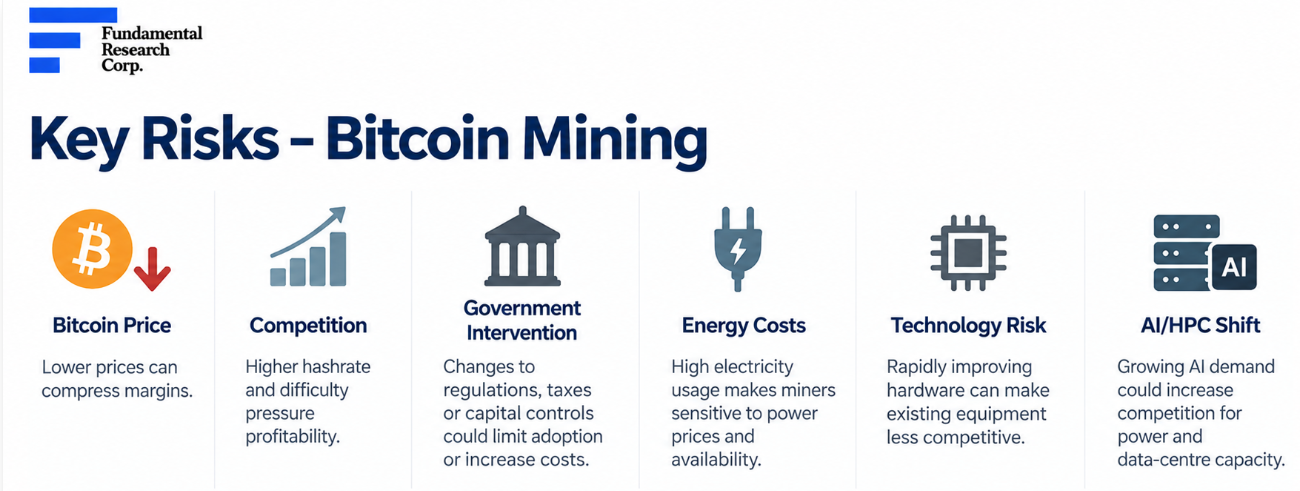
We are assigning a risk rating of 4 (Speculative). We believe the company is exposed to the following key risks (not exhaustive):
| INCOME STATEMENTS ($M) YE December 31 |
2025 | 2026E | 2027E |
|---|---|---|---|
| Revenue | $688.10 | $228.52 | $233.47 |
| Cost of revenue | -$543.30 | -$213.71 | -$196.94 |
| Gross profit | $144.80 | $14.81 | $36.53 |
| G&A | -$28.90 | -$30.60 | -$36.72 |
| EBITDA | $115.90 | -$15.79 | -$0.19 |
| Adj. EBITDA (incl. FV changes) | $24.52 | -$91.29 | -$0.19 |
| Depreciation | -$116.60 | -$97.23 | -$106.95 |
| EBIT | -$0.70 | -$113.02 | -$107.14 |
| Interest expense | -$20.00 | -$15.33 | -$16.86 |
| Impairment & other | -$434.80 | -$202.50 | |
| Net income (loss) | -$452.80 | -$330.85 | -$124.00 |
| EPS | -$16.00 | -$8.07 | -$3.02 |
| CASH FLOW STATEMENTS ($M) YE December 31 |
2025 | 2026E | 2027E |
|---|---|---|---|
| Net income (loss) | -$621.95 | -$330.85 | -$124.00 |
| Non-cash items & working capital changes | $512.12 | $211.29 | $73.64 |
| Cash flow from operating activities | -$109.83 | -$119.56 | -$50.37 |
| Capital expenditures & mining equipment | -$114.78 | -$55.00 | -$160.00 |
| Investments & other investing activities | $193.46 | ||
| Cash flow from investing activities | $78.68 | -$55.00 | -$160.00 |
| Debt & financing activities | -$148.17 | -$487.80 | $140.00 |
| Share issuances / other financing | -$0.75 | $0.00 | $79.95 |
| Cash flow from financing activities | -$148.92 | -$487.80 | $219.95 |
| BALANCE SHEETS ($M) YE December 31 |
2025 | 2026E | 2027E |
|---|---|---|---|
| ASSETS | |||
| Cash & cash equivalents | $41.20 | $8.84 | $18.42 |
| Cryptocurrencies | $0.04 | $12.90 | $12.90 |
| Receivables & other current assets | $83.86 | $92.24 | $101.47 |
| Assets of discontinued operations | - | - | - |
| Total current assets | $125.10 | $113.98 | $132.79 |
| Mining machines | $248.70 | $46.20 | $46.20 |
| Bitcoin collateral receivable | $663.00 | $79.95 | $0.00 |
| PP&E | $96.20 | $53.97 | $107.02 |
| Total non-current assets | $1,007.90 | $180.12 | $153.22 |
| TOTAL ASSETS | $1,133.00 | $294.10 | $286.01 |
| LIABILITIES | |||
| Current liabilities | |||
| Debt | $0.00 | $8.00 | $8.00 |
| Other current liabilities | $176.80 | $124.41 | $136.85 |
| Total current liabilities | $176.80 | $132.41 | $144.85 |
| Debt | $557.60 | $61.80 | $201.80 |
| Other long-term liabilities | $1.60 | $1.60 | $1.60 |
| Total long-term liabilities | $559.20 | $63.40 | $203.40 |
| TOTAL LIABILITIES | $736.00 | $195.81 | $348.25 |
| Shareholders' equity | $397.00 | $98.29 | -$62.25 |
| TOTAL LIABILITIES + EQUITY | $1,133.00 | $294.10 | $286.01 |
Sid Rajeev, B.Tech, MBA, CFA — Head of Research, Fundamental Research Corp.
The full report — the designed PDF with all charts and the complete disclosure — remains available as published, free of charge with a free account. This page is the same analysis in the form a search engine, an AI assistant and a phone screen can read.
Buy – Fair value is 12% above the current market price; or risk and reward is favorable
Hold – Fair value is between 5% to 12% above the current market price
Sell – Fair value is 5% above, or less, than the current market value; or risk and reward is unfavorable
Suspended or Rating N/A— Coverage and ratings suspended until more information can be obtained from the company regarding recent events.
1 (Low Risk) - The company operates in an industry where it has a strong position (for example a monopoly, high market share etc.) or operates in a regulated industry. The future outlook is stable or positive for the industry. The company generates positive free cash flow and has a history of profitability. The capital structure is conservative with little or no debt.
2 (Below Average Risk) - The company operates in an industry where the fundamentals and outlook are positive. The industry and company are relatively less sensitive to systematic risk than companies with a Risk Rating of 3. The company has a history of profitability and has demonstrated its ability to generate positive free cash flows (though current free cash flow may be negative due to capital investment). The company’s capital structure is conservative with little to modest use of debt.
3 (Average Risk) - The company operates in an industry that has average sensitivity to systematic risk. The industry may be cyclical. Profits and cash flow are sensitive to economic factors although the company has demonstrated its ability to generate positive earnings and cash flow. Debt use is in line with industry averages, and coverage ratios are sufficient.
4 (Speculative) - The company has little or no history of generating earnings or cash flow. Debt use is higher. These companies may be in start-up mode or in a turnaround situation. These companies should be considered speculative.
5 (Highly Speculative) - The company has no history of generating earnings or cash flow. They may operate in a new industry with new, and unproven products. Products may be at the development stage, testing, or seeking regulatory approval. These companies may run into liquidity issues and may rely on external funding. These stocks are considered highly speculative.
Definition of FRC’s Fair Value Estimate – Our fair value estimate is the theoretical value of the company’s equity using widely accepted methods of valuation such as discount cash flow or comparables. IT IS NOT A TARGET PRICE or PREDICTION OF THE FUTURE STOCK PRICE.
Analyst Certification: The views expressed in this report accurately reflect the personal views of the analyst, and no part of their compensation was, is, or will be directly or indirectly related to the specific recommendation or views expressed.
Any “forward looking statements” are our best estimates and opinions based upon information that is publicly available and that we believe to be correct, but we have not independently verified with respect to truth or correctness. There is no guarantee that our forecasts will materialize. Actual results will likely vary. The analyst and Fundamental Research Corp. “FRC” do not own any shares of the subject company, do not make a market or offer shares for sale of the subject company, and do not have any investment banking business with the subject company. Fees ranging between $25,000 and $35,000 will be paid to FRC by Cango Inc. to commission this report, research coverage, and distribution of reports. This fee creates a potential conflict of interest which readers should consider. FRC takes steps to mitigate conflicts including setting fees in advance and utilizing analysts who must abide by CFA Institute Code of Ethics and Standards of Professional Conduct. Additionally, analysts may not trade in any security under coverage. Our full editorial control of all research, timing of release of the reports, and release of liability for negative reports are protected contractually. The issuer has agreed to a minimum coverage term and coverage cannot be unilaterally terminated. Distribution procedure: our reports are distributed first to our web-based subscribers on the date shown on this report then made available to delayed access users through various other channels for a limited time.
The distribution of FRC’s ratings are as follows: BUY (76%), HOLD (2%), SELL / SUSPEND (28%).
This report contains "forward looking" statements. Forward-looking statements regarding the Company and/or stock’s performance inherently involve risks and uncertainties that could cause actual results to differ from such forward-looking statements. Factors that would cause or contribute to such differences include, but are not limited to, continued acceptance of the Company's products/services in the marketplace; acceptance in the marketplace of the Company's new product lines/services; competitive factors; new product/service introductions by others; technological changes; dependence on suppliers; systematic market risks and other risks discussed in the Company's periodic report filings, including interim reports, annual reports, and annual information forms filed with the various securities regulators. By making these forward-looking statements, Fundamental Research Corp. and the analyst/author of this report undertakes no obligation to update these statements for revisions or changes after the date of this report. A report initiating coverage will most often be updated quarterly while a report issuing a rating may have no further or less frequent updates because the subject company is likely to be in earlier stages where nothing material may occur quarter to quarter.
Fundamental Research Corp DOES NOT MAKE ANY WARRANTIES, EXPRESSED OR IMPLIED, AS TO RESULTS TO BE OBTAINED FROM USING THIS INFORMATION AND MAKES NO EXPRESS OR IMPLIED WARRANTIES OR FITNESS FOR A PARTICULAR USE. ANYONE USING THIS REPORT ASSUMES FULL RESPONSIBILITY FOR WHATEVER RESULTS THEY OBTAIN FROM WHATEVER USE THE INFORMATION WAS PUT TO. ALWAYS TALK TO YOUR FINANCIAL ADVISOR BEFORE YOU INVEST. WHETHER A STOCK SHOULD BE INCLUDED IN A PORTFOLIO DEPENDS ON ONE’S RISK TOLERANCE, OBJECTIVES, SITUATION, RETURN ON OTHER ASSETS, ETC. ONLY YOUR INVESTMENT ADVISOR WHO KNOWS YOUR UNIQUE CIRCUMSTANCES CAN MAKE A PROPER RECOMMENDATION AS TO THE MERIT OF ANY PARTICULAR SECURITY FOR INCLUSION IN YOUR PORTFOLIO. This REPORT is solely for informative purposes and is not a solicitation or an offer to buy or sell any security. It is not intended as being a complete description of the company, industry, securities or developments referred to in the material. Any forecasts contained in this report were independently prepared unless otherwise stated and HAVE NOT BEEN endorsed by the Management of the company which is the subject of this report. Additional information is available upon request. THIS REPORT IS COPYRIGHT. YOU MAY NOT REDISTRIBUTE THIS REPORT WITHOUT OUR PERMISSION. Please give proper credit, including citing Fundamental Research Corp and/or the analyst, when quoting information from this report. The information contained in this report is intended to be viewed only in jurisdictions where it may be legally viewed and is not intended for use by any person or entity in any jurisdiction where such use would be contrary to local regulations or which would require any registration requirement within such jurisdiction.
Discussion
Comments reflect the views of individual users, not FRC. Nothing posted in the comments section — by users or otherwise — should be taken as investment advice.