
Yield declined 1.37 pp YoY to 7.16%, below our 7.64% forecast, due to lower market rates, and management’s increased focus on first mortgages, which generally carry lower risk, and lending rates. We project a FY2027 yield of 6.83%, vs. 7.16% in FY2026.

Prioritizing Lower-Risk Lending Amid Rate Uncertainty and Real Estate Weakness
Paused · 10:10 left · FRC · read by an AI voice
Disclosure: Antrim Investments Ltd. has paid FRC a fee for research coverage and distribution of reports. This fee creates a potential conflict of interest which readers should consider. See last page for other important disclosures, rating, and risk definitions.
All figures in C$ unless otherwise specified.
| Offering Summary | |
|---|---|
| Issuer | Antrim Balanced Mortgage Fund Ltd. |
| Securities Offered | Preferred Shares |
| Unit Price | $1 |
| Management Fee | 1.0% - 1.5% p.a. depending on the type of Preferred Shares |
| Distribution to Investors | 100% of annual net income, paid quarterly |
| Auditor | Grant Thornton |
Antrim remains one of the largest MICs in Canada.
Mortgage Investment Corporations (MICs) by AUM – June 2026
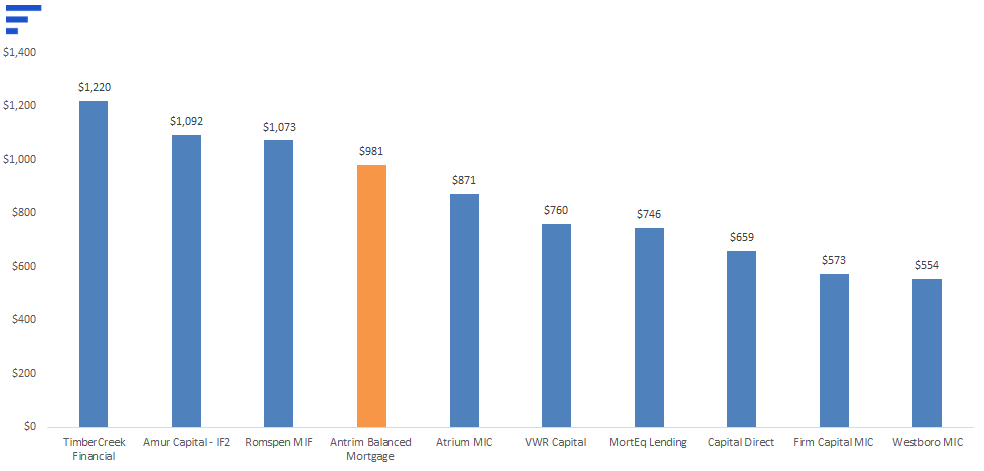
Antrim’s lower yield reflects its greater reliance on first mortgages, and limited use of leverage. The table below compares Antrim’s portfolio with other MICs (AUM >$100M) focused on single-family residential properties.
| Antrim | Average | |
|---|---|---|
| First Mortgage | 88% | 76% |
| B.C. | 57% | 37% |
| ON | 35% | 49% |
| AB | 8% | 10% |
| Others | 0% | 4% |
| LTV | 60% | 59% |
| Yield | 7.2% | 8.3% |
| Debt to Capital | 4% | 19% |
| Average Loan Size | $483,818 | $468,556 |
| Stage Three % of Mortgages | 5.9% | 5.9% |
| Allowances % of Mortgages | 0.1% | 0.8% |
The sector has seen two notable transactions recently:
Discussions with MIC managers indicate that several are actively pursuing M&A to scale their platforms, capture synergies, and reduce administrative, operational, and staffing costs. We believe these efficiencies could support higher yields, and attract additional capital.
While Antrim has not indicated any acquisition plans, we would not be surprised to see it pursue a strategic transaction, or attract a bid from a larger player.
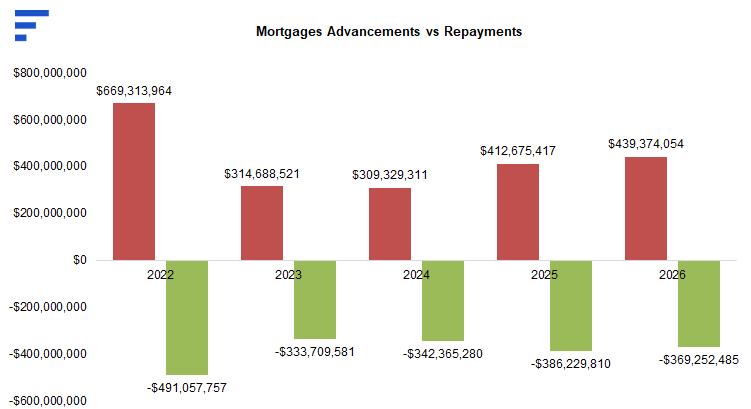
In FY2026, mortgage advancements increased 6% YoY, while repayments declined 4% YoY.
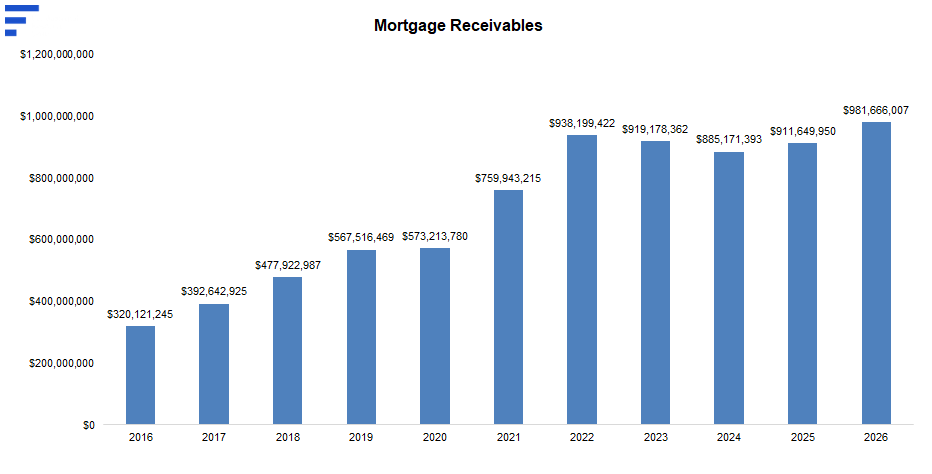
As a result, mortgage receivables increased 8% YoY to a record $982M, exceeding our estimate of $944M.
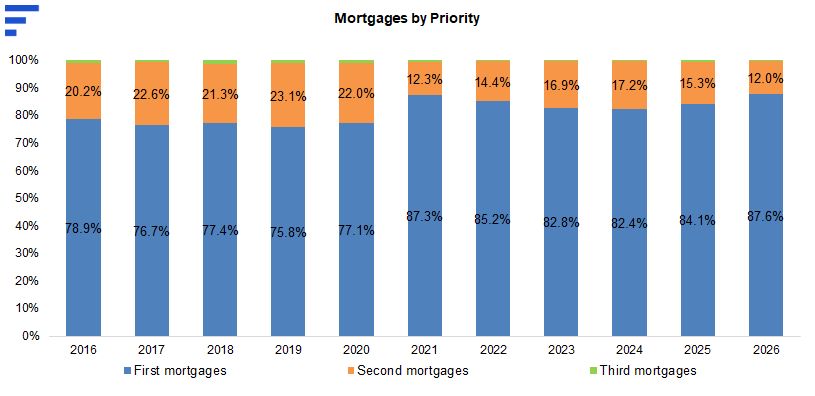
First-mortgage exposure increased 4 pp YoY to 88%, indicating a lower-risk profile.
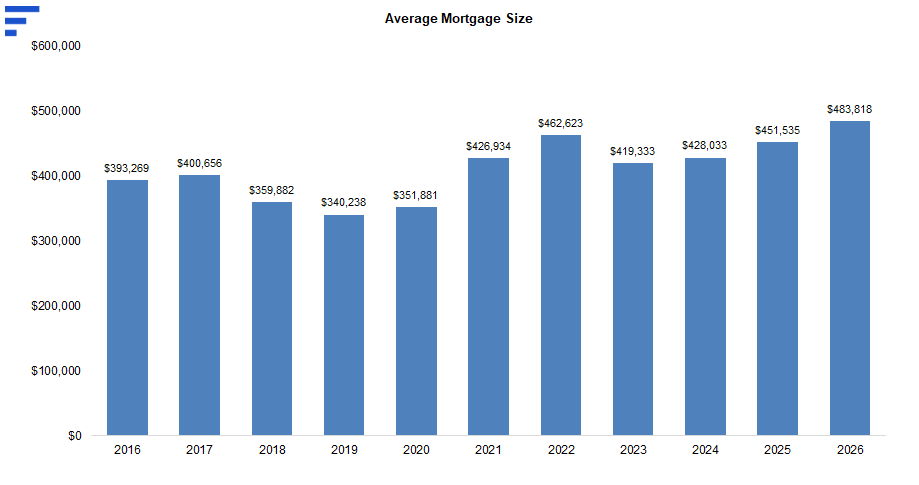
Average mortgage size increased 7% YoY to ~$484,000.
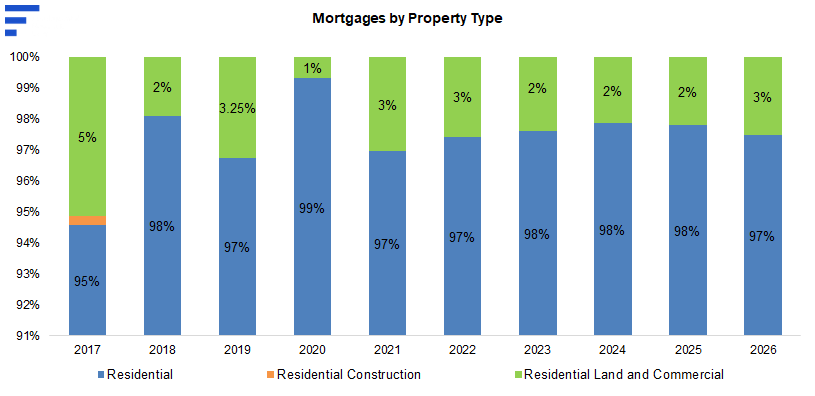
Antrim remains focused on completed single-family residential units, which we view as the lowest-risk real estate segment.
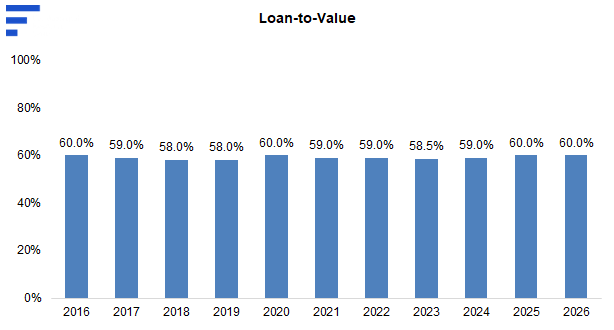
Loan-to-value (LTV) remained unchanged.
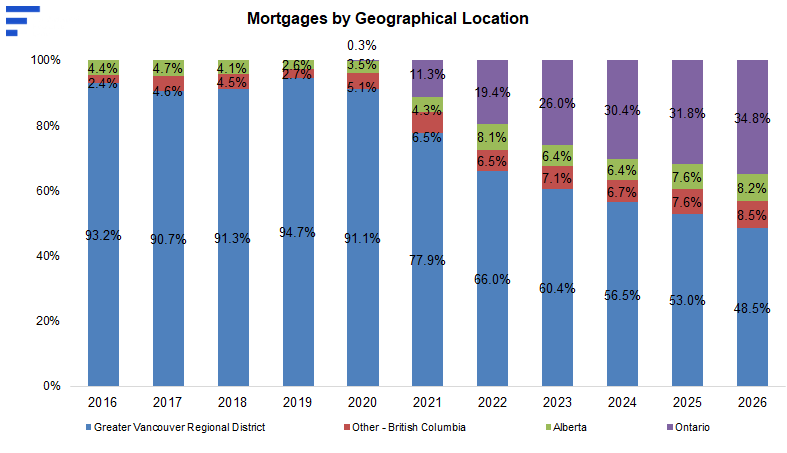
Ontario and Alberta exposure increased, while B.C. exposure declined, improving diversification.
Lending rates declined amid lower market rates, and increased first-mortgage exposure.
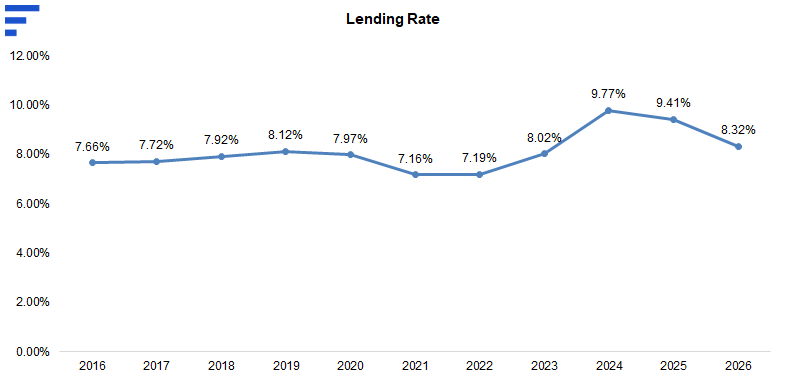
Foreclosures and delinquencies increased 141% YoY to $58M, but remained in line with the sector average at 5.9% of receivables. Loan loss allowances remained stable at 0.1% of receivables versus 0.8% for the sector, suggesting limited expected losses despite rising delinquencies.
| 2022 | 2023 | 2024 | 2025 | 2026 | |
|---|---|---|---|---|---|
| No. of Delinquencies | 14 | 22 | 19 | 16 | 37 |
| Foreclosures | 1 | 2 | 5 | 14 | 26 |
| Value | $7,806,281 | $21,026,199 | $21,176,015 | $23,929,768 | $57,766,677 |
| % of Total Mortgages | 0.8% | 2.3% | 2.4% | 2.6% | 5.9% |
| Loan loss provisions | $100,000 | $0 | -$200,000 | $98,000 | -$148,000 |
| Loan loss allowance (year-end) | $1,000,000 | $1,000,000 | $800,000 | $898,000 | $750,000 |
| Allowances (% of receivables) | 0.11% | 0.11% | 0.09% | 0.10% | 0.08% |
| Realized losses (FRC est.) | $0 | $33,718 | $128,135 | $0 | $1,076,512 |
| Actual Losses (% of mortgages) | 0.00% | 0.004% | 0.01% | 0.00% | 0.11% |
| Reinvested | $23,217,743 | $24,858,791 | $28,693,504 | $39,181,891 | $38,785,225 |
| Reinvested (% of distributions) | 54% | 53% | 52% | 57% | 60% |
| Redemptions | $125,239,122 | $170,674,158 | $135,167,980 | $122,080,110 | $169,103,821 |
| Redemption (% of invested capital) | 16.6% | 21.9% | 17.7% | 15.1% | 18.8% |
In FY2026, 60% of distributions were reinvested, reflecting continued investor confidence in management. Debt-to-capital declined YoY, from 6% to 4%, reflecting management’s conservative leverage policy vs. 35%–45% for most MICs to boost yields.
| Balance Sheet | 2021 | 2022 | 2023 | 2024 | 2025 | 2026 |
|---|---|---|---|---|---|---|
| Assets | ||||||
| Cash | - | - | 8,461,427 | 5,678,472 | 4,384,669 | 1,314 |
| AR / prepaid expenses | $267,151 | $4,490,179 | $5,477,919 | $6,290,037 | $6,205,947 | $6,922,346 |
| Interest receivable | $3,497,325 | - | - | - | - | - |
| Properties held for sale | $971,000 | $971,000 | - | |||
| Mortgages receivable | $759,043,215 | $937,199,422 | $918,178,362 | $884,371,393 | $910,751,950 | $980,916,007 |
| Software | $175,671 | $194,111 | $243,225 | $200,544 | $154,322 | $130,553 |
| Total Assets | $762,983,362 | $941,883,712 | $932,360,933 | $897,511,446 | $922,467,888 | $987,970,220 |
| Liabilities | ||||||
| Bank indebtedness | $58,129,011 | $143,768,364 | $151,545,367 | $113,100,000 | $52,550,000 | $36,533,991 |
| Accounts payable & others | $1,349,519 | $456,173 | $1,415,109 | $1,819,896 | $1,880,487 | $1,719,208 |
| Dividends payable | $5,609,146 | $5,894,055 | $6,983,590 | $10,200,616 | $10,524,817 | $6,794,051 |
| Total Liabilities | $65,087,676 | $150,118,592 | $159,944,066 | $125,120,512 | $64,955,304 | $45,047,250 |
| Preferred shares - Class A | $208,525,471 | $214,592,359 | $215,953,553 | $218,196,633 | $242,601,451 | $251,542,277 |
| Preferred shares - Class B Series B | $132,841,999 | $158,211,550 | $127,509,941 | $124,353,558 | $131,825,002 | $140,473,482 |
| Preferred shares - Class B Series C | $356,828,986 | $419,261,982 | $429,254,144 | $430,141,514 | $483,386,902 | $551,207,982 |
| Share capital | $11 | $10 | $10 | $10 | $10 | $10 |
| Deficit | -$300,781 | -$300,781 | -$300,781 | -$300,781 | -$300,781 | -$300,781 |
| Total Shareholders' Equity | $697,895,686 | $791,765,120 | $772,416,867 | $772,390,934 | $857,512,584 | $942,922,970 |
| SE + Liabilities | $762,983,362 | $941,883,712 | $932,360,933 | $897,511,446 | $922,467,888 | $987,970,220 |
| Debt to Capital | 7.7% | 15.4% | 15.5% | 12.1% | 5.3% | 3.7% |
| Mortgages | $759,043,215 | $937,199,422 | $918,178,362 | $885,342,393 | $911,722,950 | $980,916,007 |
| Debt as % of Mortgage | 7.7% | 15.3% | 16.5% | 12.8% | 5.8% | 3.7% |
In summary, we believe the portfolio’s risk profile remain broadly unchanged. Despite rising defaults and foreclosures, levels remain in line with the sector average.
| Risk Profile | |
|---|---|
| Average Mortgage | ↑ (red) |
| Diversification | ↑ (green) |
| Debt to Capital | ↓ (green) |
| Priority | ↑ (green) |
| Property Type | - |
| LTV | - |
| Impaired Mortgages | ↑ (red) |
We believe higher first-mortgage exposure, greater geographic diversification, and lower debt levels help offset the risks associated with rising defaults. FY2026 revenue declined 6% YoY, 3% below our estimate, due to lower-than-expected lending rates. Also, net income declined 7% YoY, 4% below our estimate.
| Income Statement | 2022 | 2023 | 2024 | 2025 | 2026 | YoY |
|---|---|---|---|---|---|---|
| Revenue | ||||||
| Interest Income | $56,311,461 | $71,224,518 | $79,666,942 | $87,136,793 | $81,668,463 | -6% |
| Fees | $62,797 | $191,186 | $310,722 | $337,882 | $291,830 | -14% |
| Total Revenue | $56,374,258 | $71,415,704 | $79,977,664 | $87,474,675 | $81,960,293 | -6% |
| Expenses | ||||||
| Management fees and trailer fees | $10,778,361 | $12,704,714 | $12,211,559 | $12,273,296 | $12,973,636 | 6% |
| Interest and bank charges | $1,944,003 | $10,395,227 | $11,319,018 | $4,941,809 | $2,482,228 | -50% |
| G&A | $899,532 | $1,462,525 | $1,298,130 | $1,348,665 | $1,276,248 | -5% |
| Property losses | $33,718 | $128,135 | -$32,950 | $1,076,512 | ||
| Mortgage losses (recovery) | 100,000 | $0 | -$200,000 | $98,000 | -$148,000 | |
| $13,721,896 | $24,596,184 | $24,756,842 | $18,628,820 | $17,660,624 | -5% | |
| Net Income | $42,652,362 | $46,819,520 | $55,220,822 | $68,845,855 | $64,299,669 | -7% |
| % of Mortgage Receivable | 2022 | 2023 | 2024 | 2025 | 2026 |
|---|---|---|---|---|---|
| Interest Income | 6.64% | 7.68% | 8.83% | 9.70% | 8.63% |
| Fees | 0.01% | 0.02% | 0.03% | 0.04% | 0.03% |
| 6.65% | 7.70% | 8.87% | 9.74% | 8.66% | |
| Less: | |||||
| Management fees and trailer fees | -1.27% | -1.37% | -1.35% | -1.37% | -1.37% |
| Unrealized losses / Provisions | -0.01% | 0.00% | 0.02% | -0.01% | 0.02% |
| Interest and bank charges | -0.23% | -1.12% | -1.26% | -0.55% | -0.26% |
| G&A | -0.11% | -0.16% | -0.16% | -0.15% | -0.25% |
| Net | 5.03% | 5.05% | 6.12% | 7.66% | 6.79% |
| Yield as a % of Invested Capital | 5.73% | 5.99% | 7.15% | 8.45% | 7.14% |
Yield declined 1.37 pp YoY to 7.16%, below our 7.64% forecast.
| Investors' Returns | 2022 | 2023 | 2024 | 2025 | 2026 |
|---|---|---|---|---|---|
| Antrim Class A | 5.50% | 5.86% | 7.14% | 8.58% | 7.18% |
| Antrim Class B Series B | 5.00% | 5.36% | 6.64% | 8.08% | 6.68% |
| Antrim Class B Series C | 6.01% | 6.36% | 7.64% | 9.08% | 7.68% |
| Overall | 6.01% | 6.36% | 7.24% | 8.53% | 7.16% |
| Financial Summary | 2024 | 2025 | 2026 | 2027E | 2028E |
|---|---|---|---|---|---|
| Mortgage Investments (net) | $884,371,393 | $910,751,950 | $980,916,007 | $1,010,343,487 | $1,040,653,792 |
| Debt as % of Mortgage Outstanding | 12.79% | 5.77% | 3.72% | 3.56% | 3.51% |
| Revenue | $79,977,664 | $87,474,675 | $81,960,293 | $83,235,680 | $87,481,187 |
| Net Income | $55,220,822 | $68,845,855 | $64,299,669 | $65,451,143 | $69,229,414 |
| Net Asset Value | $1.0 | $1.0 | $1.0 | $1.0 | $1.0 |
| Yield | 7.24% | 8.53% | 7.16% | 6.83% | 7.01% |
We expect yields to decline in FY2027, reflecting lower average expected lending rates compared to FY2026. Specifically, we forecast a yield of 6.83% in FY2027, down from 7.16% in FY2026.
| FY2027 Yield (FRC Forecast) | YoY Decline in the Weighted Average Lending Rate in FY2027 | |||||
|---|---|---|---|---|---|---|
| 0.00% | 0.15% | 0.30% | 0.50% | 1.00% | ||
| Loan Loss Provisions % of Receivables (FY2027) | 0.00% | 7.20% | 7.04% | 6.88% | 6.68% | 6.15% |
| 0.03% | 7.17% | 7.01% | 6.86% | 6.65% | 6.13% | |
| 0.05% | 7.15% | 6.99% | 6.83% | 6.62% | 6.10% | |
| 0.25% | 6.94% | 6.78% | 6.63% | 6.42% | 5.90% | |
| 0.50% | 6.68% | 6.53% | 6.37% | 6.16% | 5.64% | |
We are reiterating our overall rating of 2, and risk rating of 2.
Our FY2027 yield forecast ranges from 6.42% to 7.01%, depending on lending rates and loan loss provisions.
| FRC Rating | |
|---|---|
| Expected Yield (FY2027E) | 6.83% |
| Rating | 2 |
| Risk | 2 |
Antrim continues to grow its mortgage portfolio while prioritizing lower-risk first mortgages, amid interest rate uncertainty, and weakness in real estate markets. While rising delinquencies warrant monitoring, they remain broadly in line with the sector average, and low loan loss allowances suggest limited expected losses.
Antrim’s focus on mortgages secured by completed single-family homes, rather than higher-risk development and construction projects, supports our risk assessment. We believe its conservative LTV ratios, high first-mortgage exposure, and low debt levels position it well to weather continued weakness in the real estate sector.
We believe the MIC is exposed to the following key risks (not exhaustive):
| Income Statement | 2022 | 2023 | 2024 | 2025 | 2026 | 2027E | 2028E |
|---|---|---|---|---|---|---|---|
| Revenue | |||||||
| Interest Income | $56,311,461 | $71,224,518 | $79,666,942 | $87,136,793 | $81,668,463 | $82,937,107 | $87,167,384 |
| Fees | $62,797 | $191,186 | $310,722 | $337,882 | $291,830 | $298,574 | $313,803 |
| Total Revenue | $56,374,258 | $71,415,704 | $79,977,664 | $87,474,675 | $81,960,293 | $83,235,680 | $87,481,187 |
| Expenses | |||||||
| Management fees and trailer fees | $10,778,361 | $12,704,714 | $12,211,559 | $12,273,296 | $12,973,636 | $13,624,615 | $14,033,353 |
| Interest and bank charges | $1,944,003 | $10,395,227 | $11,319,018 | $4,941,809 | $2,482,228 | $2,176,020 | $2,175,000 |
| G&A | $899,532 | $1,462,525 | $1,298,130 | $1,348,665 | $1,276,248 | $1,493,445 | $1,538,248 |
| Property losses | $33,718 | $128,135 | -$32,950 | $1,076,512 | $490,458 | $505,172 | |
| Mortgage losses (recovery) | 100,000 | $0 | -$200,000 | $98,000 | -$148,000 | ||
| $13,721,896 | $24,596,184 | $24,756,842 | $18,628,820 | $17,660,624 | $17,784,537 | $18,251,773 | |
| Net Income | $42,652,362 | $46,819,520 | $55,220,822 | $68,845,855 | $64,299,669 | $65,451,143 | $69,229,414 |
| Cash Flow Statement | 2027E | 2028E |
|---|---|---|
| Operating Activities | ||
| Net Income | $65,451,143 | $69,229,414 |
| $65,451,143 | $69,229,414 | |
| Changes in non-cash working capital: | ||
| Accounts receivable | -$207,670 | -$213,900 |
| Accounts payable | $255,398 | $263,060 |
| $47,727 | $49,159 | |
| Cash flow from Operating Activities | $65,498,871 | $69,278,573 |
| Investing Activities | ||
| Purchase of software | -$40,000 | -$40,000 |
| Mortgages | -$29,427,480 | -$30,310,305 |
| Cash flow from Investing Activities | -$29,467,480 | -$30,350,305 |
| Financing Activities | ||
| Class A preferred shares issued, net | $10,000,000 | $10,000,000 |
| Series B preferred shares issued, net | $5,000,000 | $5,000,000 |
| Series C preferred shares issued, net | $15,000,000 | $15,000,000 |
| Dividends paid in cash | -$65,451,143 | -$69,229,414 |
| Bank Debt | -$533,991 | $500,000 |
| Cash from Financing Activities | -$35,985,134 | -$38,729,414 |
| Balance Sheet | 2022 | 2023 | 2024 | 2025 | 2026 | 2027E | 2028E |
|---|---|---|---|---|---|---|---|
| Assets | |||||||
| Cash | - | 8,461,427 | 5,678,472 | 4,384,669 | 1,314 | 47,570 | 246,425 |
| AR / prepaid expenses | $4,490,179 | $5,477,919 | $6,290,037 | $6,205,947 | $6,922,346 | $7,130,016 | $7,343,917 |
| Properties held for sale | $971,000 | $971,000 | - | - | - | ||
| Mortgages receivable | $937,199,422 | $918,178,362 | $884,371,393 | $910,751,950 | $980,916,007 | $1,010,343,487 | $1,040,653,792 |
| $941,689,601 | $932,117,708 | $897,310,902 | $922,313,566 | $987,839,667 | $1,017,521,074 | $1,048,244,133 | |
| Software | $194,111 | $243,225 | $200,544 | $154,322 | $130,553 | $170,553 | $210,553 |
| Total Assets | $941,883,712 | $932,360,933 | $897,511,446 | $922,467,888 | $987,970,220 | $1,017,691,627 | $1,048,454,686 |
| Liabilities | |||||||
| Bank indebtedness | $143,768,364 | $151,545,367 | $113,100,000 | $52,550,000 | $36,533,991 | $36,000,000 | $36,500,000 |
| Accounts payable & others | $456,173 | $1,415,109 | $1,819,896 | $1,880,487 | $1,719,208 | $1,770,784 | $1,823,908 |
| Dividends payable | $5,894,055 | $6,983,590 | $10,200,616 | $10,524,817 | $6,794,051 | $6,997,873 | $7,207,809 |
| Total Liabilities | $150,118,592 | $159,944,066 | $125,120,512 | $64,955,304 | $45,047,250 | $44,768,657 | $45,531,716 |
| Preferred shares - Class A | $214,592,359 | $215,953,553 | $218,196,633 | $242,601,451 | $251,542,277 | $261,542,277 | $271,542,277 |
| Preferred shares - Class B Series B | $158,211,550 | $127,509,941 | $124,353,558 | $131,825,002 | $140,473,482 | $145,473,482 | $150,473,482 |
| Preferred shares - Class B Series C | $419,261,982 | $429,254,144 | $430,141,514 | $483,386,902 | $551,207,982 | $566,207,982 | $581,207,982 |
| Share capital | $10 | $10 | $10 | $10 | $10 | $10 | $10 |
| Deficit | -$300,781 | -$300,781 | -$300,781 | -$300,781 | -$300,781 | -$300,781 | -$300,781 |
| Total Shareholders' Equity | $791,765,120 | $772,416,867 | $772,390,934 | $857,512,584 | $942,922,970 | $972,922,970 | $1,002,922,970 |
| SE + Liabilities | $941,883,712 | $932,360,933 | $897,511,446 | $922,467,888 | $987,970,220 | $1,017,691,627 | $1,048,454,686 |
| Debt to Capital | 15.4% | 15.5% | 12.1% | 5.3% | 3.7% | 3.6% | 3.5% |
| Mortgages | $937,199,422 | $918,178,362 | $885,342,393 | $911,722,950 | $980,916,007 | $1,010,343,487 | $1,040,653,792 |
| Debt as % of Mortgage | 15.3% | 16.5% | 12.8% | 5.8% | 3.7% | 3.6% | 3.5% |
Sid Rajeev, B.Tech, MBA, CFA — Head of Research, Fundamental Research Corp.
The full report — the designed PDF with all charts and the complete disclosure — remains available as published, free of charge with a free account. This page is the same analysis in the form a search engine, an AI assistant and a phone screen can read.
Rating – 1: Excellent Return to Risk Ratio
Rating – 2: Very Good Return to Risk Ratio
Rating – 3: Good Return to Risk Ratio
Rating – 4: Average Return to Risk Ratio
Rating – 5: Weak Return to Risk Ratio
Rating – 6: Very Weak Return to Risk Ratio
Rating – 7: Poor Return to Risk Ratio
A “+” indicates the rating is in the top third of the category, A “-“ indicates the lower third and no “+” or “-“ indicates the middle third of the category.
1 (Low Risk)
2 (Below Average Risk)
3 (Average Risk)
4 (Speculative)
5 (Highly Speculative)
Disclaimers and Disclosure
Analyst Certification: The views expressed in this report accurately reflect the personal views of the analyst, and no part of their compensation was, is, or will be directly or indirectly related to the specific recommendation or views expressed.
Any “forward looking statements” are our best estimates and opinions based upon information that is publicly available and that we believe to be correct, but we have not independently verified with respect to truth or correctness. There is no guarantee that our forecasts will materialize. Actual results will likely vary. The analyst and Fundamental Research Corp. “FRC” does not own any shares of the subject company, does not make a market or offer shares for sale of the subject company, and does not have any investment banking business with the subject company. Fees ranging between $5,000 and $15,000 have been paid to FRC by Antrim to commission this report, research coverage, and distribution of reports. This fee creates a potential conflict of interest which readers should consider. FRC takes steps to mitigate conflicts including setting fees in advance and utilizing analysts who must abide by CFA Institute Code of Ethics and Standards of Professional Conduct. Additionally, analysts may not trade in any security under coverage. Our full editorial control of all research, timing of release of the reports, and release of liability for negative reports are protected contractually. The issuer has agreed to a minimum coverage term and coverage cannot be unilaterally terminated. Distribution procedure: our reports are distributed first to our web-based subscribers on the date shown on this report then made available to delayed access users through various other channels for a limited time.
This report contains "forward looking" statements. Forward-looking statements regarding the Company and/or stock’s performance inherently involve risks and uncertainties that could cause actual results to differ from such forward-looking statements. Factors that would cause or contribute to such differences include, but are not limited to, continued acceptance of the Company's products/services in the marketplace; acceptance in the marketplace of the Company's new product lines/services; competitive factors; new product/service introductions by others; technological changes; dependence on suppliers; systematic market risks and other risks discussed in the Company's periodic report filings, including interim reports, annual reports, and annual information forms filed with the various securities regulators. By making these forward-looking statements, Fundamental Research Corp. and the analyst/author of this report undertakes no obligation to update these statements for revisions or changes after the date of this report. A report initiating coverage will most often be updated quarterly while a report issuing a rating may have no further or less frequent updates because the subject company is likely to be in earlier stages where nothing material may occur quarter to quarter.
Fundamental Research Corp DOES NOT MAKE ANY WARRANTIES, EXPRESSED OR IMPLIED, AS TO RESULTS TO BE OBTAINED FROM USING THIS INFORMATION AND MAKES NO EXPRESS OR IMPLIED WARRANTIES OR FITNESS FOR A PARTICULAR USE. ANYONE USING THIS REPORT ASSUMES FULL RESPONSIBILITY FOR WHATEVER RESULTS THEY OBTAIN FROM WHATEVER USE THE INFORMATION WAS PUT TO. ALWAYS TALK TO YOUR FINANCIAL ADVISOR BEFORE YOU INVEST. WHETHER A STOCK SHOULD BE INCLUDED IN A PORTFOLIO DEPENDS ON ONE’S RISK TOLERANCE, OBJECTIVES, SITUATION, RETURN ON OTHER ASSETS, ETC. ONLY YOUR INVESTMENT ADVISOR WHO KNOWS YOUR UNIQUE CIRCUMSTANCES CAN MAKE A PROPER RECOMMENDATION AS TO THE MERIT OF ANY PARTICULAR SECURITY FOR INCLUSION IN YOUR PORTFOLIO. This REPORT is solely for informative purposes and is not a solicitation or an offer to buy or sell any security. It is not intended as being a complete description of the company, industry, securities or developments referred to in the material. Any forecasts contained in this report were independently prepared unless otherwise stated and HAVE NOT BEEN endorsed by the Management of the company which is the subject of this report. Additional information is available upon request. THIS REPORT IS COPYRIGHT. YOU MAY NOT REDISTRIBUTE THIS REPORT WITHOUT OUR PERMISSION. Please give proper credit, including citing Fundamental Research Corp and/or the analyst, when quoting information from this report.
The information contained in this report is intended to be viewed only in jurisdictions where it may be legally viewed and is not intended for use by any person or entity in any jurisdiction where such use would be contrary to local regulations or which would require any registration requirement within such jurisdiction.


.png&w=128&q=75)
Discussion
Comments reflect the views of individual users, not FRC. Nothing posted in the comments section — by users or otherwise — should be taken as investment advice.