
We are initiating coverage with a BUY rating, and a fair value estimate of $0.22/share. FAIR offers diversified exposure to gold, silver, and copper; commodities for which we maintain a positive outlook.
Gold, Silver & Copper Exposure at a Deep Discount
Paused · 15:43 left · FRC · read by an AI voice
Disclosure: Fairchild Gold Corp. has paid FRC a fee for research coverage and distribution of reports. This fee creates a potential conflict of interest which readers should consider. See last page for other important disclosures, rating, and risk definitions.
All figures are in CS$, unless otherwise stated, which are in US$.
| YTD | 12M | |
|---|---|---|
| FAIR | -44% | -55% |
| TSXV | -11% | -6% |
| Gold | -4% | 9% |
| Copper | 17% | 36% |
| Key Financial Data (FYE - Oct 31) (C$) | FY2025 (14M) | FY2026 (6M) | Current (FRC Est.) |
|---|---|---|---|
| Cash | $745,835 | $13,720 | |
| Working Capital | $1,474,450 | $425,771 | $1,344,880 |
| Mineral Assets/PP&E | $3,294,373 | $3,842,909 | |
| Total Assets | $5,461,029 | $5,030,263 | |
| Net Income (Loss) | -$4,107,770 | -$1,958,496 | |
| EPS | -$0.05 | -$0.01 |
Diversified commodity exposure: Gold, silver, copper, and critical minerals including antimony and cobalt. Prolific Nevada locations: All three projects are located in established mining districts with nearby producing operations, providing regional infrastructure, and mining expertise, while potentially enhancing M&A appeal. The flagship Golden Arrow project hosts an independently verified NI 43-101 resource, and is more advanced than the other two projects.
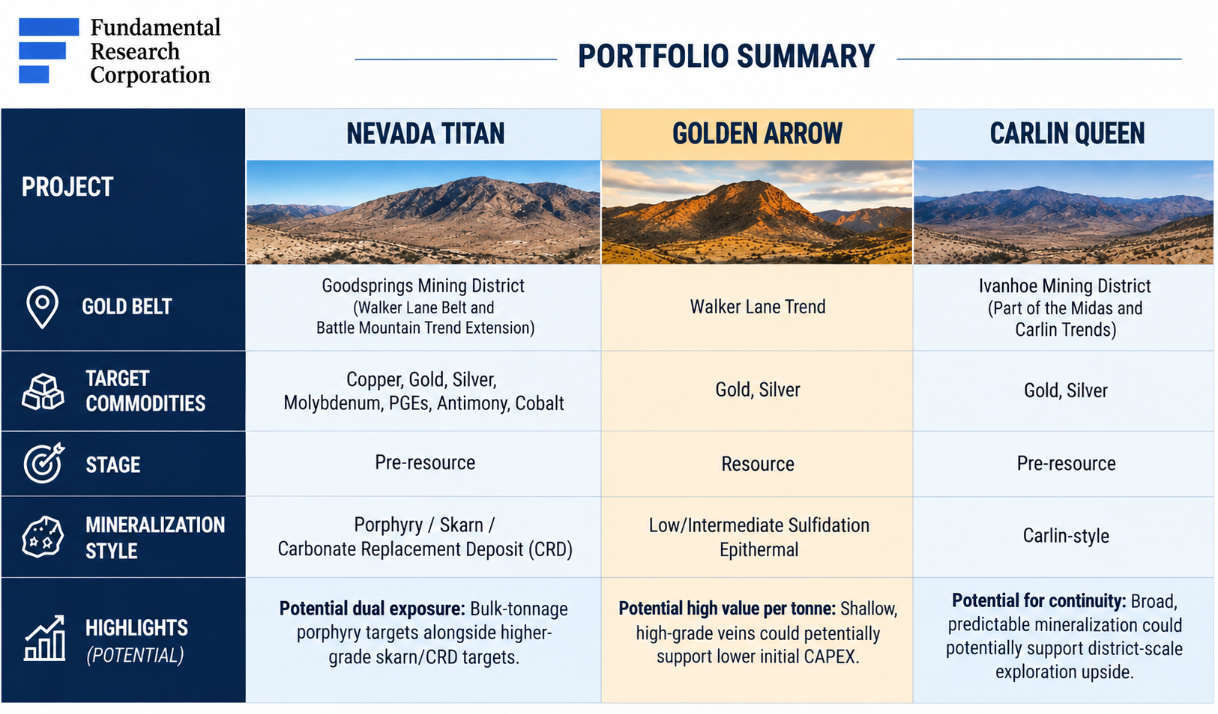
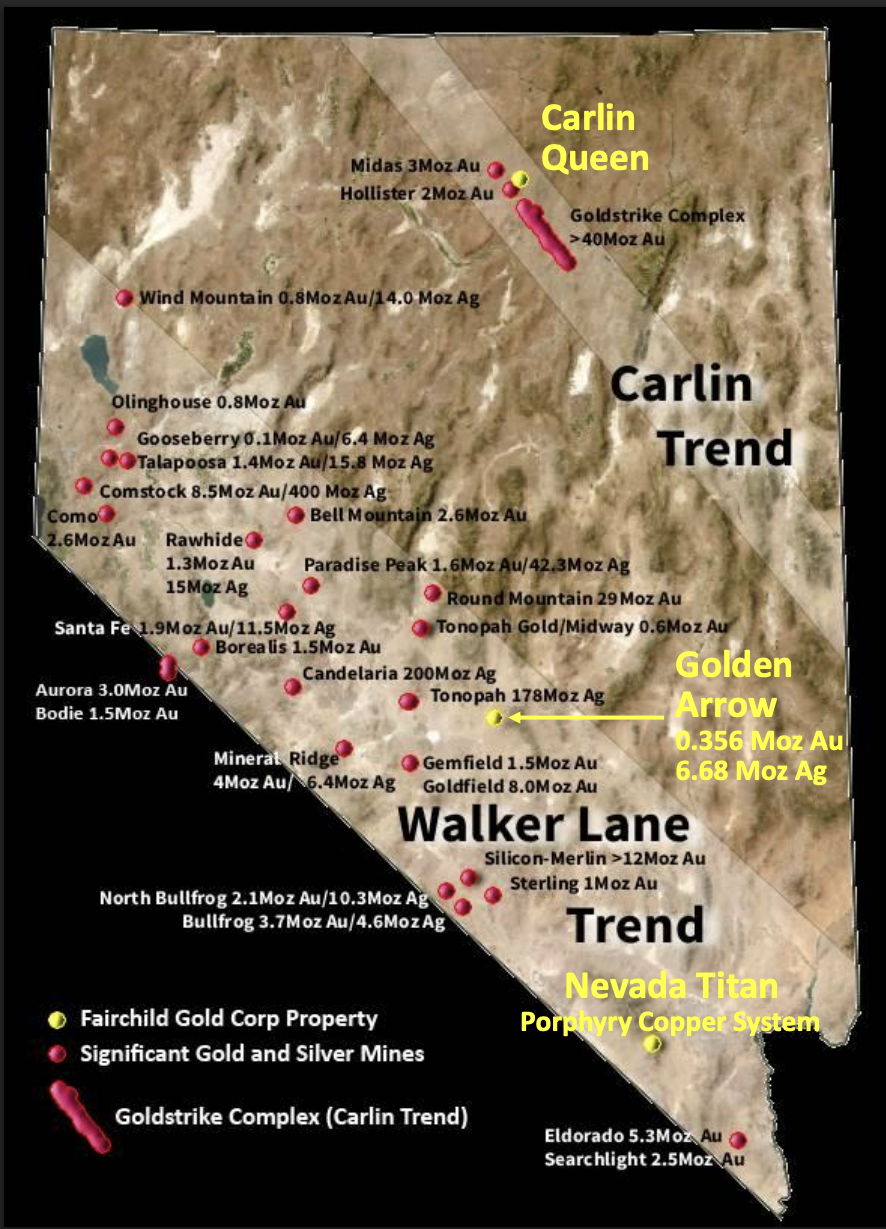
Projects in Prolific Mining Districts
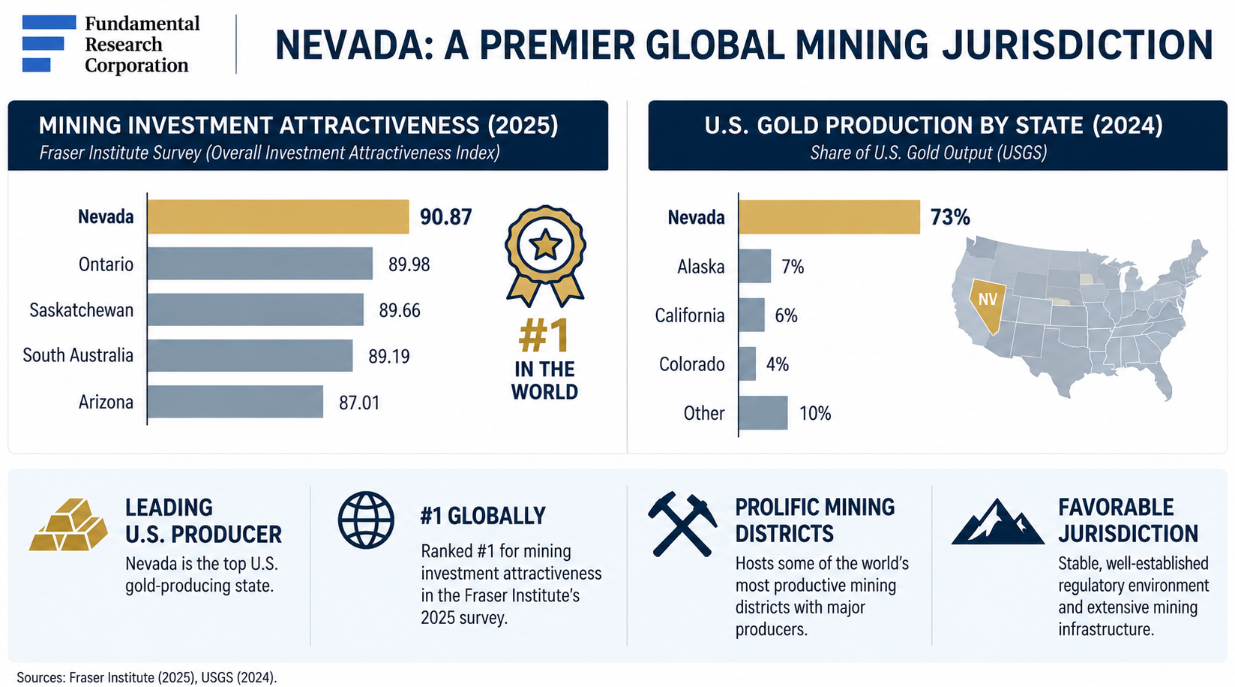
Nevada is the leading U.S. gold-producing state, and ranked #1 globally for mining investment attractiveness in the Fraser Institute’s 2025 survey.
FAIR acquired the project from Emergent Metals Corp. earlier this year for $600K cash, 12.5M shares, and a $3.5M secured note (all figures in US$). The project is located ~97 km east of Tonopah, a historic mining town in central Nevada. It is ~105 km from several multi million ounce epithermal gold deposits, including Kinross’ (TSX: K) Round Mountain mine, and AngloGold Ashanti’s (NYSE: AU) Silicon and Merlin discoveries.
The property covers 10,200 acres along the Walker Lane Trend, an area known for shallow, high-grade epithermal gold-silver deposits. Its shallow mineralization could support lower initial CAPEX, while higher grades could potentially support attractive project economics.
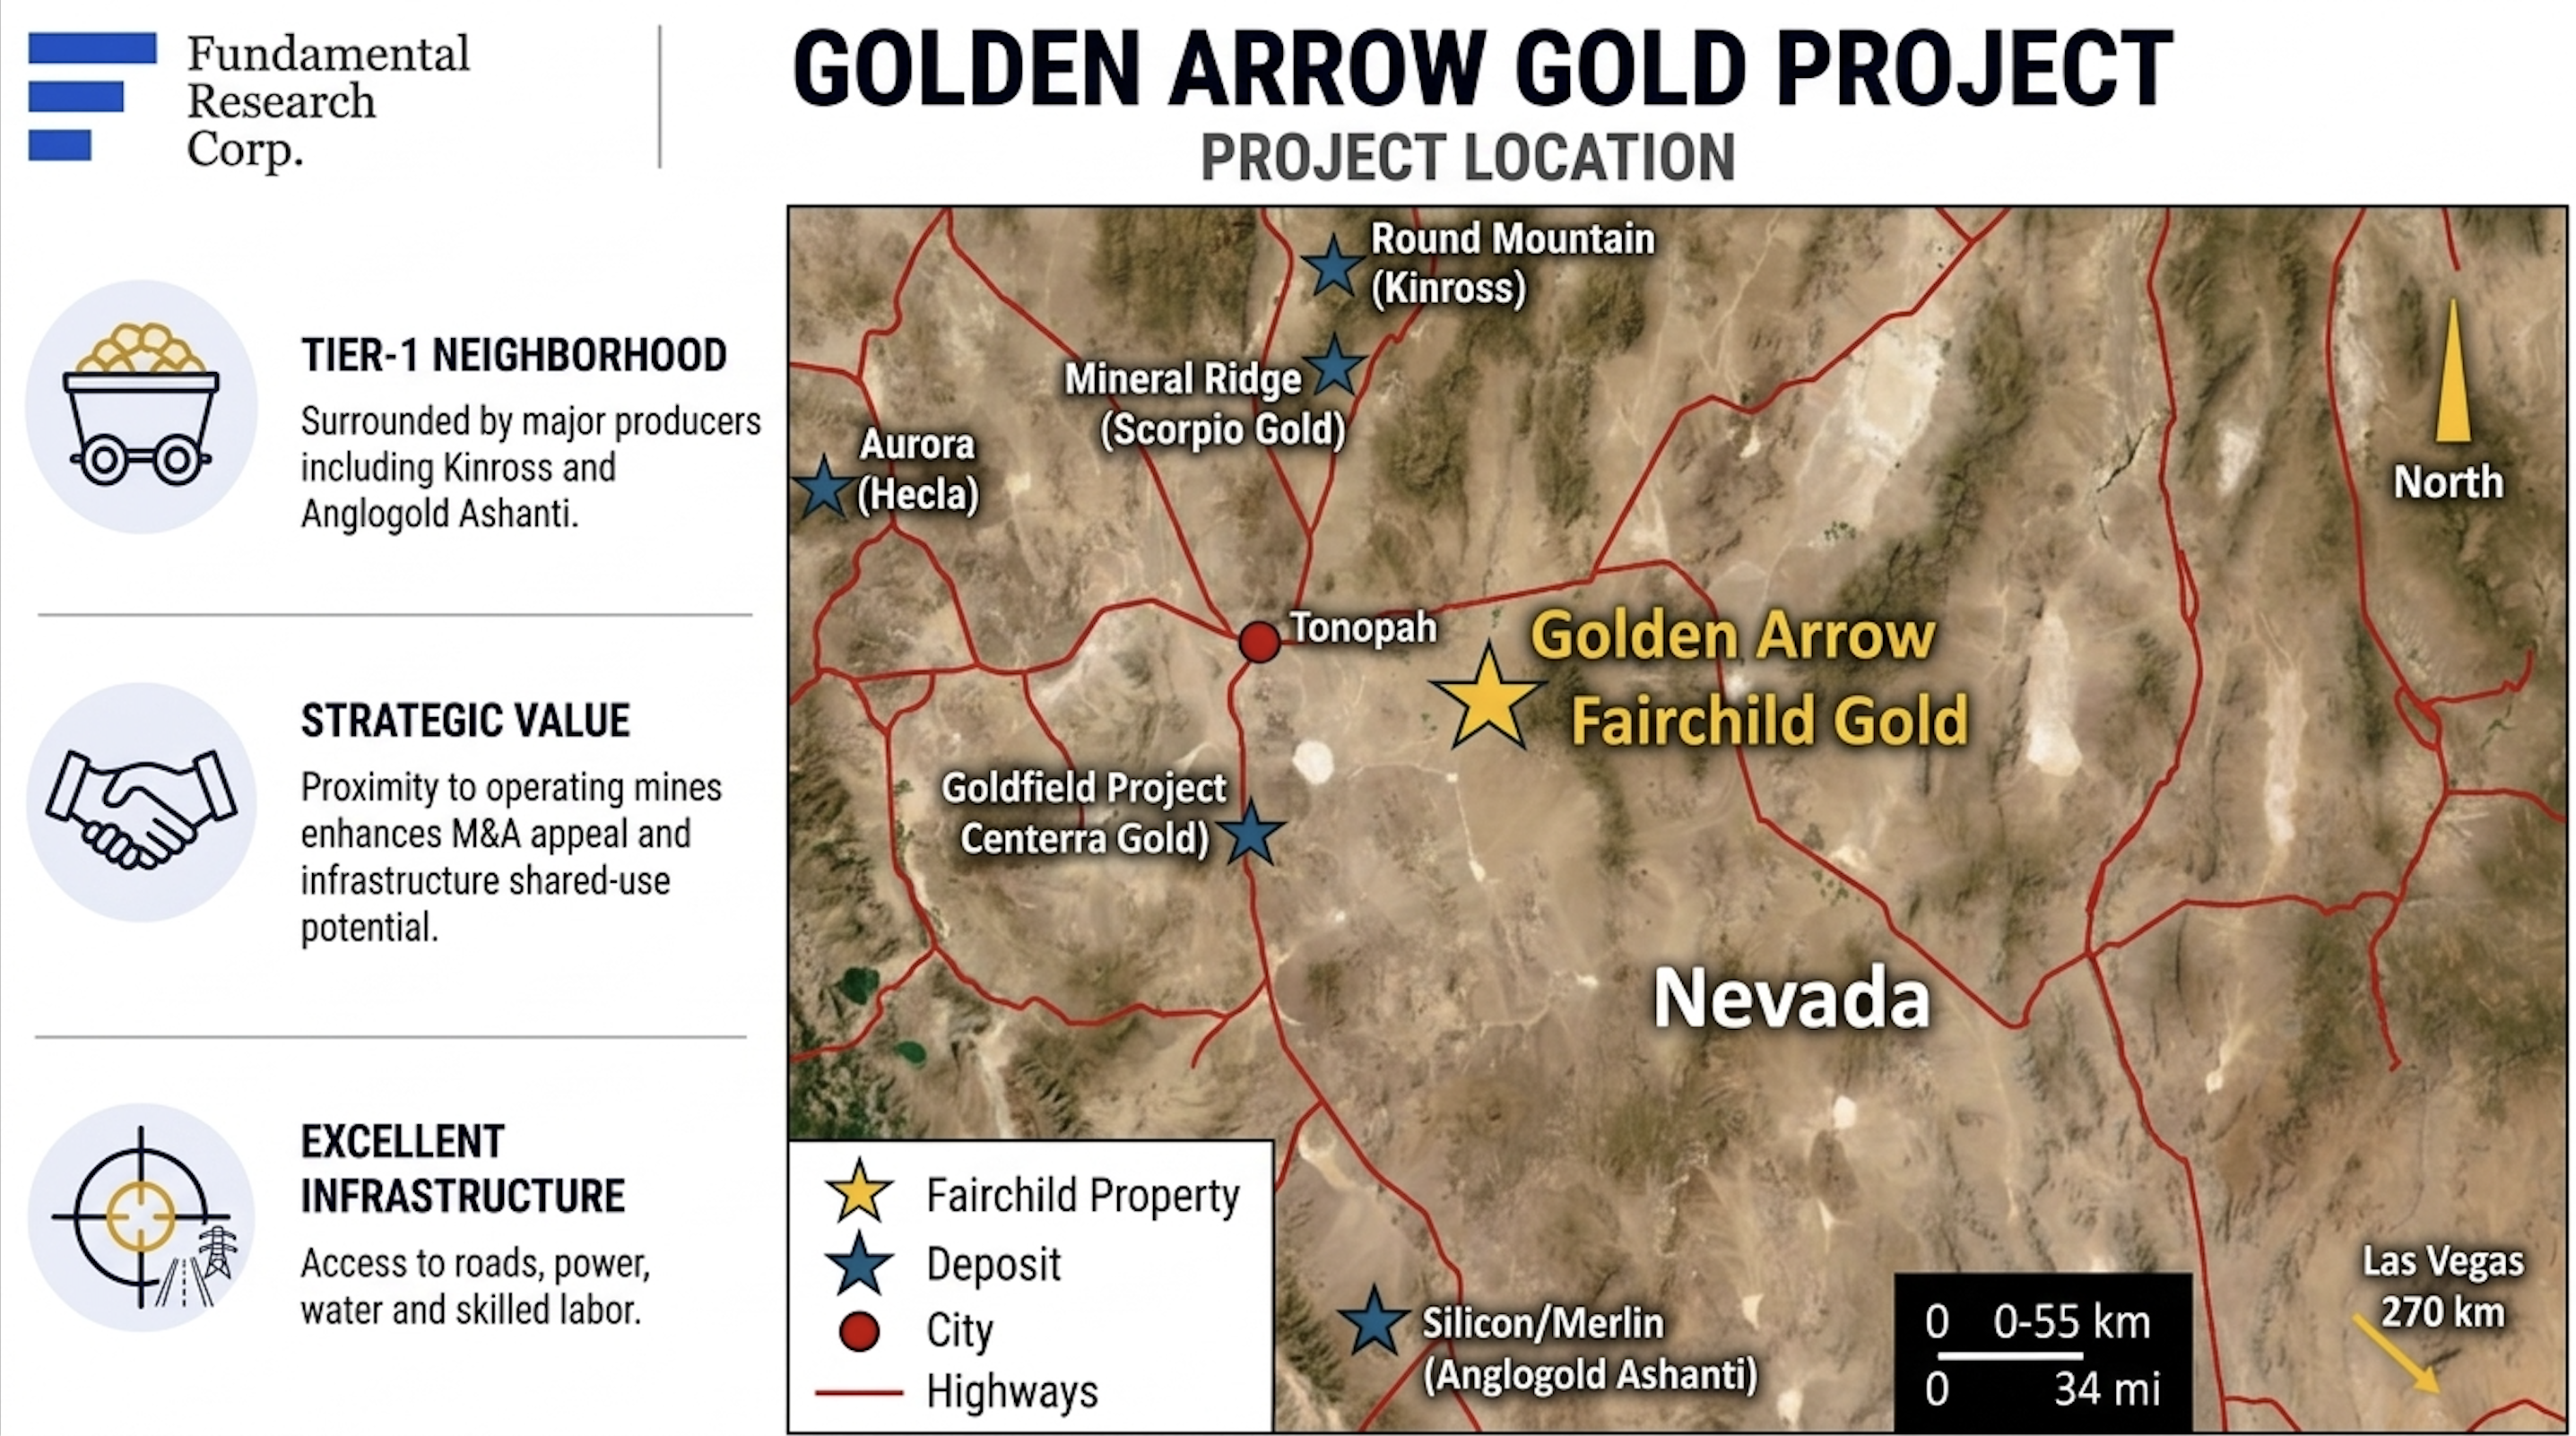
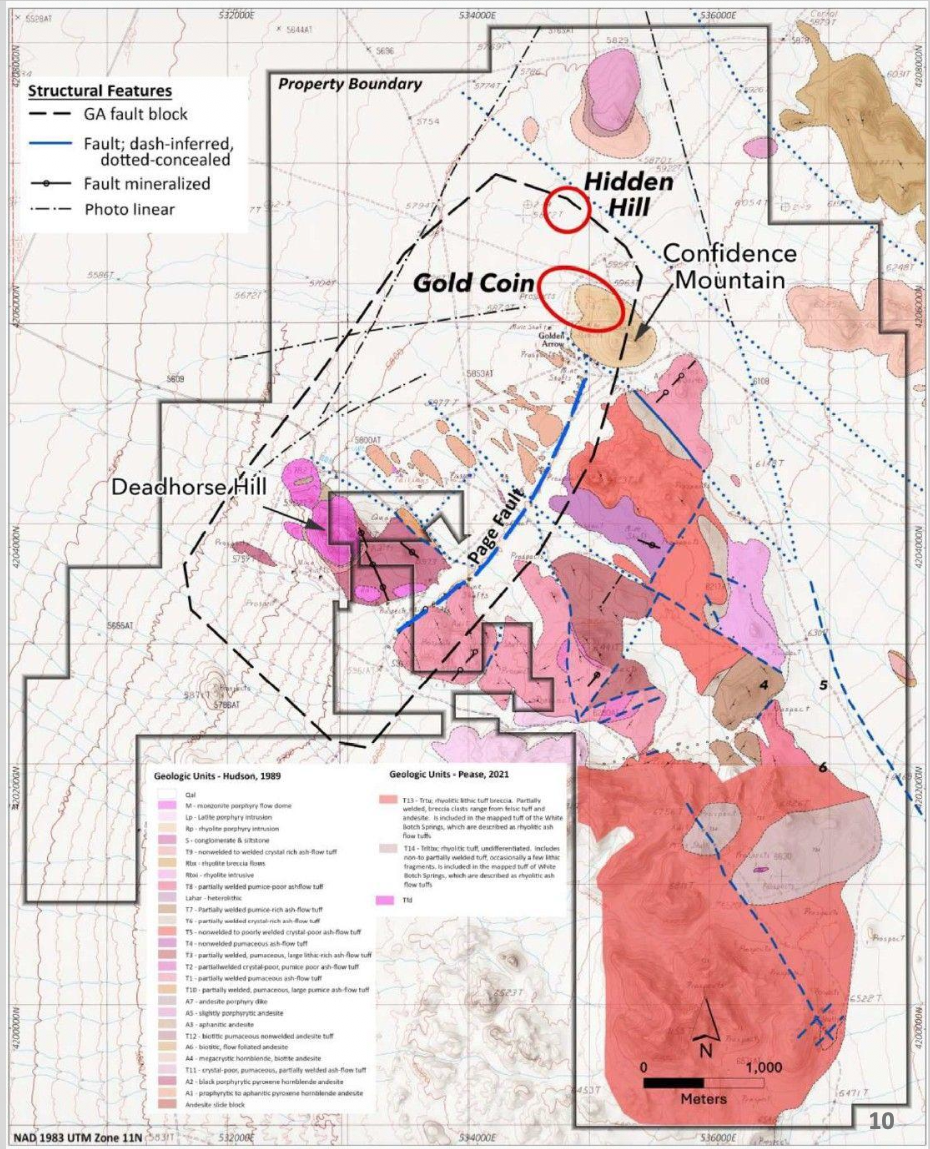
Three primary mineralized targets; two have defined resources. Exploration: Began in 1905; advanced by 12 companies since 1981. Resource: Drilling across two mineralized zones (Hidden Hill and Gold Coin) established an independent resource estimate. The resource basis is 361 holes / 61,268 m. Specifically, the resource is 296 koz Au / 4.36 Moz Ag M&I; 60 koz Au / 2.32 Moz Ag inferred, providing a modest baseline resource relative to Walker Lane deposits (0.3–10+ Moz Au).
Mineralized Areas
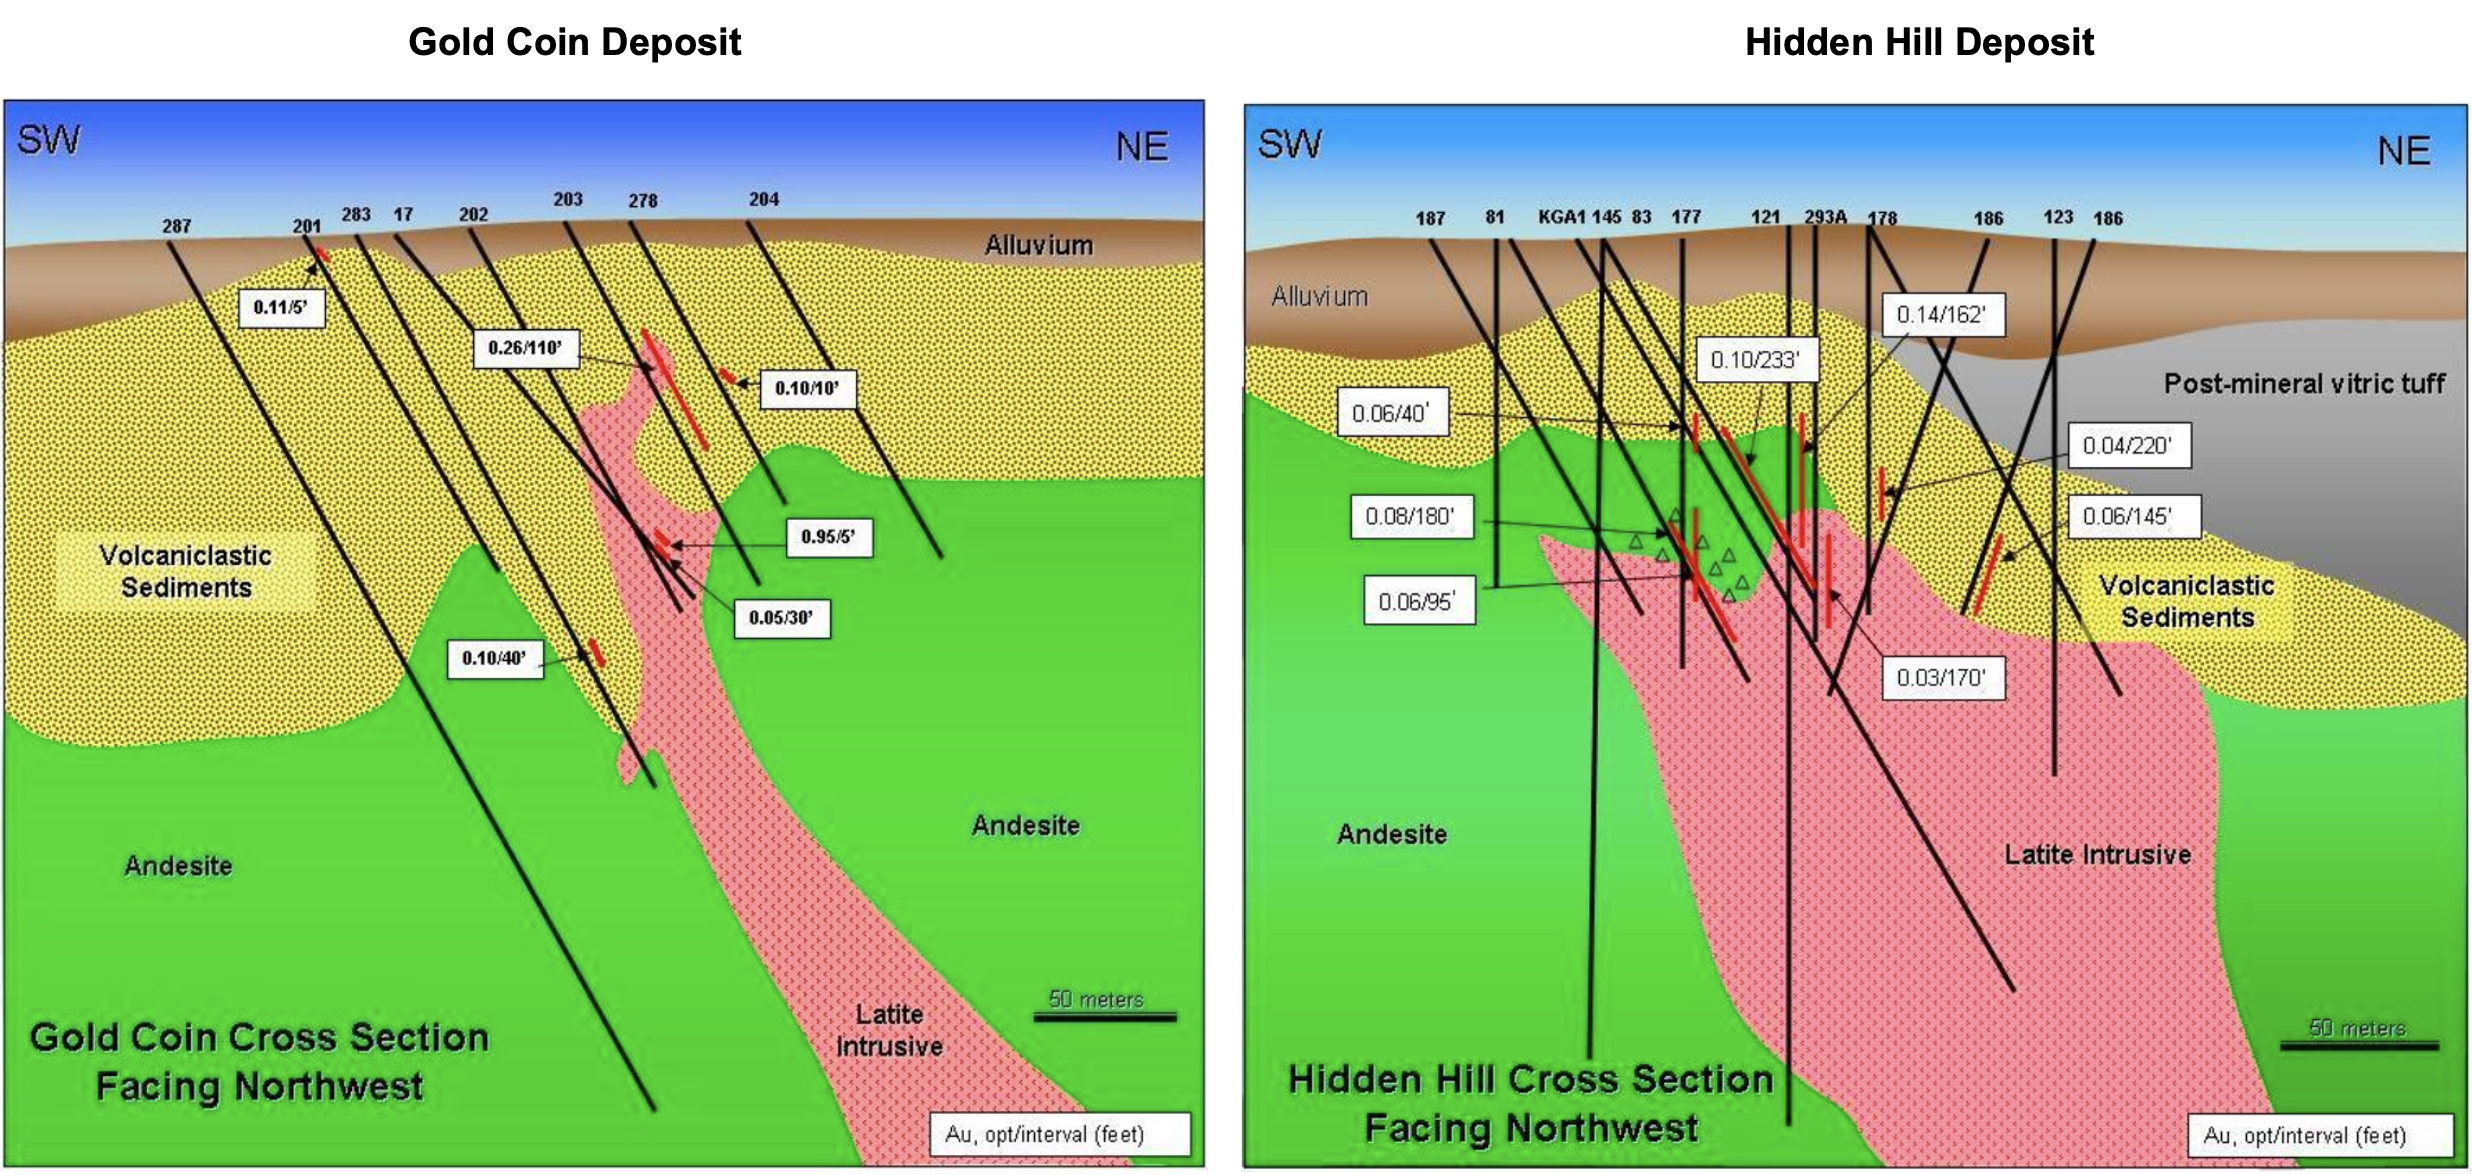
The grade is consistent with grades typical of open-pit, heap-leach operations. Additionally, M&I resources account for 83% of total gold resources, reflecting high confidence.
Golden Arrow Resource Estimate
| Classification | Cutoff | ||||||
|---|---|---|---|---|---|---|---|
| oz AuEq/ton | Tons | oz AuEq/ton | oz Au/ton | ounces Au | oz Ag/ton | ounces Ag | |
| Measured | Variable* | 2,198,000 | 0.029 | 0.025 | 54,000 | 0.37 | 822,000 |
| Indicated | Variable* | 12,897,000 | 0.022 | 0.019 | 241,000 | 0.27 | 3,504,000 |
| Measured and Indicated | Variable* | 15,376,000 | 0.023 | 0.019 | 296,000 | 0.28 | 4,362,000 |
| Inferred | Variable* | 8,648,000 | 0.010 | 0.007 | 60,000 | 0.27 | 2,322,000 |
| *Based on cutoff grades of 0.005 oz AuEq/ton for oxide and 0.006 oz AuEq/ton for sulfide | |||||||
Gold Coin (2,000 × 900 ft) and Hidden Hill (~750-ft diameter) host near-surface mineralization that could potentially support open-pit mining. Tests indicate amenability to conventional heap-leach processing, with recoveries of 60%–70% for gold, and 45% for silver; further testing is planned.
Mineralization Across Key Targets
Substantial Exploration Upside: The current resource covers only 5% of the 10,200 acre land package, and remains open to the south and west.
We view the project’s potential for resource growth beyond the main targets as a key advantage. Numerous historic gold-silver prospects, adits, and small mine workings surrounding Gold Coin and Hidden Hill provide multiple property-wide targets for additional discoveries.
Historic Workings & Pits
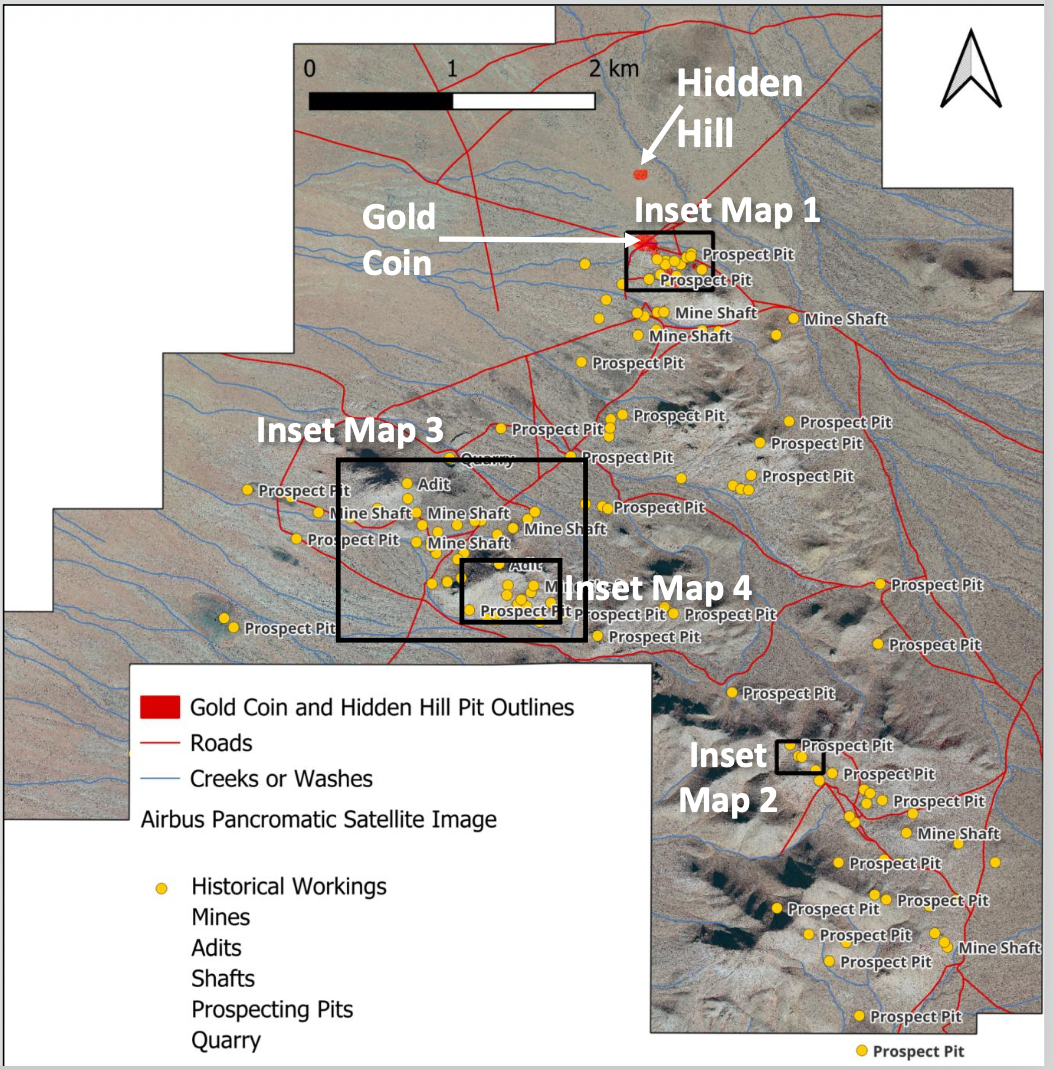
FAIR has launched a spectral and structural mapping program, focusing on underexplored areas, and historic mine workings. Yet to announce timelines for a resource update, and an economic study (PEA), which will likely require additional technical work.
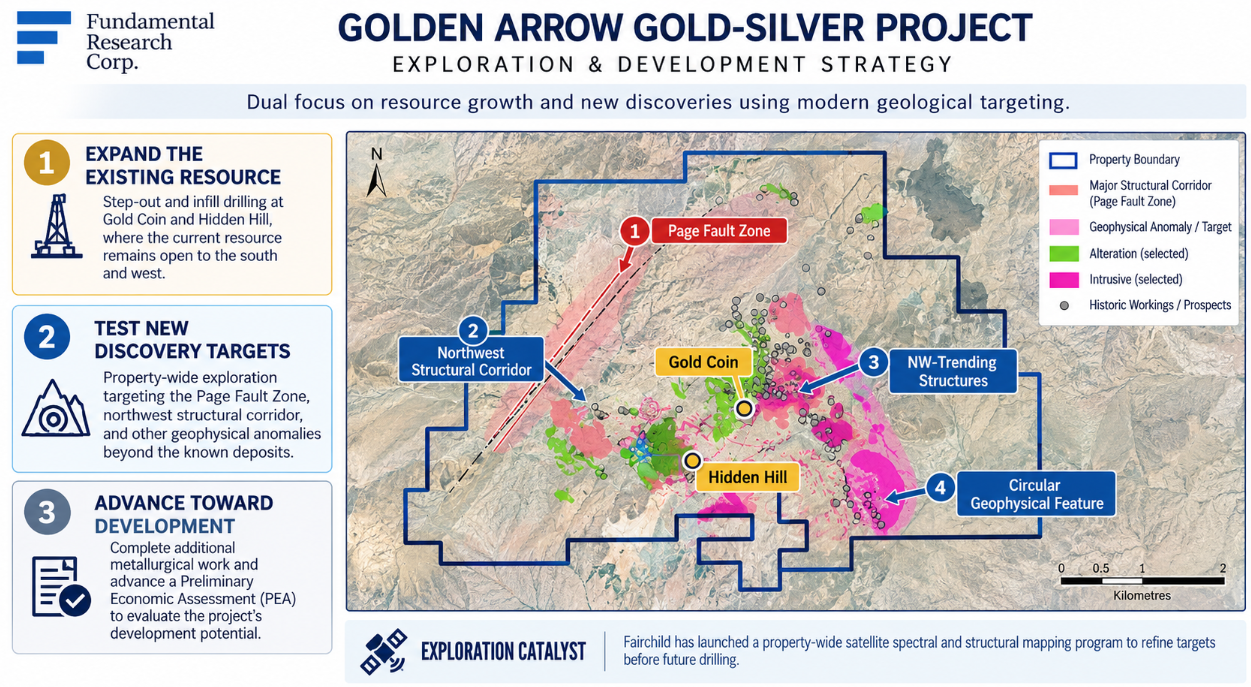
In summary, we view Golden Arrow as a promising exploration stage gold-silver project. While the current resource is not yet large enough to support development, key positives include recoveries in line with similar projects, significant resource-expansion potential, several untested targets, and proximity to major gold projects that could enhance M&A appeal. Upcoming drilling, an updated resource, and a PEA provide key catalysts to unlock further value.
FAIR gained control of the project in 2024. For instance, 90% earn-in: $35,000 upfront, $325,000 in advance royalties, and $8M in exploration spending over eight years; $105,000 in cash payments made to date (all figures in US$).
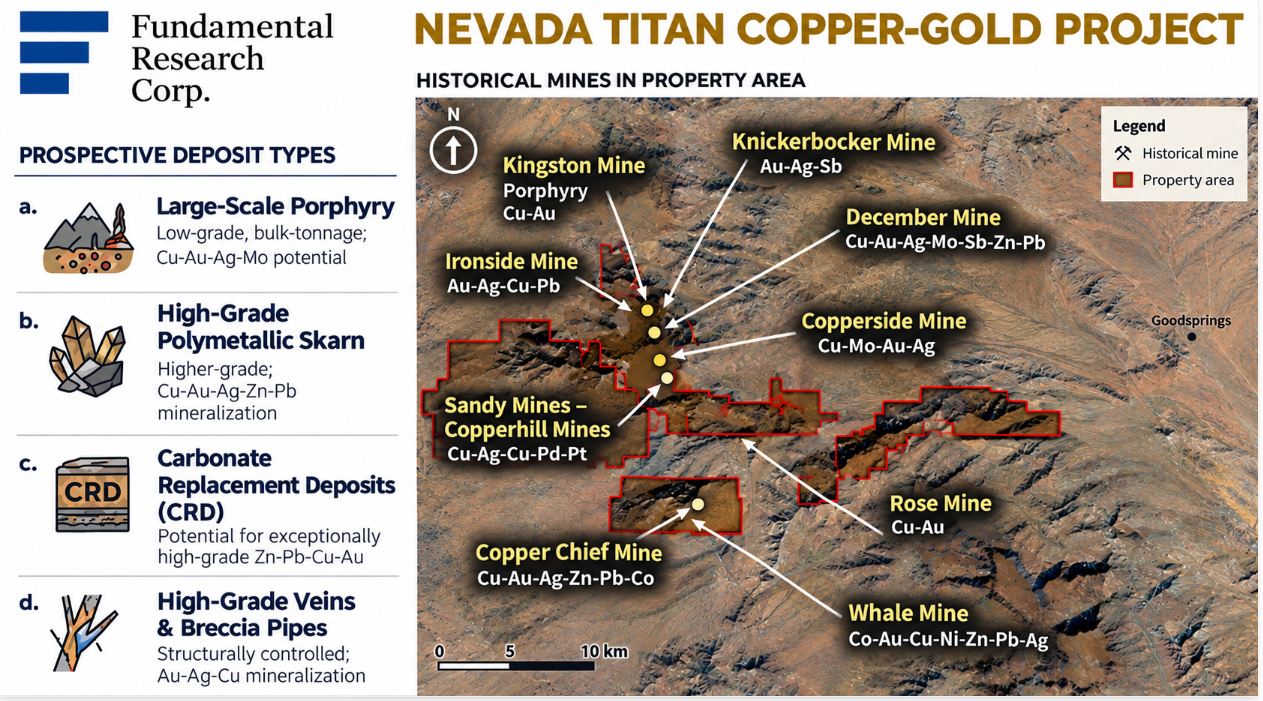
This 6,251-acre, pre-resource project is located in Nevada’s historic Goodsprings Mining District, near the Walker Lane and Battle Mountain trends. The district is known for copper and polymetallic mineralization, including high-grade lead and zinc deposits.
Project Location
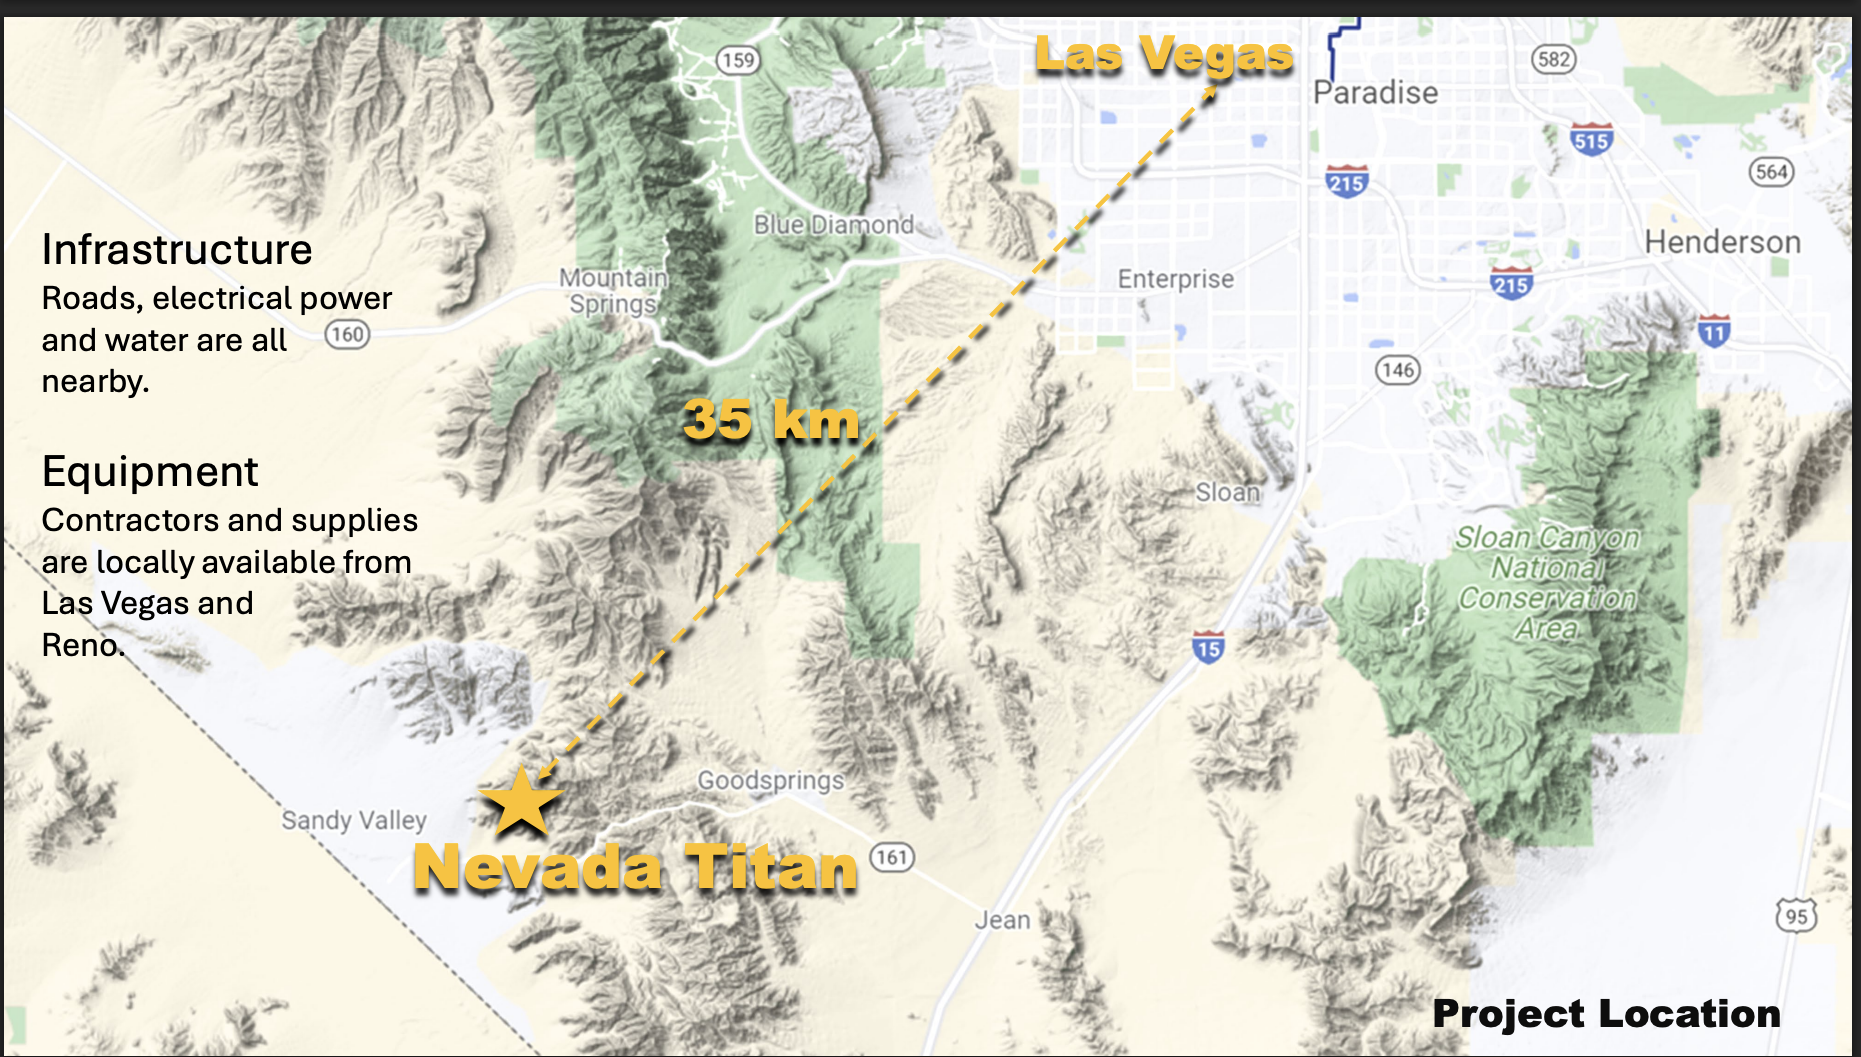
~35 km southwest of Las Vegas. Well-developed regional infrastructure, including roads, water, and power. Moreover, potential for multiple copper-gold and polymetallic deposit types, supported by 100+ historic workings, and a 1.5 km oxidized copper trend.
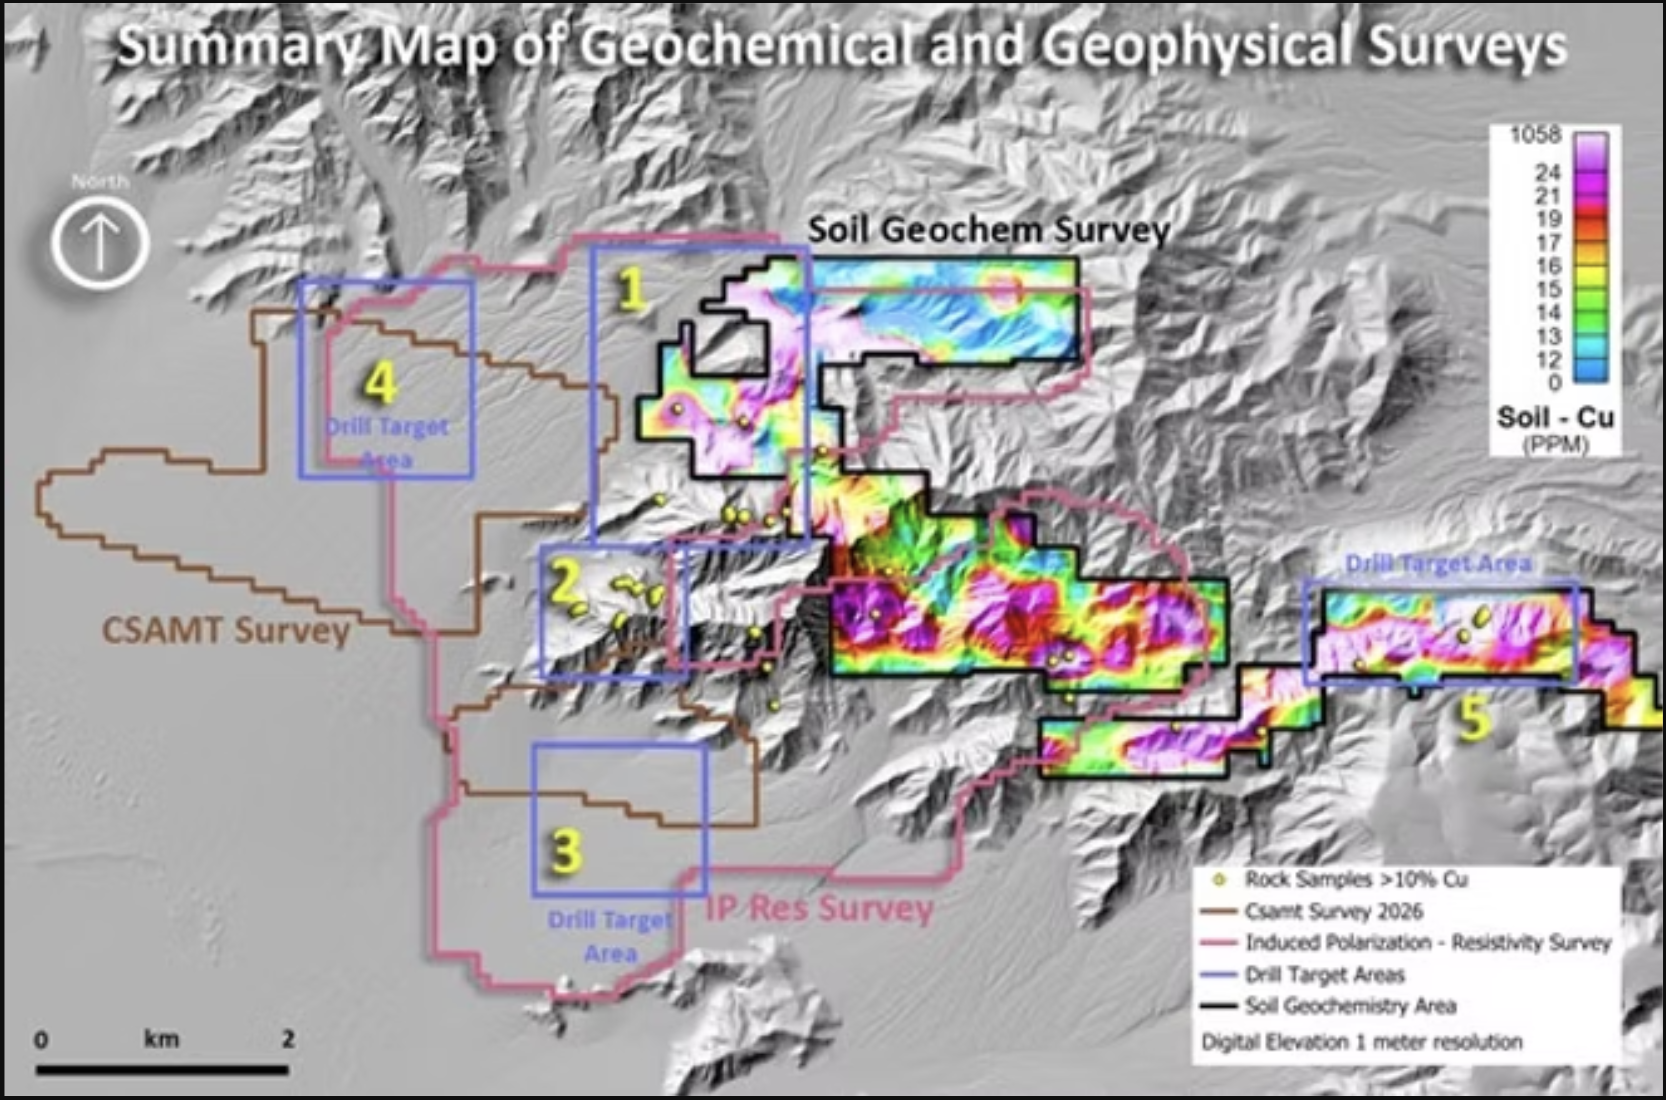
Surface sampling returned exceptionally high grades of up to 34% copper, 226 g/t silver, 1,754 ppm molybdenum, and 1.44 g/t gold. For context, typical deposits grade 0.4%–1.0% copper. Exploration to date has identified five priority targets, highlighting the potential for a concealed system. Next, FAIR is planning Phase 1 drilling at Targets 1 and 2, shown in the image on the right.
2025 Sample Highlights
Copperside Area/Mine
| Sample | Cu % | Au (g/t) | Ag (g/t) | Mo (ppm) |
|---|---|---|---|---|
| 350436 | 34.0 | 1.27 | 134 | 1,745 |
| 350442 | 26.5 | 0.45 | 2.55 | 853 |
| 350433 | 24.4 | 0.41 | 3.07 | 256 |
| 350426 | 22.9 | 0.28 | 17.45 | 52.3 |
| 903932 | 15.6 | 0.17 | 10.5 | 1,300 |
Azurite Mine
| Sample | Cu % | Au (g/t) | Ag (g/t) | Mo (ppm) |
|---|---|---|---|---|
| 350380 | 15.7 | 0.77 | 5.07 | 1,015 |
| 350379 | 10.6 | 0.22 | 9.54 | 2.74 |
| 903926 | 6.27 | 0.29 | 59.8 | 2.74 |
| 350391 | 5.72 | 1.33 | 17.95 | 17.9 |
| 350387 | 4.34 | 1.44 | 42.1 | 11.45 |
Fitzhugh Lee Mine and Area
| Sample | Cu % | Au (g/t) | Ag (g/t) | Mo (ppm) |
|---|---|---|---|---|
| 350462 | 22.60 | 0.28 | 77.4 | 164.0 |
| 903924 | 9.22 | 0.29 | 226.0 | 559.0 |
| 903949 | 6.58 | 0.61 | 18.3 | 928.0 |
| 350409 | 3.78 | 0.06 | 20.2 | 28.8 |
Other Samples
| Sample | Area | Cu % | Au (g/t) | Ag (g/t) | Mo (ppm) |
|---|---|---|---|---|---|
| 350477 | Wasp Mine | 4.83 | 0.24 | 97.0 | 44.2 |
| 903927 | Smithsonite Area | 2.64 | 0.32 | 154.0 | 12.6 |
| 350371 | Wasp Mine | 1.47 | 0.62 | 4.56 | 1450 |
Five Priority Targets
FAIR acquired the project in 2025 for US$375,000.
This 1,508-acre, pre-resource project is located in Elko County, Nevada, within the Ivanhoe Mining District, at the intersection of the Carlin and Midas trends. Located ~15 km southeast of the Midas district, the project is surrounded by past and present gold mines, including Newmont’s former Mule Canyon mine and Hecla Mining’s Midas and Hollister mines.
~77 km northwest of Elko, ~2 km north of Hecla’s Hollister mine and ~17 km from its Midas mill, providing potential access to nearby processing infrastructure and toll-milling, JV, or M&A opportunities. Existing road, water, and power infrastructure. In addition, prospective for both large-tonnage, and shallow, high-grade gold-silver veins.
Project Location
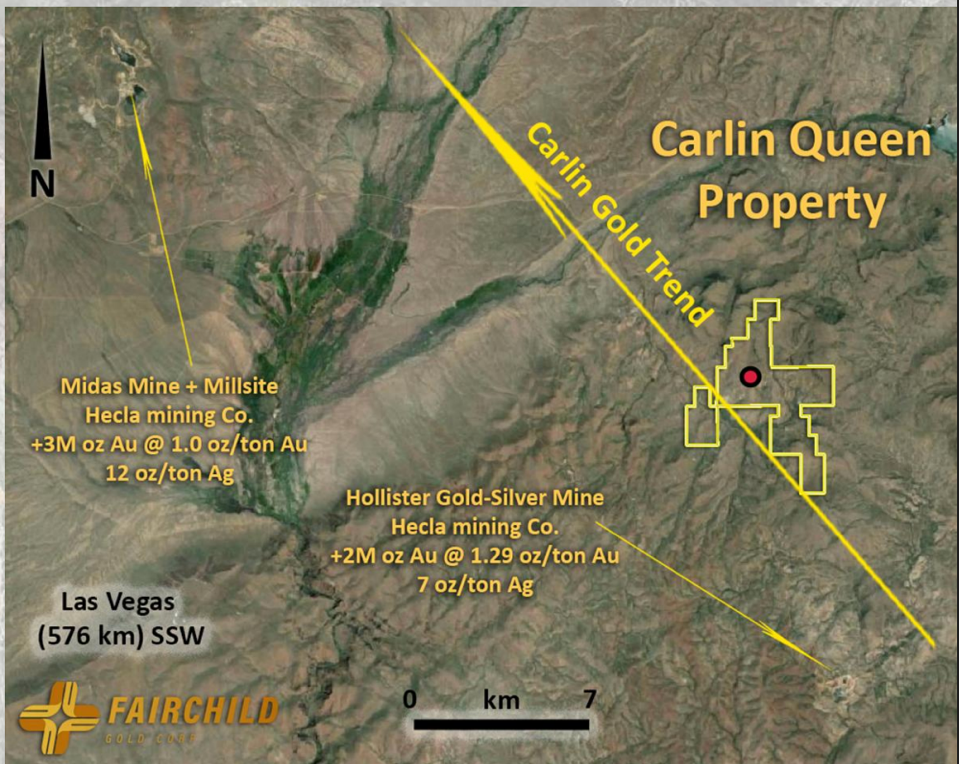
In summary, Carlin Queen is a very early-stage opportunity, making its potential difficult to assess. Management is expected to focus on its two more advanced projects, with Carlin Queen offering longer-term exploration upside.
Management, directors, and other key investors own 29%. Two of five directors are independent; we would prefer greater board independence.
| Management/Directors | Shares | % of Total |
|---|---|---|
| Nikolas Perrault - Executive Chairman | 15,124,043 | 6.59% |
| Luis Martins - CEO, President & Director | - | - |
| Robert Rosner - CFO & Director | 2,363,335 | 1.03% |
| Michel Lebeuf Jr.- Corporate Secretary | 73,000 | 0.03% |
| Geoffrey Baker - Independent Director | 500,000 | 0.22% |
| Adam Cavise- Independent Director | - | - |
| Shahal M. Khan, Strategic Advisory Board | 14,200,000 | 6.19% |
| 32,260,378 | 14.06% | |
| Major Investors | Shares | % of Total |
| Sprinter LLC, a private investment company | 21,600,000 | 9.41% |
| Lahontan Gold Corp. (TSXV:LG) | 12,500,000 | 5.45% |
| 34,100,000 | 14.86% | |
| Total | 66,360,378 | 28.92% |
We believe the team has a well-rounded background across mining, exploration, finance, and capital markets.
Brief biographies of the management team and board members follow:
Extensive experience in securities trading, human resources, and financial analysis; held roles at National Bank, Merrill Lynch, CIBC, and Scotia Capital.
30 years of experience in exploration and mining; former director of Portugal’s Geological Survey and Mining Authority.
30+ years of experience as a mining entrepreneur and executive; founder of several junior exploration companies, with experience in IPOs, M&A, and RTOs.
Partner and head of the Securities Practice Group at Therrien Couture Joli-Coeur (TCJ LLP), with experience in securities law, corporate finance, M&A, and governance, particularly in mining and natural resources.
Experience across natural resources and finance; director of a UAE-based oil and gas consultancy and former fund manager.
25+ years of experience in capital markets, equity sales, and trading; Partner at Revere Securities, with senior roles at Macquarie Group, Sterne Agee & Leach, and Soleil Securities.
$1.34M in working capital, and $4.83M in long-term debt.
| (in C$) (FYE - Oct 31) | FY2026 (6M) | Current (FRC Est.) |
|---|---|---|
| Cash | $13,720 | |
| Working Capital | $425,771 | $1,344,880 |
| Current Ratio | 1.60 | |
| Debt | - | $4,830,000 |
| Monthly Burn Rate (G&A) | -$302,223 | |
| Cash Spent on Properties | -$574,183 | |
| Cash from Financing Activities | $1,338,841 |
All options and warrants are currently out of the money.
| Options | # | Exercise Price ($) | Amount |
|---|---|---|---|
| Total | 14,625,000 | $0.10 | $1,462,500 |
| In-the-Money | - | - | - |
| Warrants | # | Exercise Price ($) | Amount |
|---|---|---|---|
| Total | 206,137,779 | $0.13 | $27,706,613 |
| In-the-Money | - | - | - |
FAIR is trading at just $33/oz based on the current resource at Golden Arrow vs. a comparables average of $94/oz, a 65% discount. This is highly conservative, based solely on the existing Golden Arrow resource, with no value assigned to exploration upside or potential resources at Nevada Titan and Carlin Queen. Notably, all companies selected in the study are Nevada-focused gold juniors.
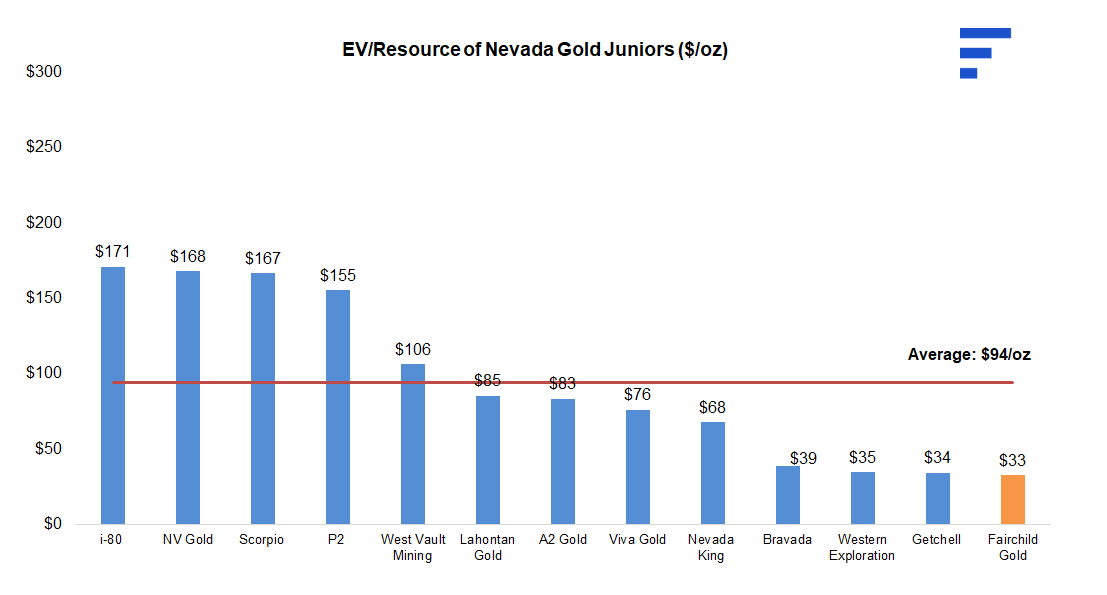
For the companies used in this study, we use 100% of their Measured and Indicated (M&I) resources (higher-confidence categories), and 50% of inferred resources (lower-confidence). However, for FAIR’s Golden Arrow project, given its significant resource expansion potential, we use 100% of both M&I and inferred resources.
Valuing Golden Arrow at the sector multiple of $94/oz results in a fair value of $0.15/share. Given the early-stage nature of Nevada Titan and Carlin Queen, we value the projects using the average Price-to-Book (P/B) multiple of pre-resource-stage juniors in Nevada. Applying a 3.61x P/B to the projects’ $3.70M book value, we derive a value of $0.06/share. Finally, using a sum-of-the-parts approach, we arrive at a fair value of $0.22/share on FAIR.
| Gold Juniors | Enterprise Value ($,M) | EV / Resource* | |
|---|---|---|---|
| 1 | i-80 Gold | $2,009 | $171.02 |
| 2 | NV Gold | $42 | $168.00 |
| 3 | Scorpio Gold Corp | $87 | $166.67 |
| 4 | P2 Gold | $358 | $155.31 |
| 5 | West Vault Mining | $106 | $106.11 |
| 6 | Lahontan Gold | $149 | $85.41 |
| 7 | A2 Gold | $62 | $83.33 |
| 8 | Viva Gold | $43 | $76.09 |
| 9 | Nevada King Gold | $76 | $67.88 |
| 10 | Bravada Gold | $29 | $39.02 |
| 11 | Fairchild Gold | $14 | $32.64 |
| 12 | Western Exploration | $34 | $34.52 |
| 13 | Getchell Gold | $51 | $34.39 |
| Average (excl outliers) | $93.88 |
| Golden Arrow's Resources (oz) | 422,840 |
| Average EV/ Resource Ratio (comparables) | $93.88 |
| Fair Value of Golden Arrow | $39,694,591 |
| Fair Value of Nevada Titan + Carlin Queen | $13,365,001 |
| Working Capital net of Debt | -$3,485,120 |
| Fair Value of FAIR | $49,574,472 |
| No. of Shares (treasury stock method) | 229,472,781 |
| Fair Value per Share (C$) | $0.22 |
We are initiating coverage with a BUY rating, and a fair value estimate of $0.22/share. FAIR offers diversified exposure to gold, silver, and copper; commodities for which we maintain a positive outlook. At just $33/oz, FAIR trades at a 65% discount to peers, offering an attractive entry point, with a resource-backed valuation, and potential exploration upside across its three projects. Key catalysts include upcoming drilling, potential resource expansion, and a PEA at Golden Arrow, as well as exploration at Nevada Titan.
We are assigning a risk rating of 5 (Highly Speculative).
We believe the company is exposed to the following key risks (not exhaustive):
Sid Rajeev, B.Tech, MBA, CFA — Head of Research, Fundamental Research Corp.
Nina Rose Coderis, B.Sc (Geology) — Equity Analyst, Fundamental Research Corp.
The full report — the designed PDF with all charts and the complete disclosure — remains available as published, free of charge with a free account. This page is the same analysis in the form a search engine, an AI assistant and a phone screen can read.
Disclosures. Fees ranging between $25,000 and $35,000 have been paid to FRC by Fairchild Gold Corp. to commission this report, research coverage, and distribution of reports. This fee creates a potential conflict of interest which readers should consider. The analyst and Fundamental Research Corp. “FRC” does not own any shares of the subject company, does not make a market or offer shares for sale of the subject company, and does not have any investment banking business with the subject company. Definition of FRC’s Fair Value Estimate – Our fair value estimate is the theoretical value of the company’s equity using widely accepted methods of valuation such as discount cash flow or comparables. IT IS NOT A TARGET PRICE or PREDICTION OF THE FUTURE STOCK PRICE. Buy – Fair value is 12% above the current market price; or risk and reward is favorable. 5 (Highly Speculative) - The company has no history of generating earnings or cash flow. They may operate in a new industry with new, and unproven products. Products may be at the development stage, testing, or seeking regulatory approval. These companies may run into liquidity issues and may rely on external funding. These stocks are considered highly speculative. The distribution of FRC’s ratings are as follows: BUY (76%), HOLD (2%), SELL / SUSPEND (22%). ALWAYS TALK TO YOUR FINANCIAL ADVISOR BEFORE YOU INVEST.

.webp&w=128&q=75)


.webp&w=128&q=75)


Discussion
Comments reflect the views of individual users, not FRC. Nothing posted in the comments section — by users or otherwise — should be taken as investment advice.