
Disclosure: Evolution PowerX Corp. has paid FRC a fee for research coverage and distribution of reports. This fee creates a potential conflict of interest which readers should consider. See last page for other important disclosures, rating, and risk definitions.
Price and Volume (1-year)
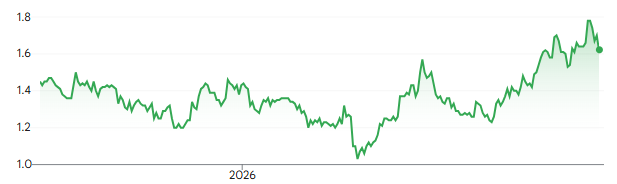
* Evolution PowerX has paid FRC a fee for research coverage and distribution of reports. See last page for other important disclosures, rating, and risk definitions. All figures in C$ except commodity prices which are in US$.
E vs Larger Players
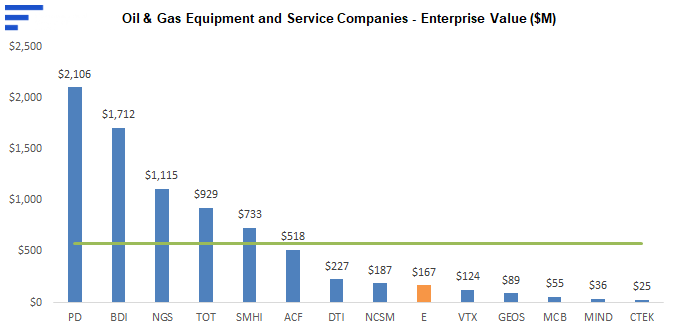
We benchmark E against a broad spectrum of oil and gas equipment and service providers, with MCAPs from $25M to ~$2B
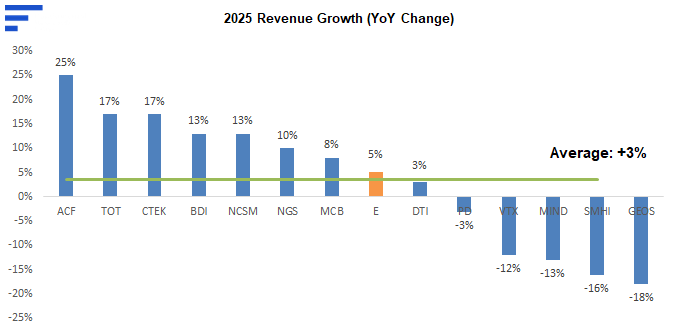
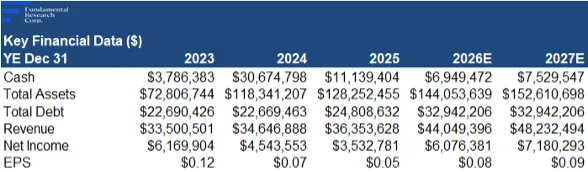
E recorded 5% revenue growth in 2025, outperforming the sector average of 3%
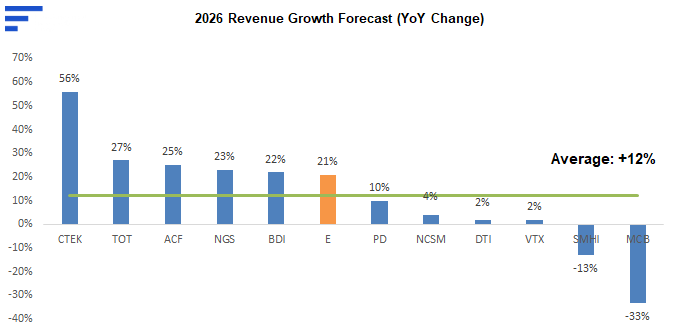
We are projecting 21% revenue growth for E in 2026 vs 12% for the sector
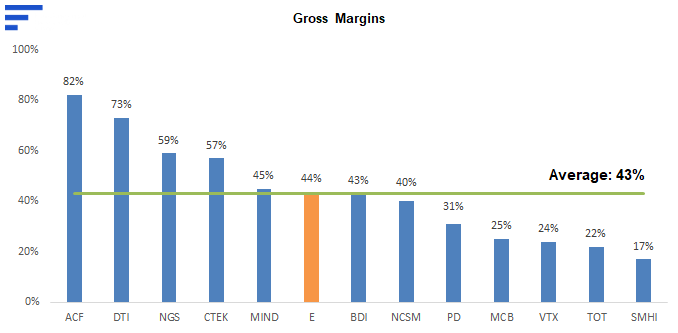
E’s gross margins are in line with the sector average
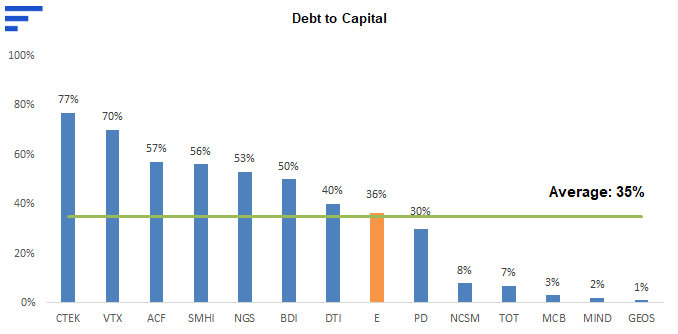
Debt to capital is also in line
Source: FRC / S&P Capital IQ
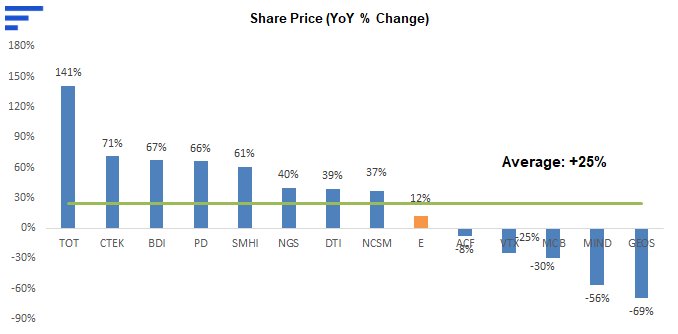
Despite our strong 2026 outlook, E has gained just 12% YoY vs. 25% for the sector, suggesting its share price has yet to fully reflect its growth prospects
Financials
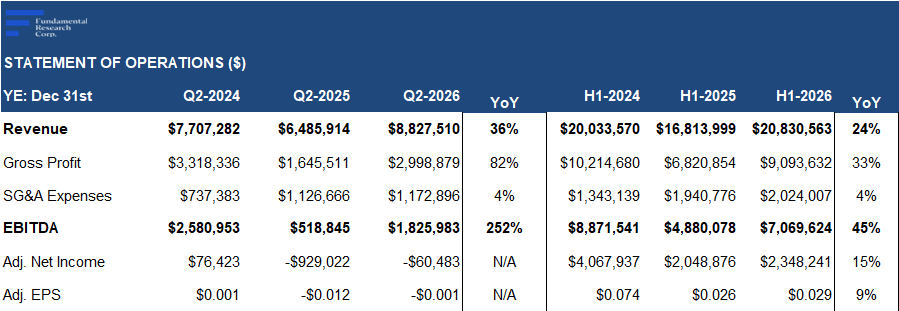
Q2 revenue: +36% YoY on strong client activity, 7% above our estimate
Gross margin: +9 pp YoY to 34%, 2 pp above our estimate
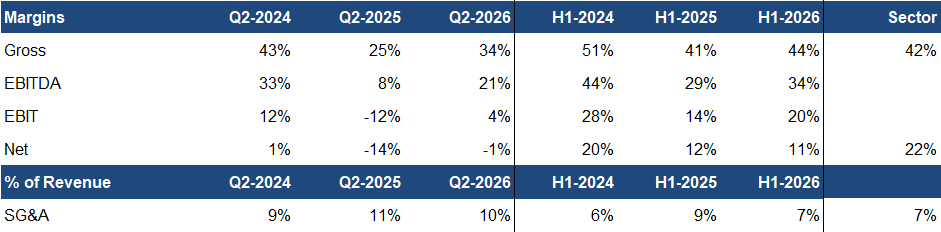
*Sector: Oil & Gas Machinery Rental and Leasing
G&A: +4% YoY, 6% above our estimate
EPS: Improved from ($0.012) to ($0.001), 17% above our estimate
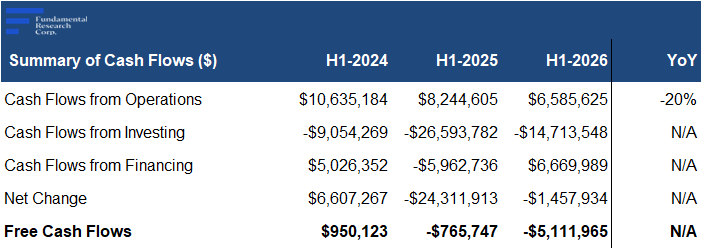
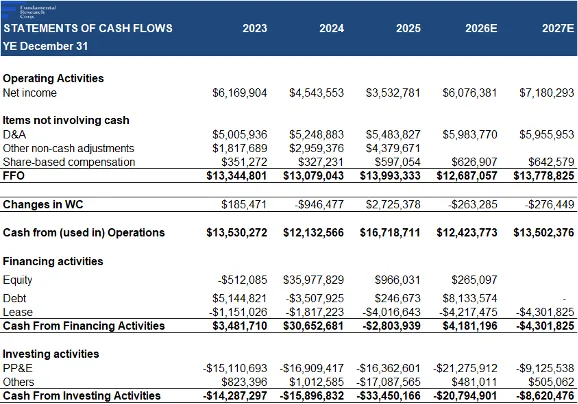
Free cash flows: Declined despite higher EPS, due to working-capital timing, with no structural issues
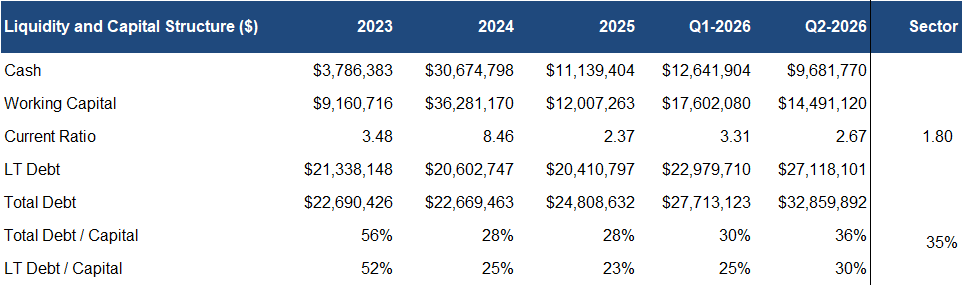
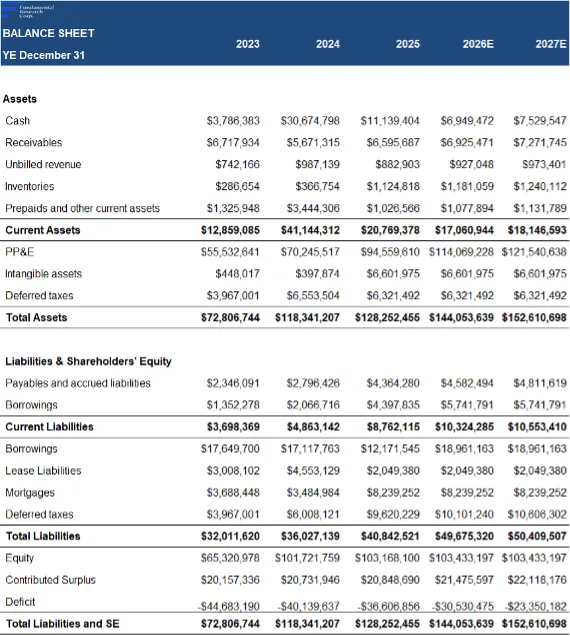
Balance Sheet: Healthy cash position; debt-to-capital increased but remains in line with peers. We do not anticipate a need for new financing.

Source: FRC / Company
Oil & Gas Price Outlook
Source: FRC/ Sproule / GLJ
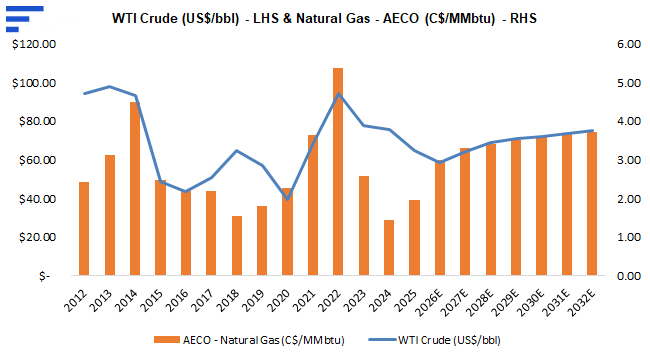
Consensus oil price forecasts are relatively flat since our previous report, and remain well above 10-year averages, supporting a positive outlook for the oilfield services sector
Source: FRC/Various
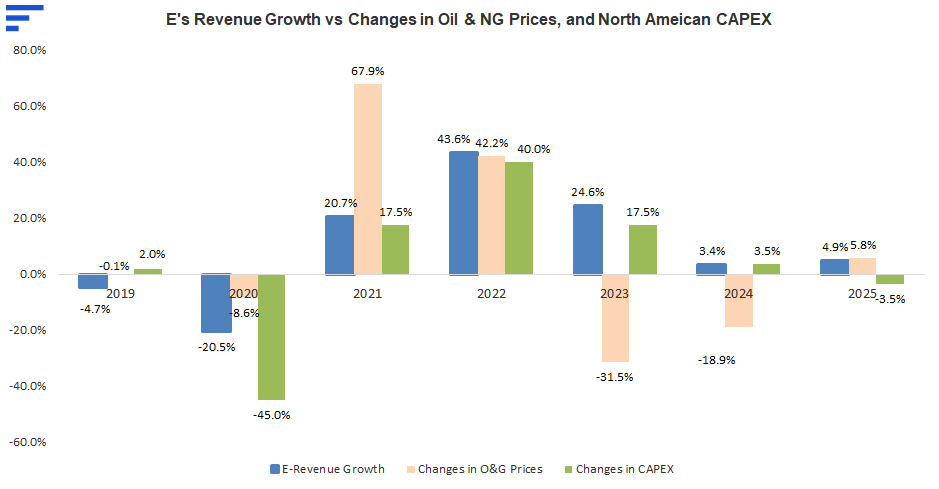
E's revenue generally tracks changes in oil and gas prices, and sector CAPEX spending
Historically, a 1.0% change in oil and gas prices, and CAPEX spending, has led to a 1.2% change in E's revenue
FRC Projections and Valuation
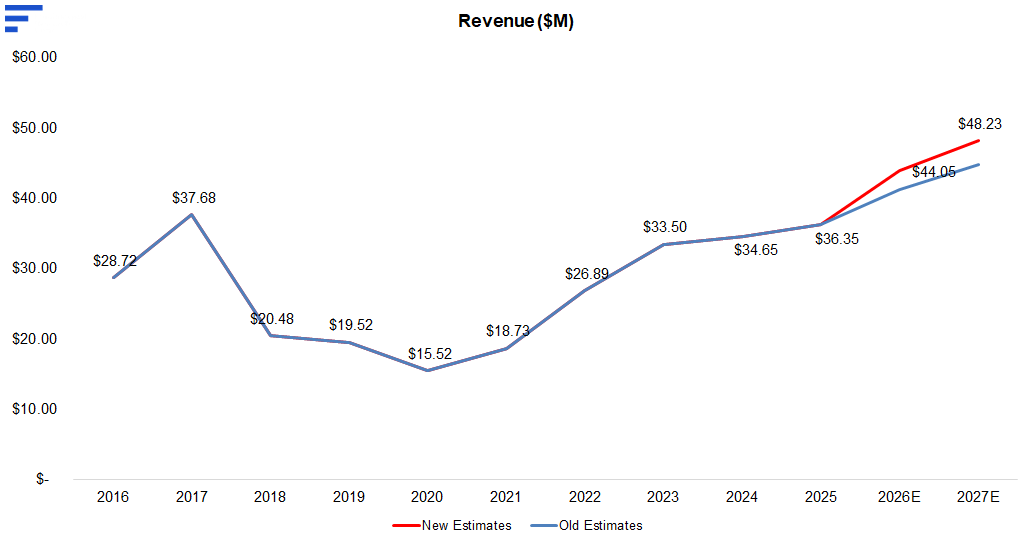
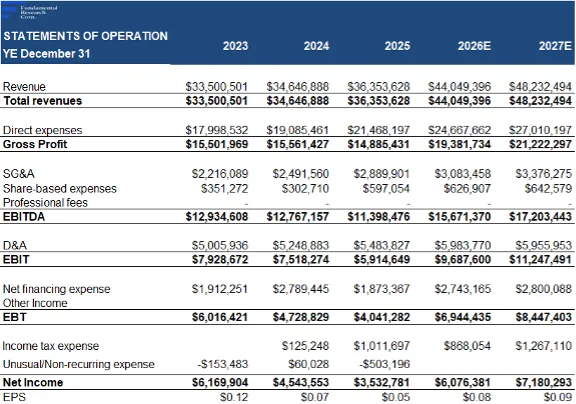
Based on Q2 results, we are raising our full-year revenue and EPS estimates
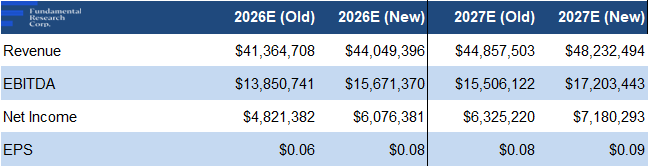
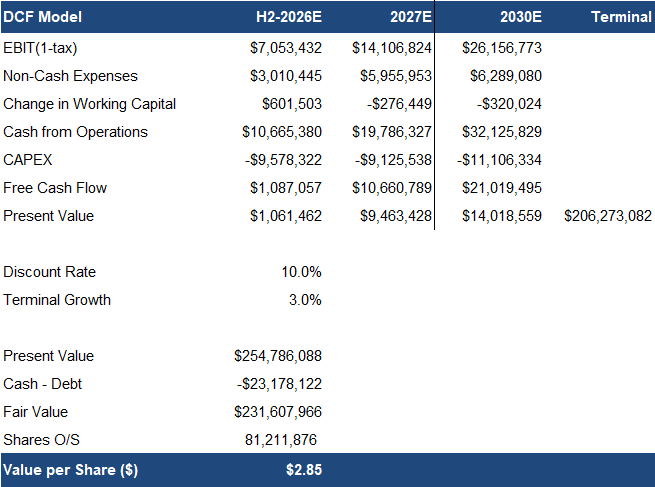
Source: FRC
As a result, our DCF valuation increased from $2.73 to $2.85/share
Source: FRC / S&P Capital IQ
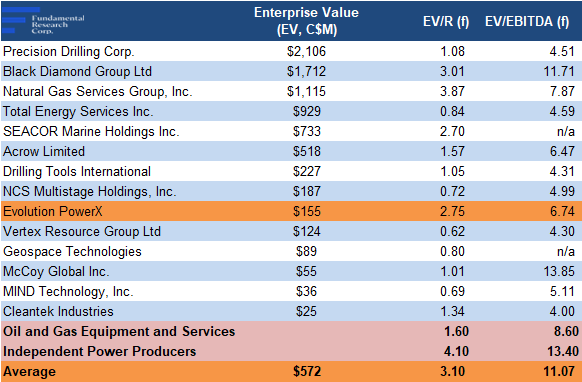
We have added independent power producers (IPPs) to our peer group to reflect E’s growing power-generation focus
IPPs trade at ~2x the EV/Revenue and EV/EBITDA multiples of oilfield services peers
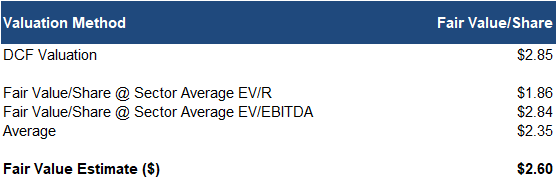
Combined with our higher revenue and EBITDA forecasts, this increases our comparables valuation from $1.47 to $2.35/share
Source: FRC
Based on our updated DCF and comparables valuation models, our fair value increased from $2.10 to $2.60/share
We are reiterating our BUY rating, and adjusting our fair value estimate from $2.10 to $2.60/share. The company’s shift toward natural-gas power generation is gaining traction, with repeat customer deployments, and strong Q2 results supporting our higher forecasts. We believe the transition could also drive a valuation re-rating, as power producers trade at significantly higher multiples than oilfield services companies.
Risks
We believe the company is exposed to the following key risks (not exhaustive):
Maintaining our risk rating of 3 (Average)
APPENDIX



.webp&w=128&q=75)


Discussion
Comments reflect the views of individual users, not FRC. Nothing posted in the comments section — by users or otherwise — should be taken as investment advice.