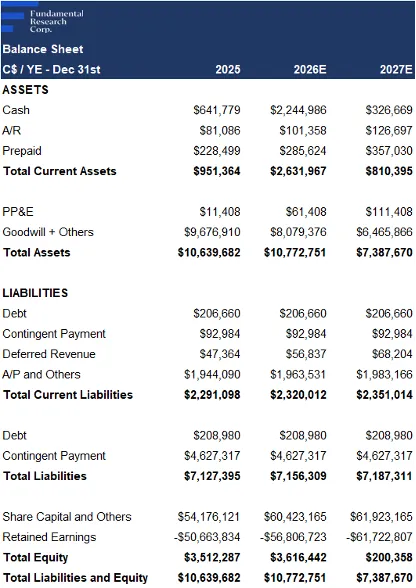
- Post-Year-End Financing Strengthens Balance Sheet: Raised $6.44M via equity and warrant exercises post year-end, with potential for $2M additional from in-the-money options. We do not foresee any need for additional capital raises this year, implying no near-term share dilution.
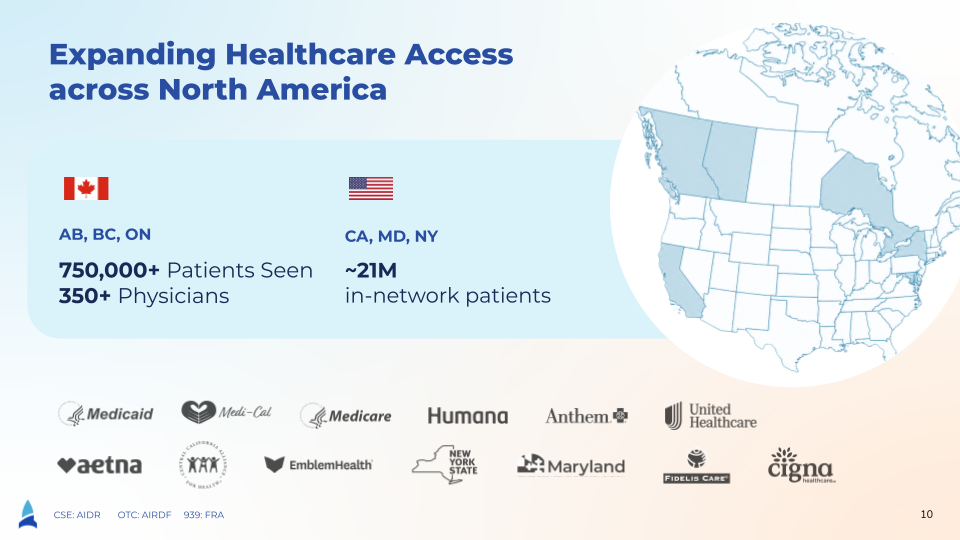
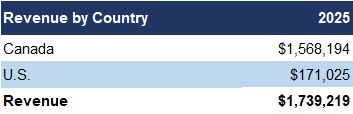
- Geographic Mix: Canada Core, U.S. Expansion Underway: 90% of 2025 revenue came from Canada, with the remainder from the U.S. While Canadian operations have been active since 2020, U.S. expansion began in 2025. Since our previous report, the company has added multiple insurers in New York and California, expanding access to millions of additional individuals through their health plans. RD’s network spans ~21M individuals, across ~20 insurers/payers in the U.S.
- Rural Access Partnership with Lethbridge County, Canda: While the company’s core focus remains U.S. expansion, it continues to build out its Canadian presence. It has partnered with Lethbridge county in Alberta to provide rural residents with virtual access to licensed physicians, supporting ongoing organic growth in Canada.
- Valuation: Trading at Significant Discount to Peers: RD trades at 6x forward EBITDA vs. 18x sector average, a 65% discount. We expect a material revenue increase and EPS improvement in 2026, the first full year post–Rocket Doctor acquisition. We continue to forecast profitability by 2028, unchanged from our prior outlook.
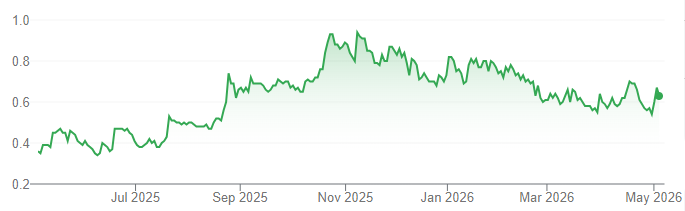
Price and Volume (1-year)
| |
YTD |
12M |
| AIDR |
-23% |
75% |
| CSE |
5% |
47% |
* Rocket Doctor AI has paid FRC a fee for research coverage and distribution of reports. See last page for other important disclosures, rating, and risk definitions. All figures in C$ unless otherwise specified.
Company Overview: A two-pronged business model targeting patients (B2C) and healthcare institutions (B2B)

B2C: Physician-Funded Model (Primary Revenue Driver)
B2B: Institutions license AI tools for training and care
The Rocket Doctor Process
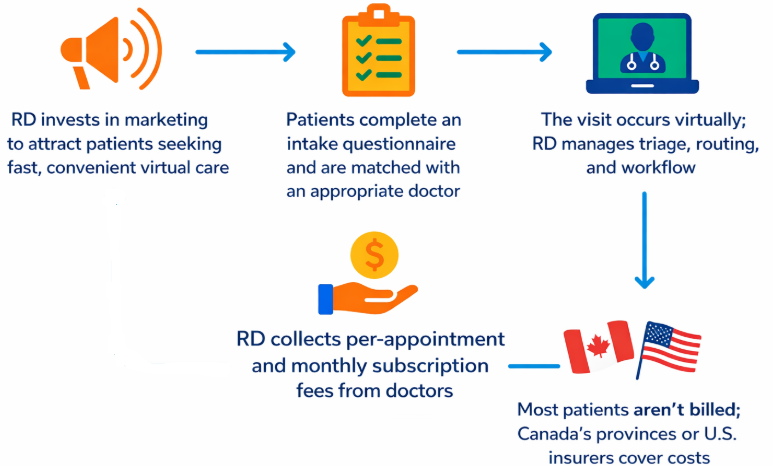
Offers a streamlined virtual care experience from patient intake to payment
Generates revenue from doctors through monthly subscriptions and per-appointment platform fees
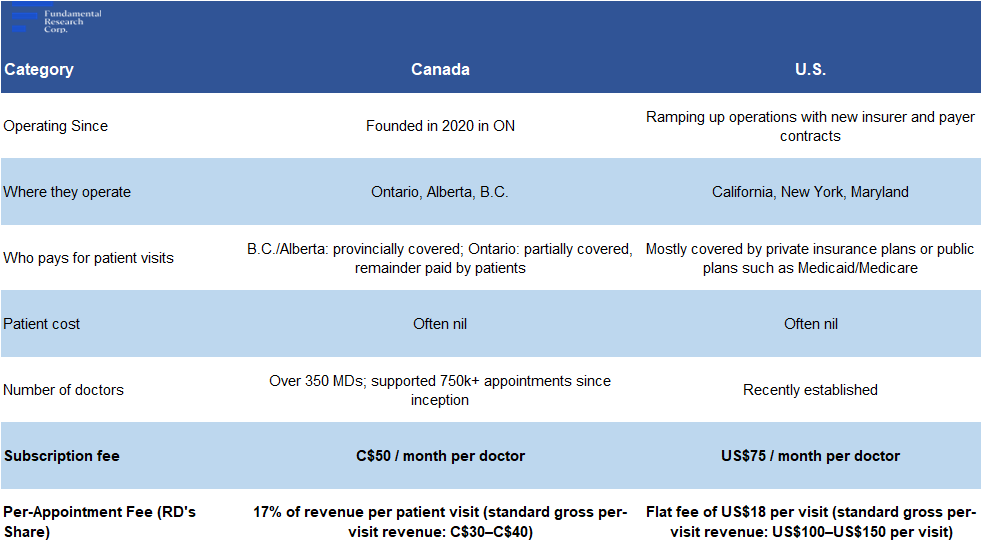
Target Markets
Source: FRC / Company
Operating in Canada since 2020; currently focused on U.S. expansion
RD’s current target pool includes ~46M people across its target regions in the U.S. and Canada
Source: Company
Primarily targets patients using government-funded health insurance (provincial in Canada and Medicaid / Medicare in the U.S.)
Partnerships with ~20 insurers in the U.S.
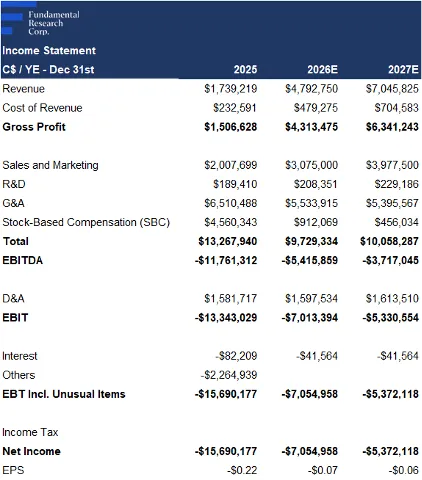
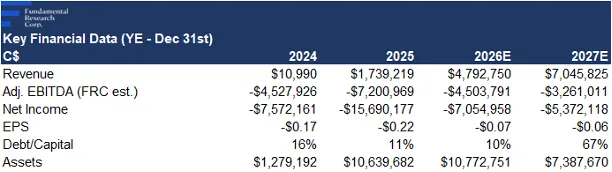
Financials
2025 and 2024 results are not comparable, as material revenue commenced only after the Rocket Doctor acquisition in April 2025.
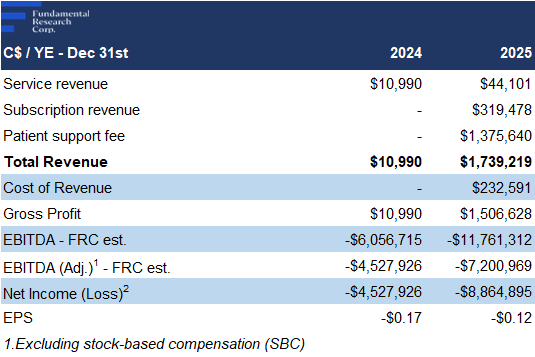
Q3-2025 marked the first full quarter post–Rocket Doctor acquisition, generating $0.53M in revenue, which grew to $0.70M in Q4
2025 revenue was $1.74M, 8% higher than our estimate
Source: FRC / Company
Approximately 79% of revenue came from per-appointment fees, with most of the remainder from subscription fees
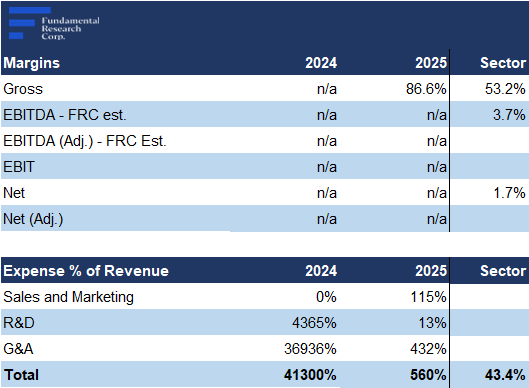
Strong gross margin of 87% vs 88% forecast; well above the 53% healthcare tech average
G&A and R&D expenses were in line with estimates, while sales and marketing exceeded expectations, reflecting continued investment to drive patient adoption; the QoQ revenue growth indicates that marketing spend is proving effective
As a result, EBITDA and EPS were below expectations
Adj. EPS: ($0.12) vs ($0.10 expected)
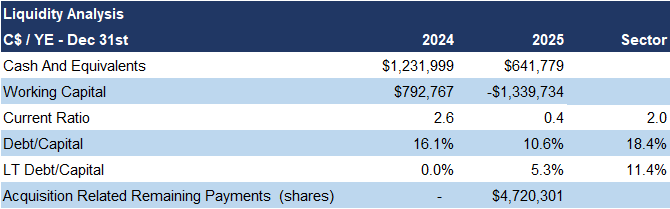
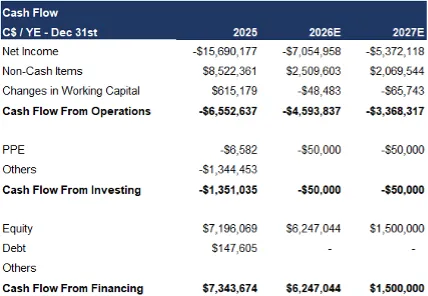
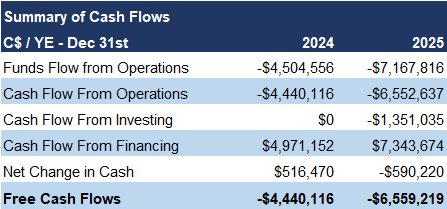
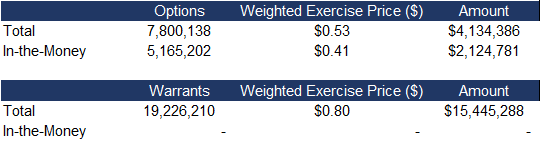
Ended 2025 with $0.64M cash, and minimal debt; raised $6.44M post year-end via equity and warrants, strengthening the balance sheet
In-the-money options can bring in $2M
Source: FRC / Company
We do not foresee a need for additional capital raises this year
FRC Valuation and Rating
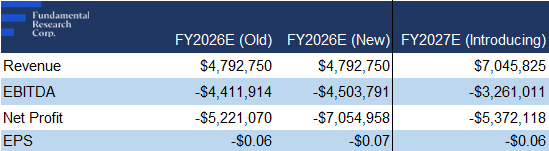
As Q4 expenses came in above expectations, we are lowering our 2026 EPS estimate
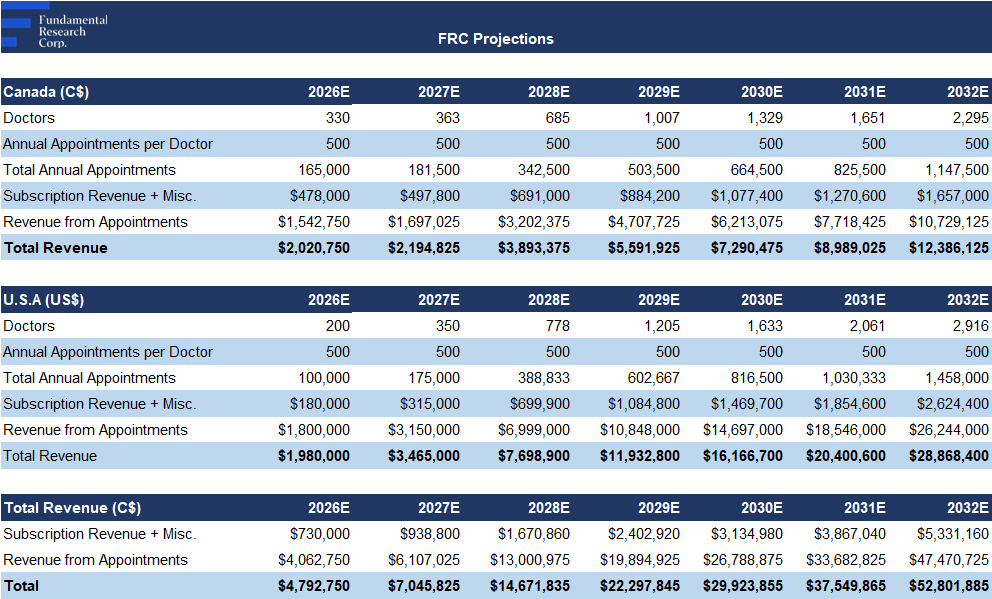
We are continuing to value RD based on the assumption that its network will capture 1.5% of its target market in Canada, and 3% in the U.S. by 2032
We assume a higher market share in the U.S., reflecting relatively high barriers to entry, and RD’s established insurer partnerships
Source: FRC
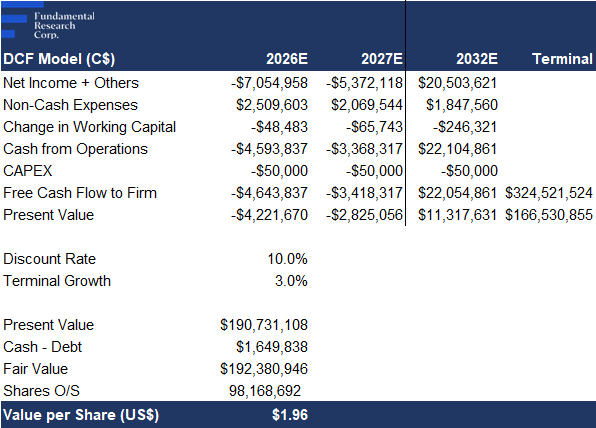
Our DCF model returned a fair value estimate of $1.96/share (previously $2.04/share), primarily due to share dilution since our previous report
*We use the present value of our 20 30 EBITDA estimate for RD in this calculation.
Source: FRC / S&P Capital IQ
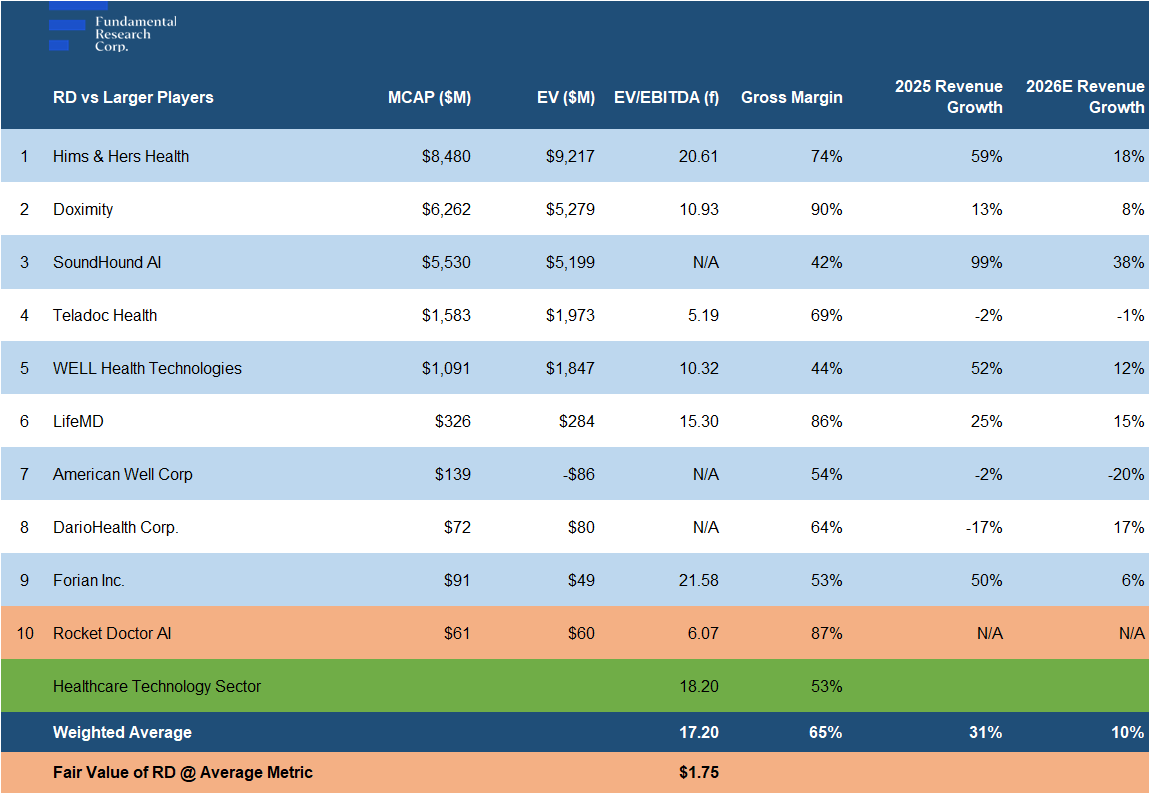
RD is trading at 6x forward EBITDA (previously 8x) vs the sector average of 17x (previously 22x), a 65% discount
Applying the sector multiple yields a comparables valuation of $1.75/share (previously $2.15/share)
We reiterate our BUY rating, and adjust our fair value estimate from $2.10 to $1.86/share (the average of our DCF and comparables valuations). The valuation decline is primarily due to share dilution. Overall, RD’s latest results highlight continued traction on the platform. We believe expanding U.S. insurer access , and a strengthened balance sheet, support a clearer path toward profitability.
Risks
We believe the company is exposed to the following key risks (not exhaustive):
- Competition from established telehealth providers
- Regulatory changes
- Early-stage operations; not yet profitable
- New entrant in the U.S.; high customer acquisition costs and uncertain adoption
- Cybersecurity and data privacy risks, including patient data breaches
- Scaling challenges in building doctor and patient networks
- Need to raise equity to fund marketing and growth, with potential for share dilution
We are maintaining a risk rating of 4 (Speculative)
APPENDIX