- Shares Underperform Despite Strong Metrics: Despite 5% revenue growth in 2025 (vs. 3% sector average), and 11% forecast for 2026 (vs. 7% sector average), with comparable margins, and lower leverage (28% vs. 35%), E’s stock has significantly lagged peers (-40% YoY vs. +47% YoY) with no clear justification, highlighting meaningful upside potential.
- Positive Market Environment: Recent spikes in oil prices have renewed interest in the oil and gas sector. While near-term geopolitical tensions could increase volatility, higher oil prices typically drive upstream activity, benefiting oilfield services companies like E. Historically, we estimate that a 1.0% change in oil and gas prices, and CAPEX spending, has led to a 1.2% change in E's revenue.
- 2026 Record Revenue and EBITDA Anticipated: Given our expectation that oil prices will be higher than last year, we anticipate record revenue and EBITDA for E in 2026. Consequently, we anticipate the stock will gradually approach our fair value, as the market recognizes the company’s potential.
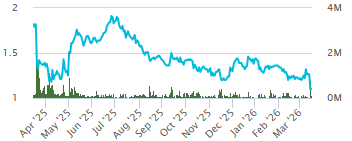
Price and Volume (1-year)
| |
YTD |
12M |
| E |
-24% |
-40% |
| TSX |
3% |
33% |
| Sector* |
34% |
59% |
* Enterprise Group has paid FRC a fee for research coverage and distribution of reports. See last page for other important disclosures, rating, and risk definitions. All figures in C$ except commodity prices which are in US$.
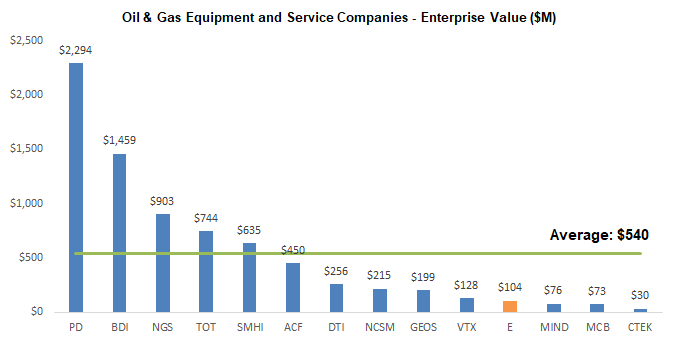
We are benchmarking E against a broad spectrum of oil and gas equipment and service providers, with MCAPs from $50M to $2.5B
Enterprise vs Larger Players
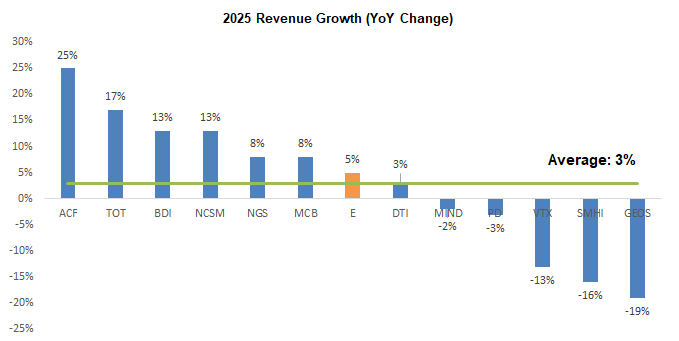
E recorded 5% revenue growth in 2025, outperforming the 3% sector average
Source: FRC / S&P Capital IQ
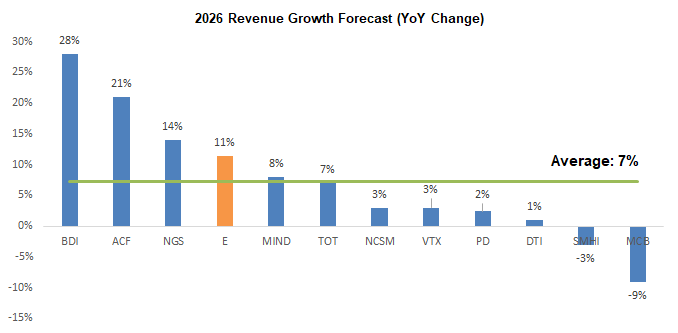
We are projecting 11% revenue growth for E in 2026 vs a 7% sector average
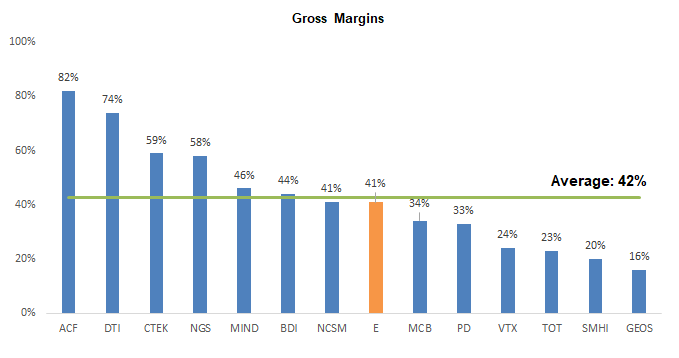
E’s gross margins are in line with the sector average
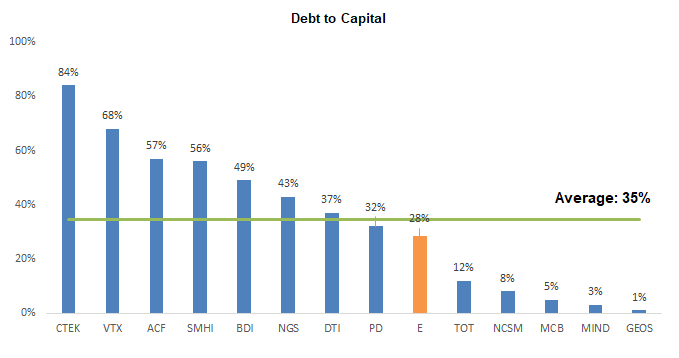
With a lower debt-to-capital ratio, we believe E has a healthier balance sheet
Source: FRC / S&P Capital IQ
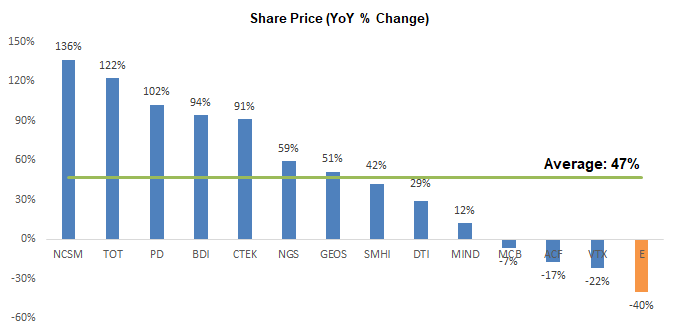
Despite its attractive metrics, the stock has lagged peers, declining 40% YoY, compared with a 47% gain for the sector, making it the worst performer on our list of Oil and Gas Equipment and Service companies, with no clear justification, highlighting potential upside
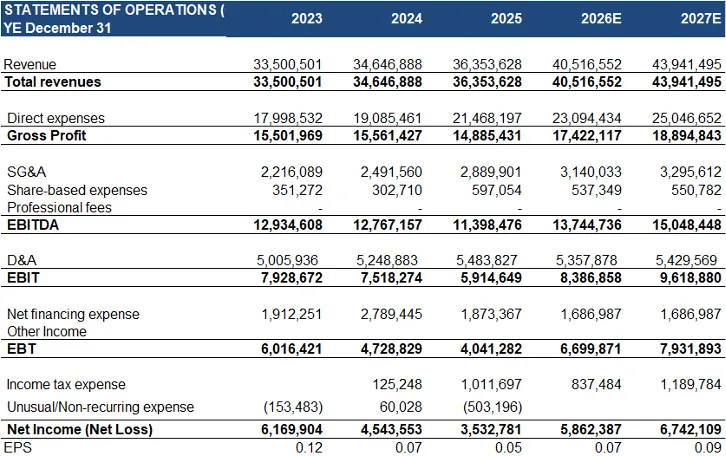
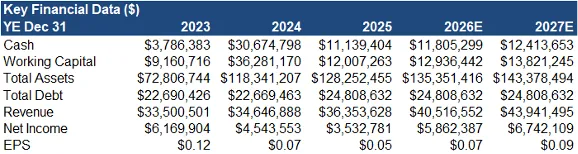
Financials
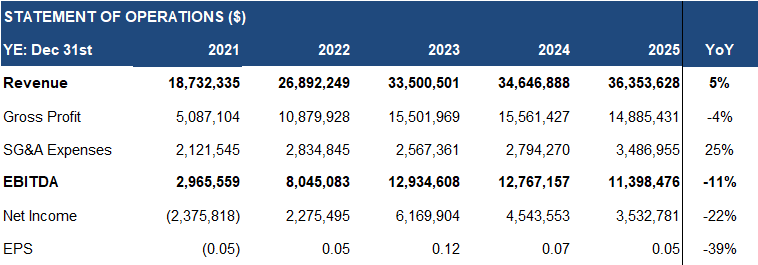
Following a 3% YoY decline in 2025 (9M), a strong Q4 lifted full-year revenue to 5% YoY growth, exceeding our estimate by 2%
Gross margins fell 4 pp YoY to 41%, slightly below our forecast of 42%
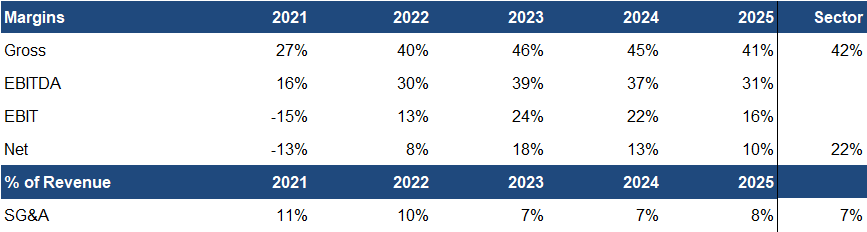
*Sector: Oil & Gas Machinery Rental and Leasing
G&A expenses rose 25% YoY, coming in 2% above our estimate
EPS declined 39% YoY to $0.05/share, vs our forecast of $0.06, primarily due to lower gross margins
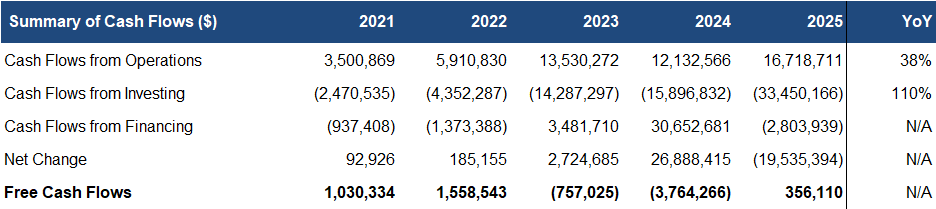
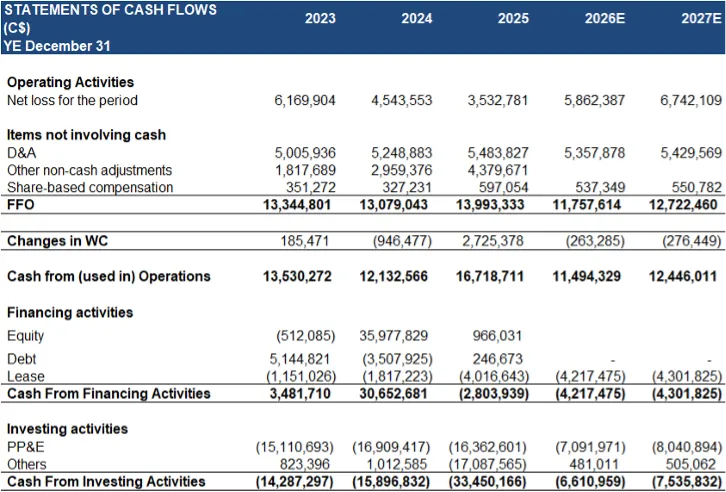
CAPEX surged 110% YoY to $33M, largely driven by the FlexEnergy acquisition in Q2
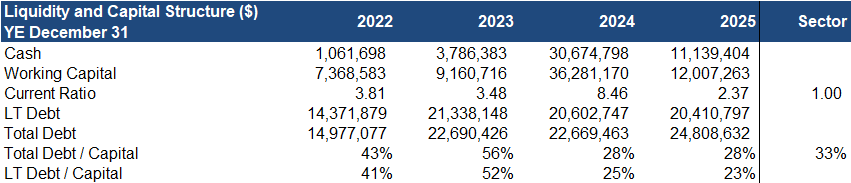
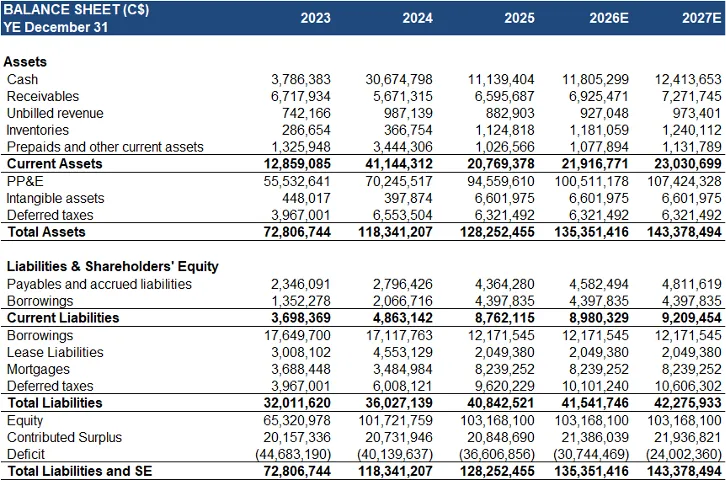
Debt-to-capital remained flat YoY, and below the sector average of 35%, indicating a healthy balance sheet
Source: FRC / Company
Oil & Gas Price Outlook
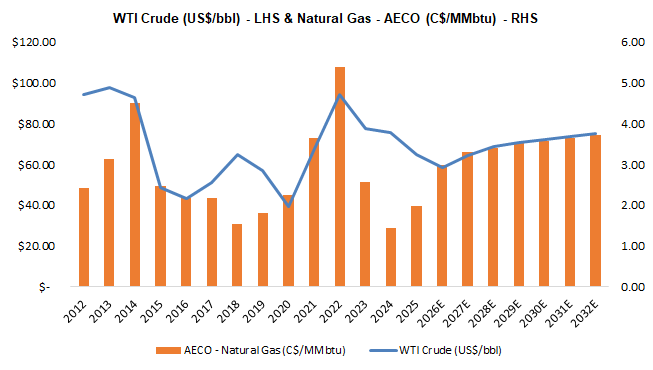
Source: FRC/ Sproule / GLJ
Consensus near- and long-term price forecasts remain well above 10-year averages ($64/bbl for oil and $1.82/mmbtu for gas), supporting a positive outlook for the oilfield services sector
Note that these consensus forecasts are as of January 2026, and do not reflect recent market developments; we expect actual 2026 prices to be significantly higher
Source: FRC/Various
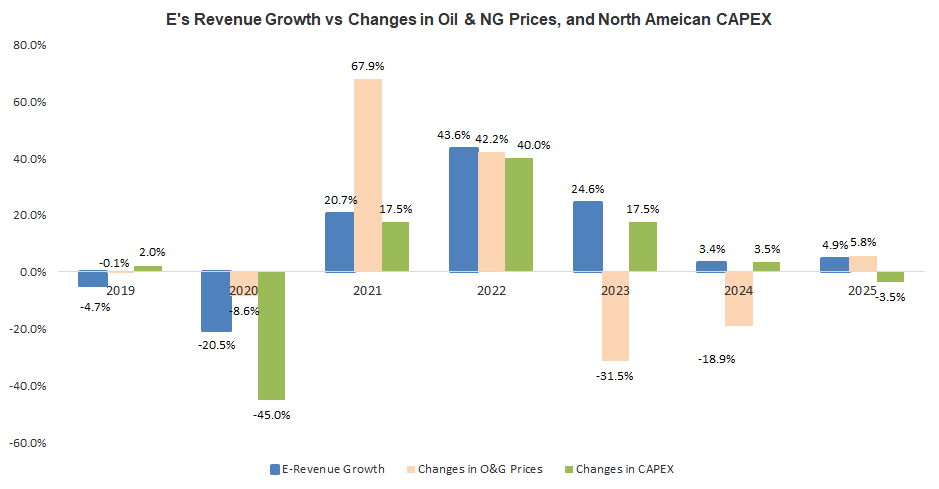
E's revenue generally tracks changes in oil and gas prices, and sector CAPEX spending
Historically, a 1.0% change in oil and gas prices, and CAPEX spending, has led to a 1.2% change in E's revenue
FRC Projections and Valuation
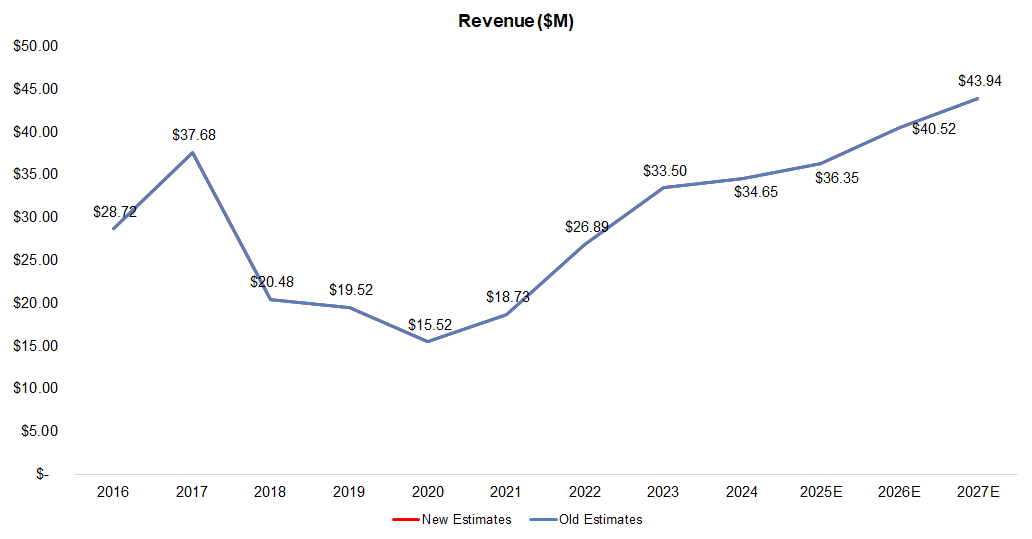
Following the recent oil price surge and anticipated higher activity in 2026, we are revising our revenue forecast upward, while lowering EPS, due to weaker gross margins
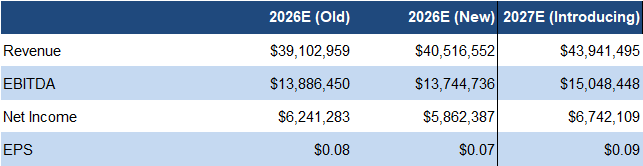
Source: FRC
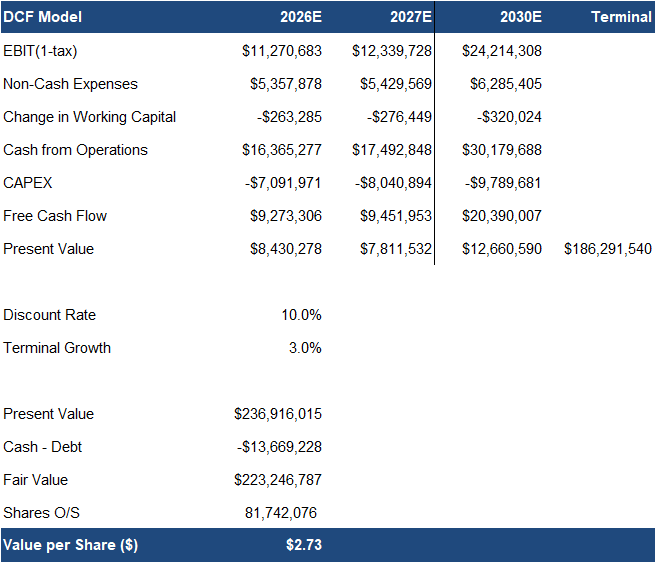
As a result, our DCF valuation declined from $2.89 to $2.73/share
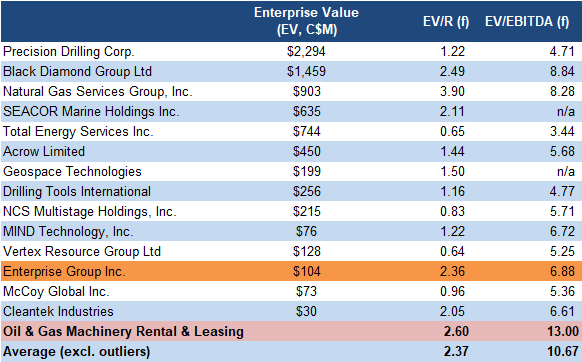
Source: FRC / S&P Capital IQ
Sector multiples are up 8% since our previous report in November 2025
Source: FRC
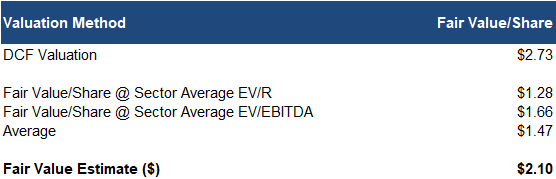
Our fair value decreased from $2.38 to $2.10/share, driven by our lower EBITDA forecasts, partially offset by higher sector multiples
We are reiterating our BUY rating, and adjusting our fair value estimate from $2.3 8 to $2. 10 /share (the average of our DCF and comparables valuations). Strong Q4 performance reversed early 2025 weakness, delivering full-year revenue growth, while maintaining a healthy balance sheet. Although near-term geopolitical tensions could cause stock price volatility, we anticipate record revenue and EBITDA in 2026. Overall, the stock remains underappreciated by the market.
Risks
We believe the company is exposed to the following key risks (not exhaustive):
- The oil/gas field services market is highly dependent on oil and gas prices
- Operates in a competitive space
- Revenue and growth are tied to sector CAPEX levels
- Exposed to geopolitical risks and regulatory changes
- Balance sheet strength is critical for weathering industry downturns
Maintaining our risk rating of 3 (Average)
APPENDIX