Disclosure: Unknown Company has paid FRC a fee for research coverage and distribution of reports. See last page for other important disclosures, rating, and risk definitions.
The analyst’s rating and fair value are one click away. Free FRC account, no credit card.
Already have an account?

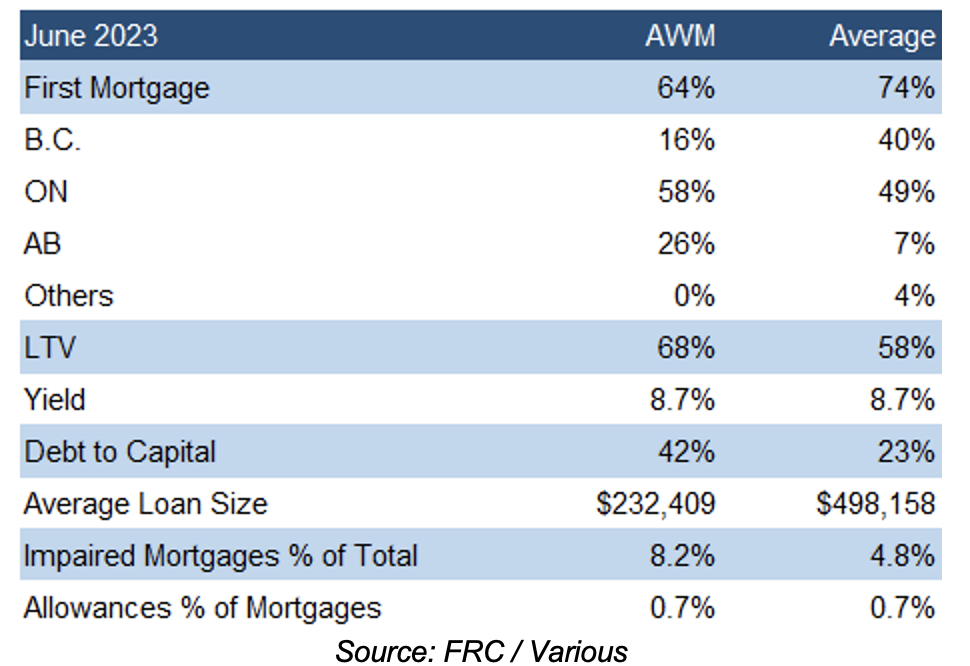
The following table shows how AWM’s portfolio compares to that of other MICs (with AUM of $100M+) focused on single-family residential units.
AWM has lower exposure to first mortgages, significantly smaller loan sizes, and higher debt/capital, LTV, and defaults. AWM's yield, which have historically been higher than the sector average, were in line with the sector average in FY2024, due to higher loan loss provisions
Portfolio Details (YE – March 31st)
 .
.
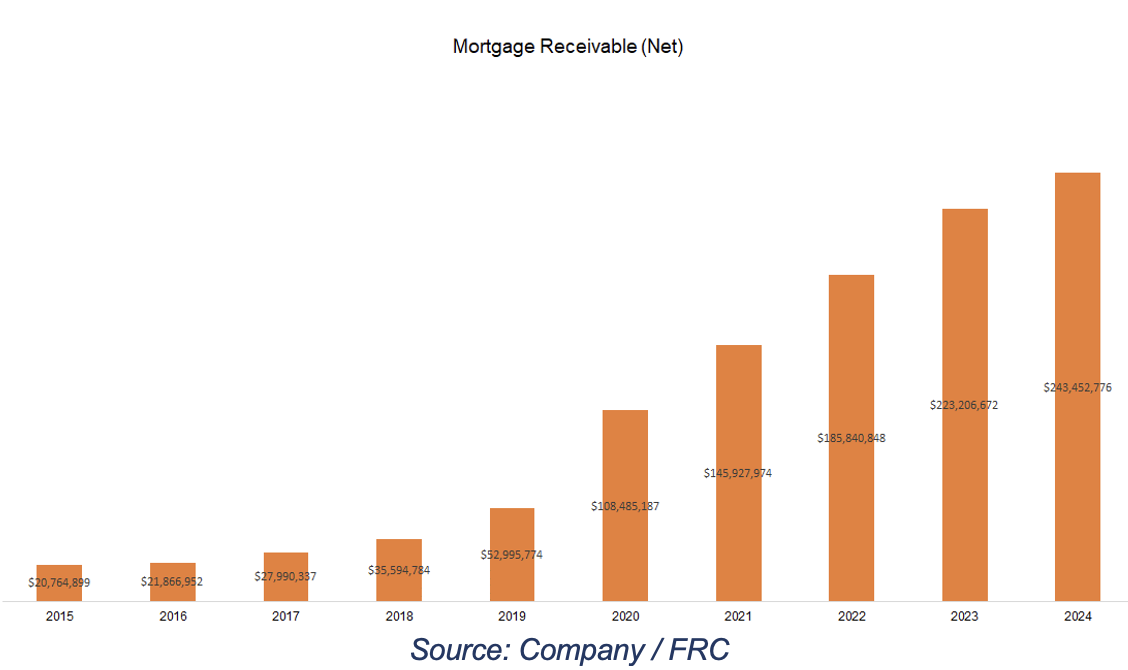
In FY2024, mortgage receivables were up 9% YoY to $243M vs our estimate of $250M
In FY2024, mortgage advancements were down 21% YoY; payouts were up 19% YoY. In Q1-FY2025, mortgage advancements were up 9% YoY; payouts were down 9% YoY
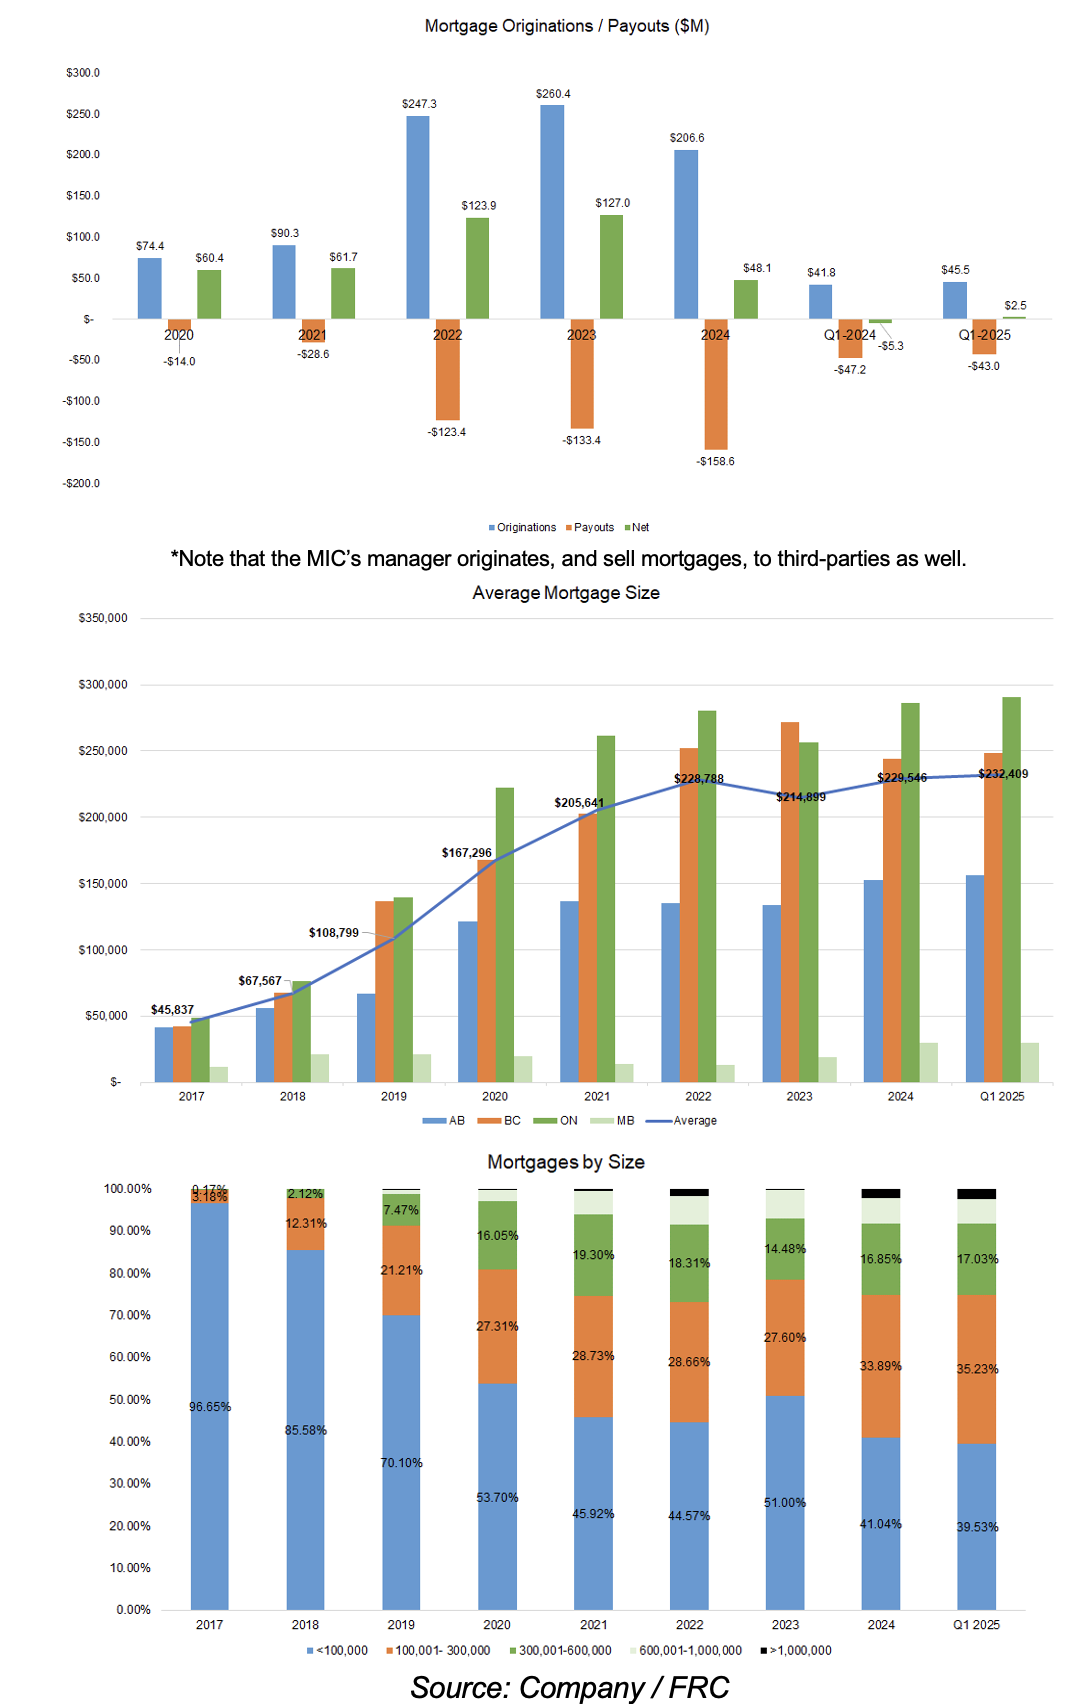
In FY2024, the average mortgage size was up 7% YoY to $230k. 75% of mortgages are <$300k
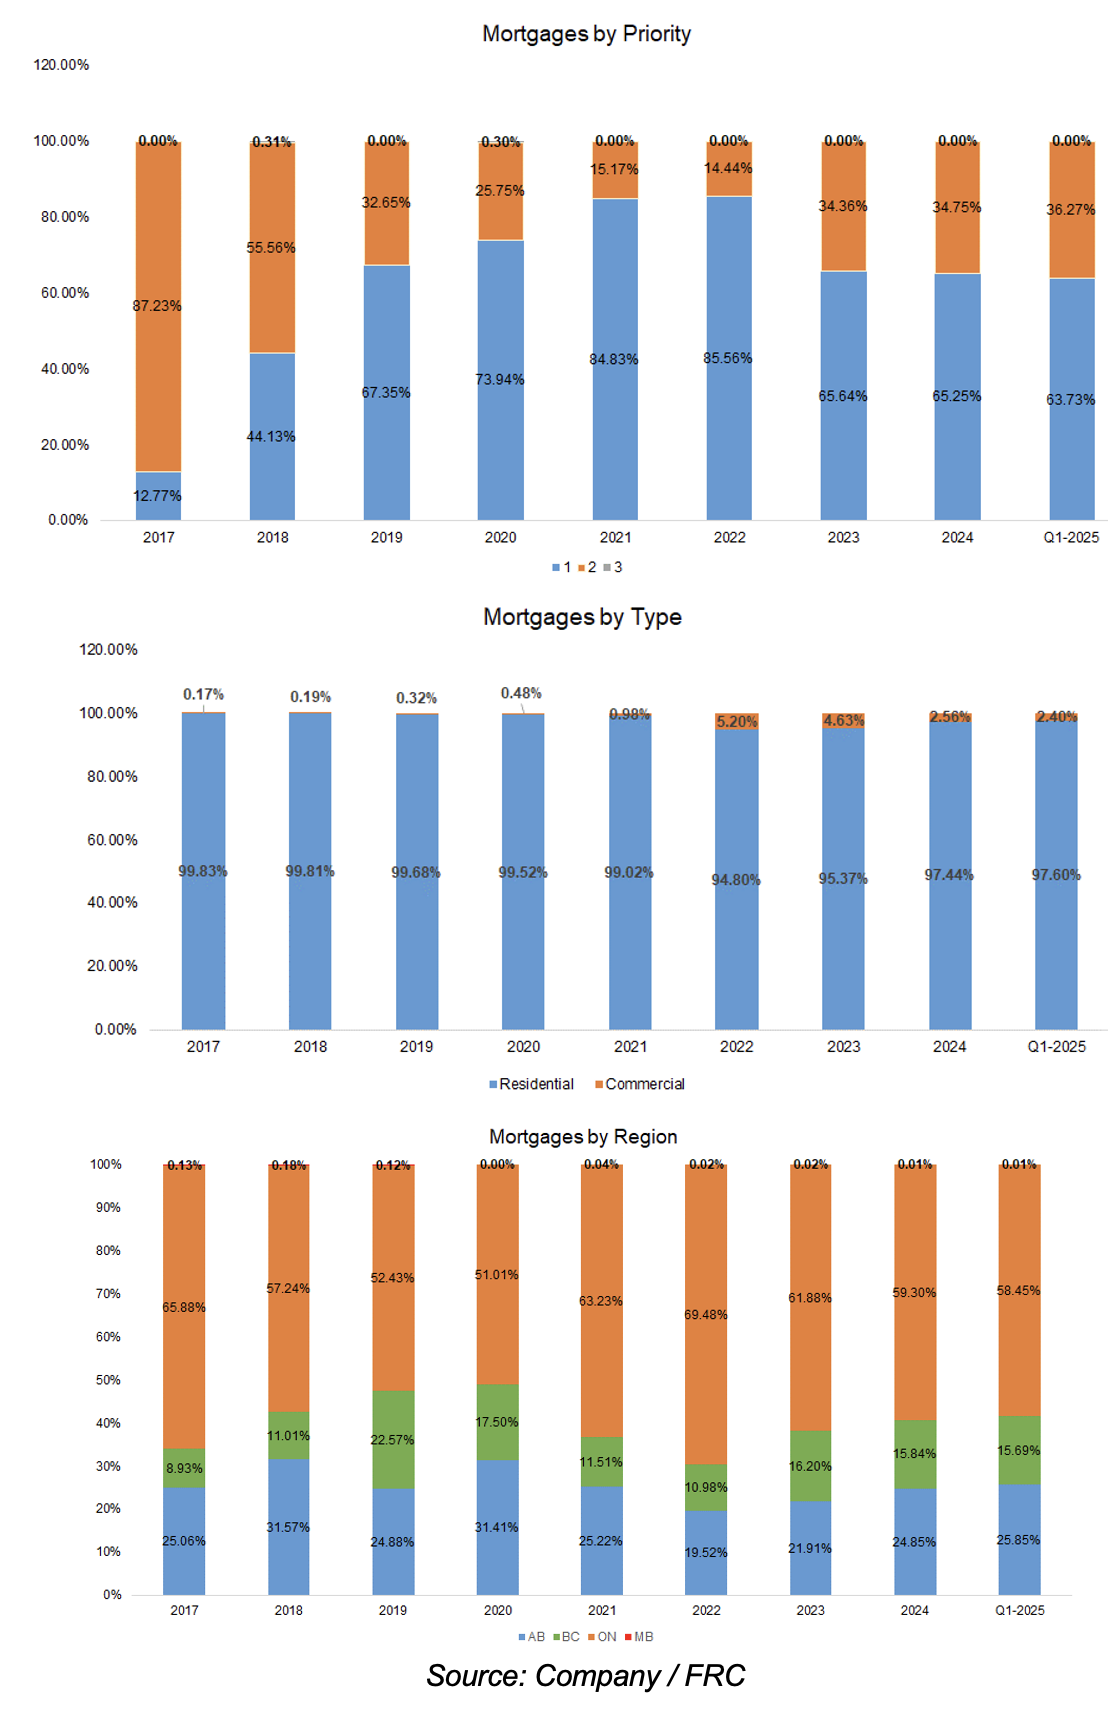
Exposure to first mortgages were down 1 pp to 65%. Increased exposure to residential properties. Focus remains on already-built residential properties
Enhanced geographical diversification by lowering exposure to ON. Focus remains on urban areas
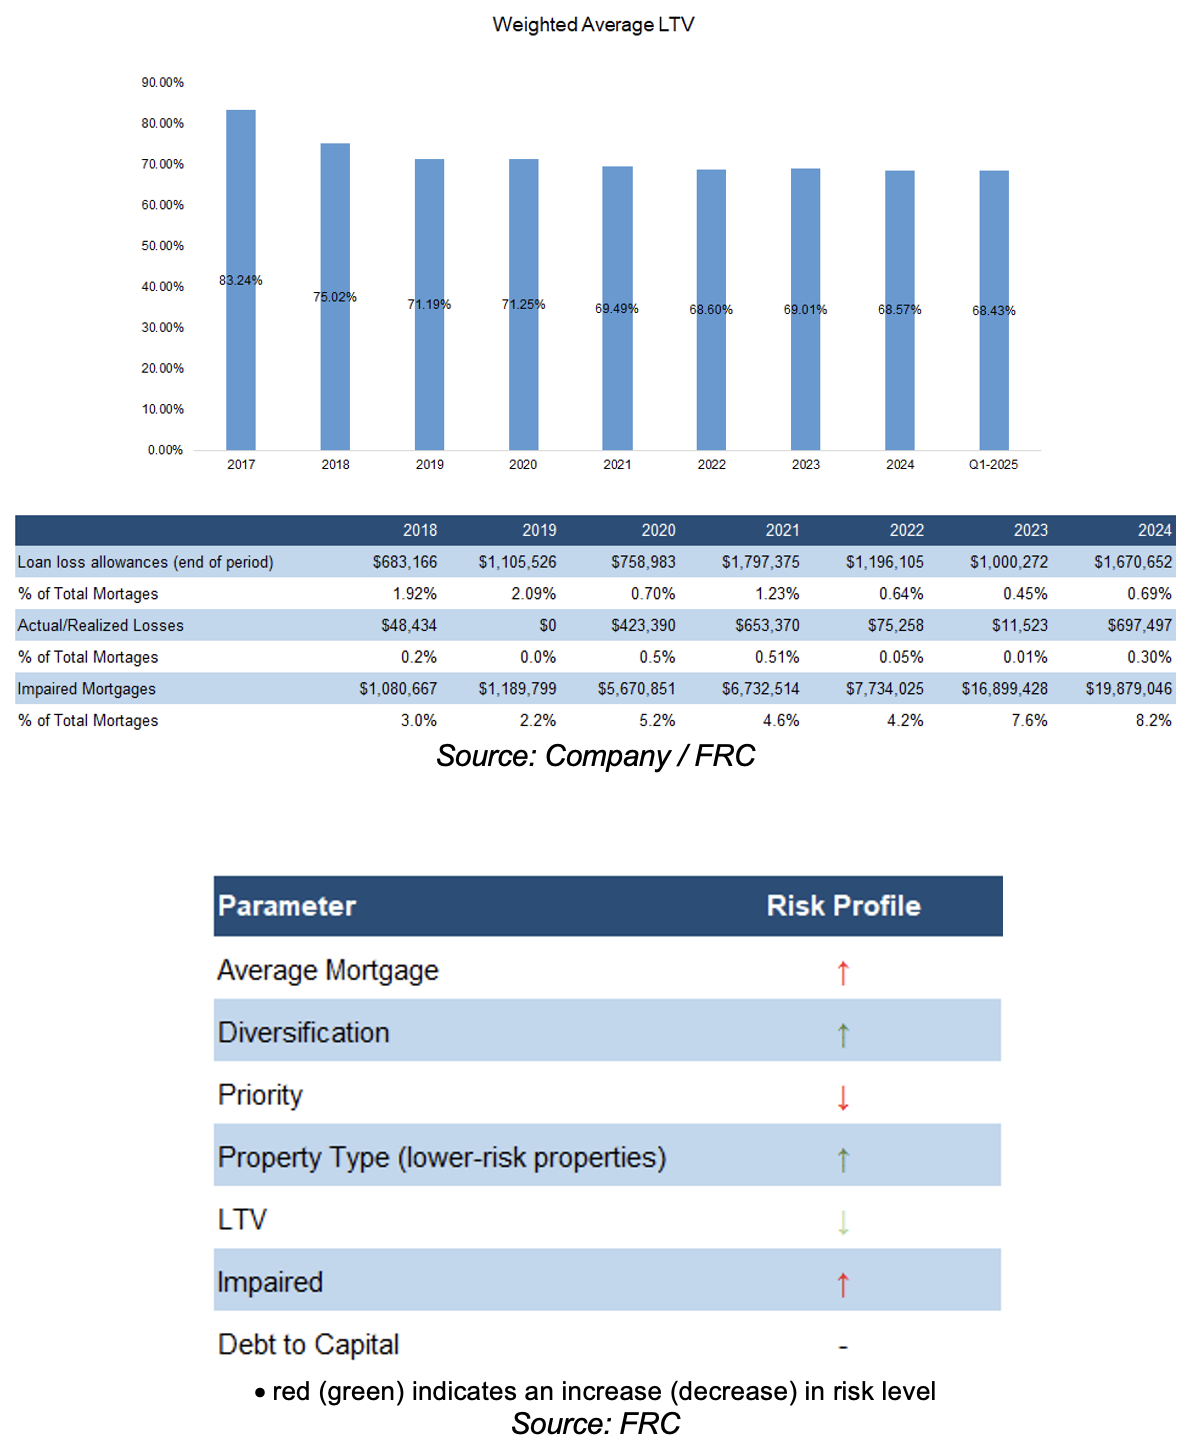
LTV was down slightly. Impaired mortgages increased by 0.6 pp YoY to 8.2% of total mortgages. Loan loss allowances were raised by 0.25 pp to 0.69%
In summary, we believe the portfolio’s risk profile has increased, despite an equal number of red and green signals, primarily due to higher impaired mortgages
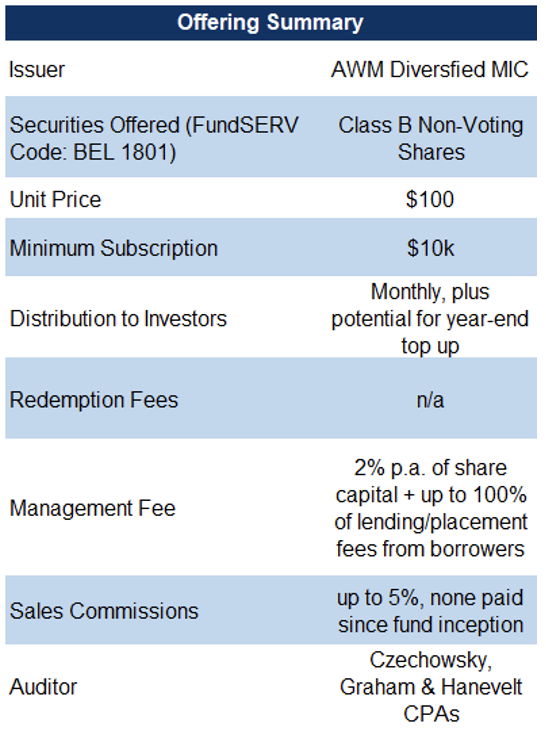
Investors hold Class B shares, allowing them to request redemptions monthly without incurring fees, or facing a lock-up period. It is noteworthy that many MICs typically impose lock-up periods, and early redemption fees. That said, redemptions are not guaranteed.
In FY2024, revenue was up 32% YoY, beating our estimate by 4%. Net income (before paying investors) was up 20% YoY, beating our estimate by 2%
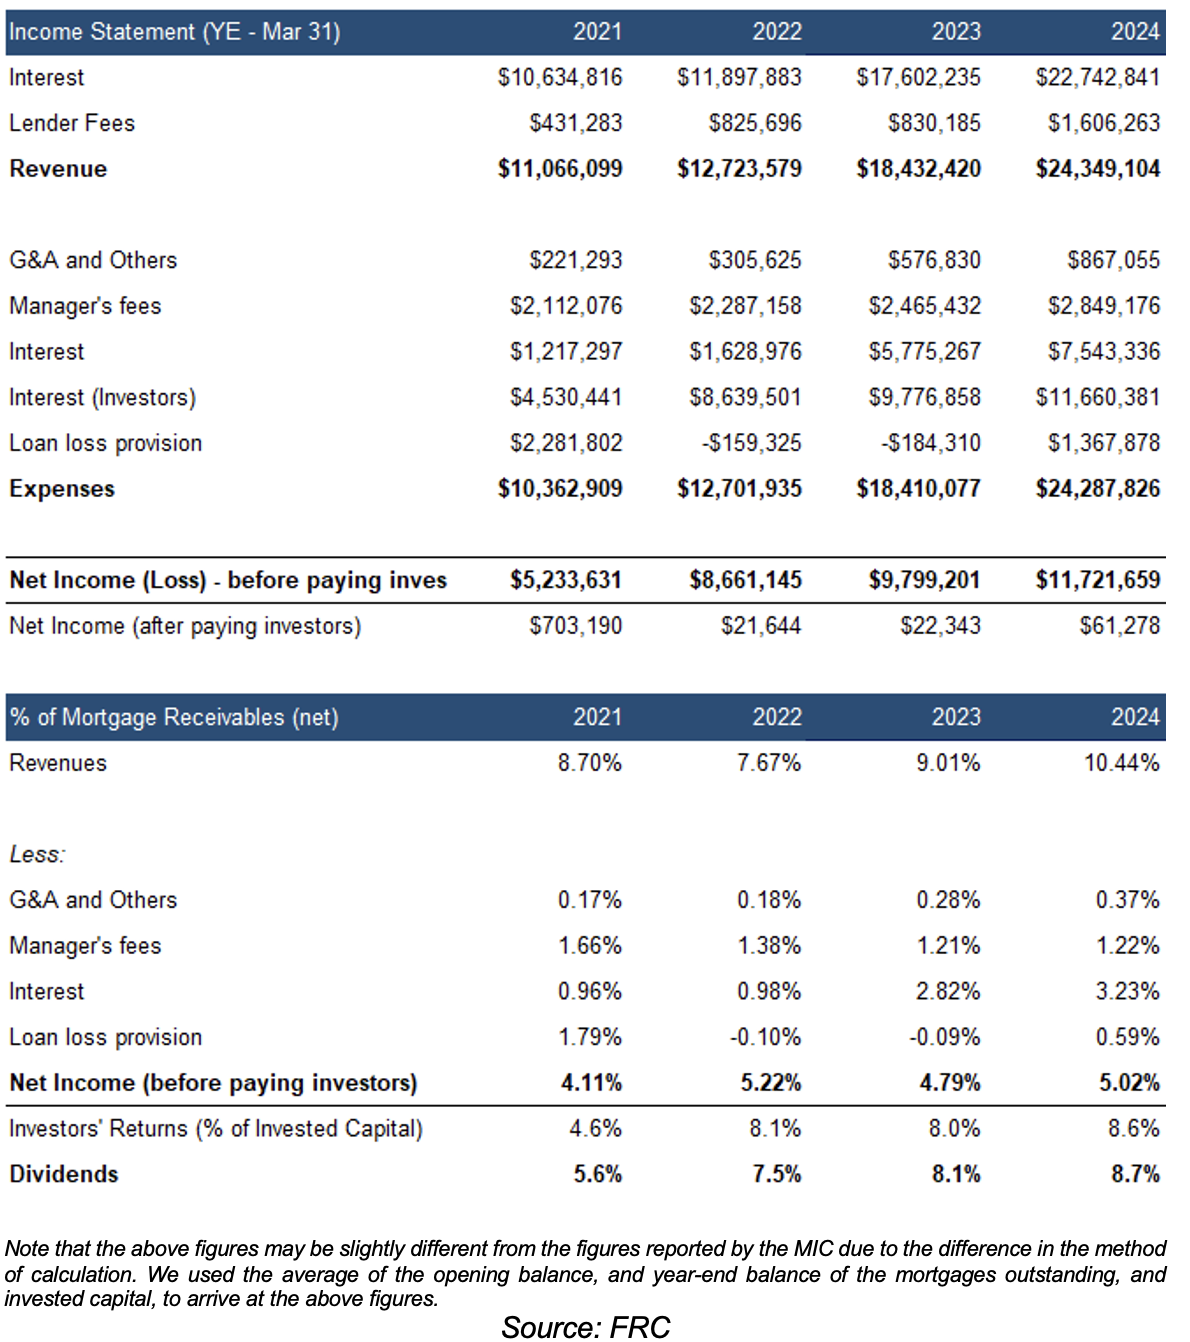
The yield increased by 0.6 pp to 8.7% vs our forecast of 8.3%
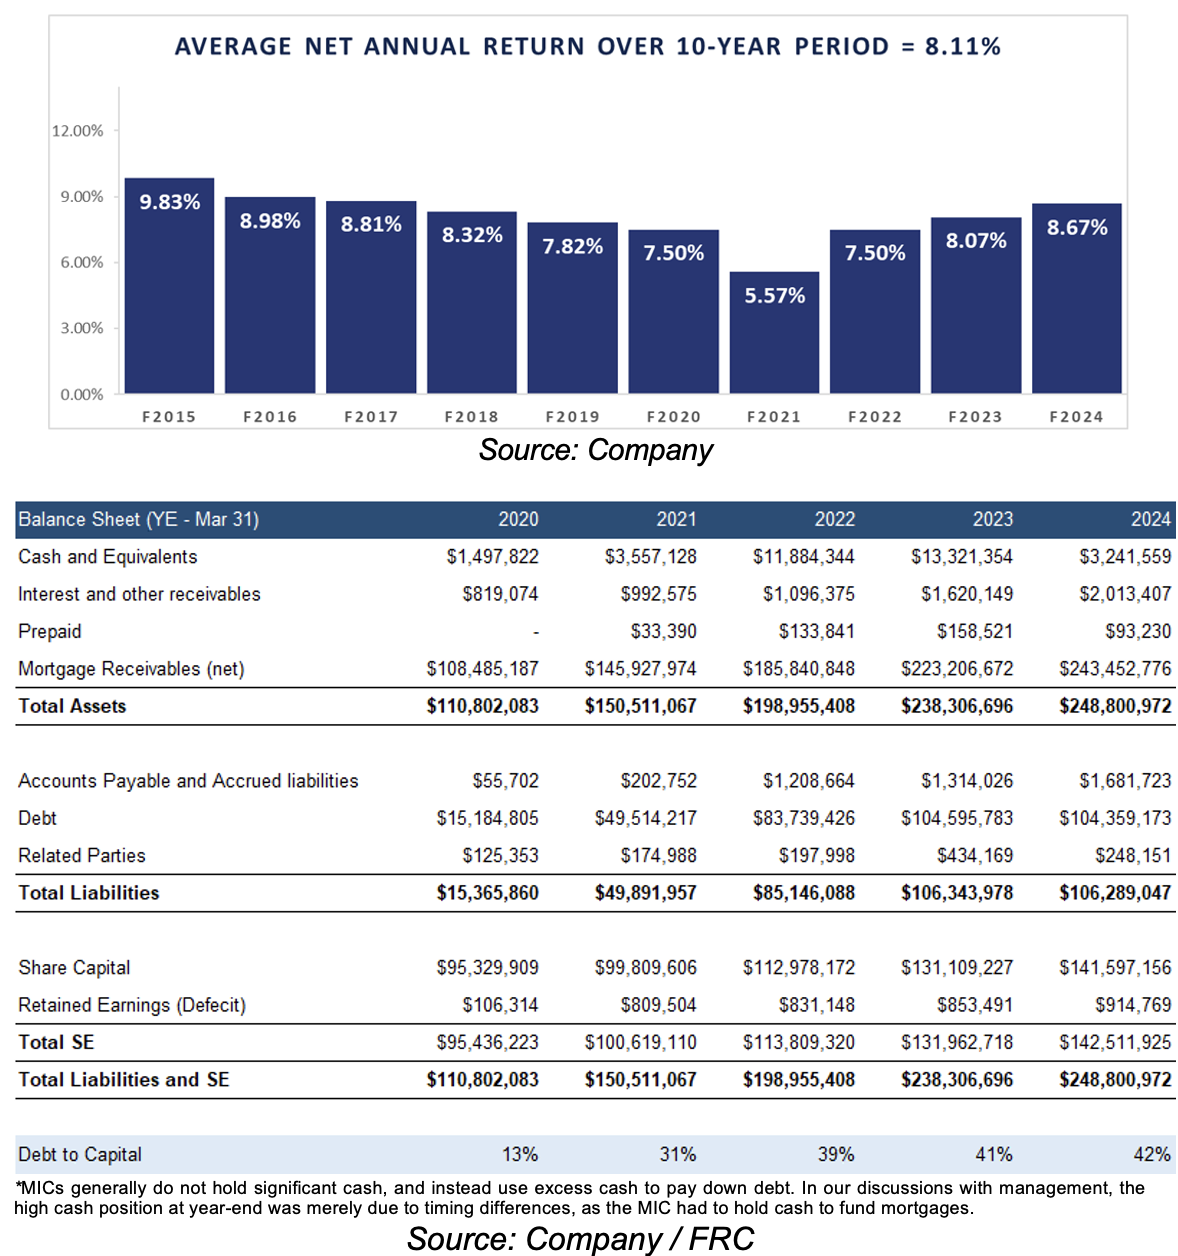
Dividends are paid monthly. $243M in mortgages at the end of FY2024, up 9% YoY.
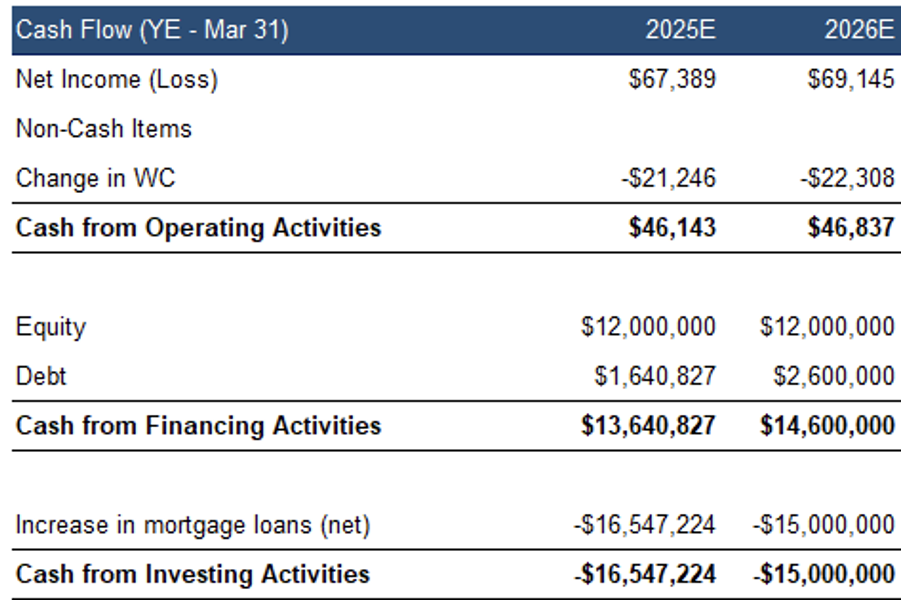
Increased debt to capital by 1 pp to 42%, which we note is on the higher-end among comparables
Management anticipates maintaining debt to capital between 35% and 45%. As lending rates have been higher than expected YTD, we are raising our FY2025 yield forecast from 8.5% to 9.1%. With rates expected to trend downward, we foresee yields peaking in FY2025 and then declining in FY2026
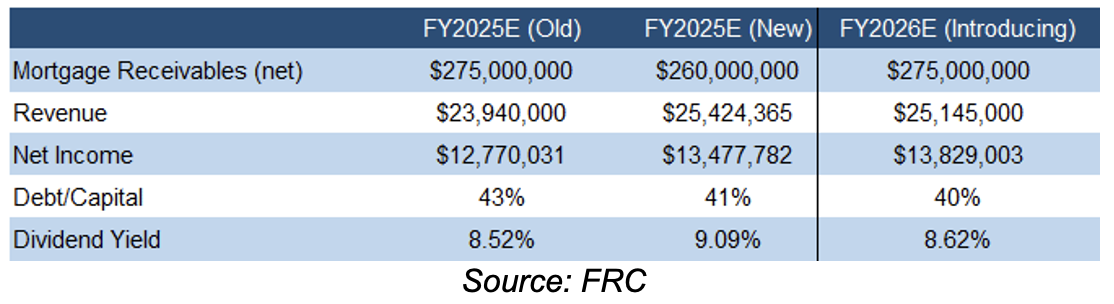
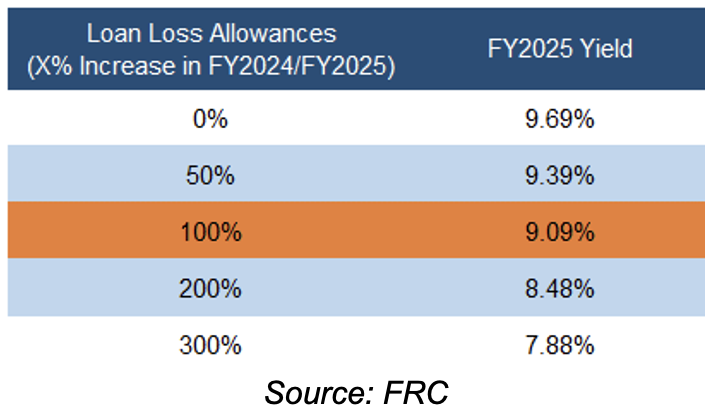
Our estimate for the FY2025 yield varies between 7.9% and 9.7% using various YoY increases in loan loss allowances
We are reiterating our overall rating of 2, and risk rating of 2. With the Bank of Canada implementing three rate cuts since June 2024, and more expected amid easing inflation, we anticipate a decline in defaults in the coming quarters. In light of these anticipated lower rates, we find high-yielding funds, such as AWM, increasingly attractive.
We believe the MIC is exposed to the following key risks:
APPENDIX
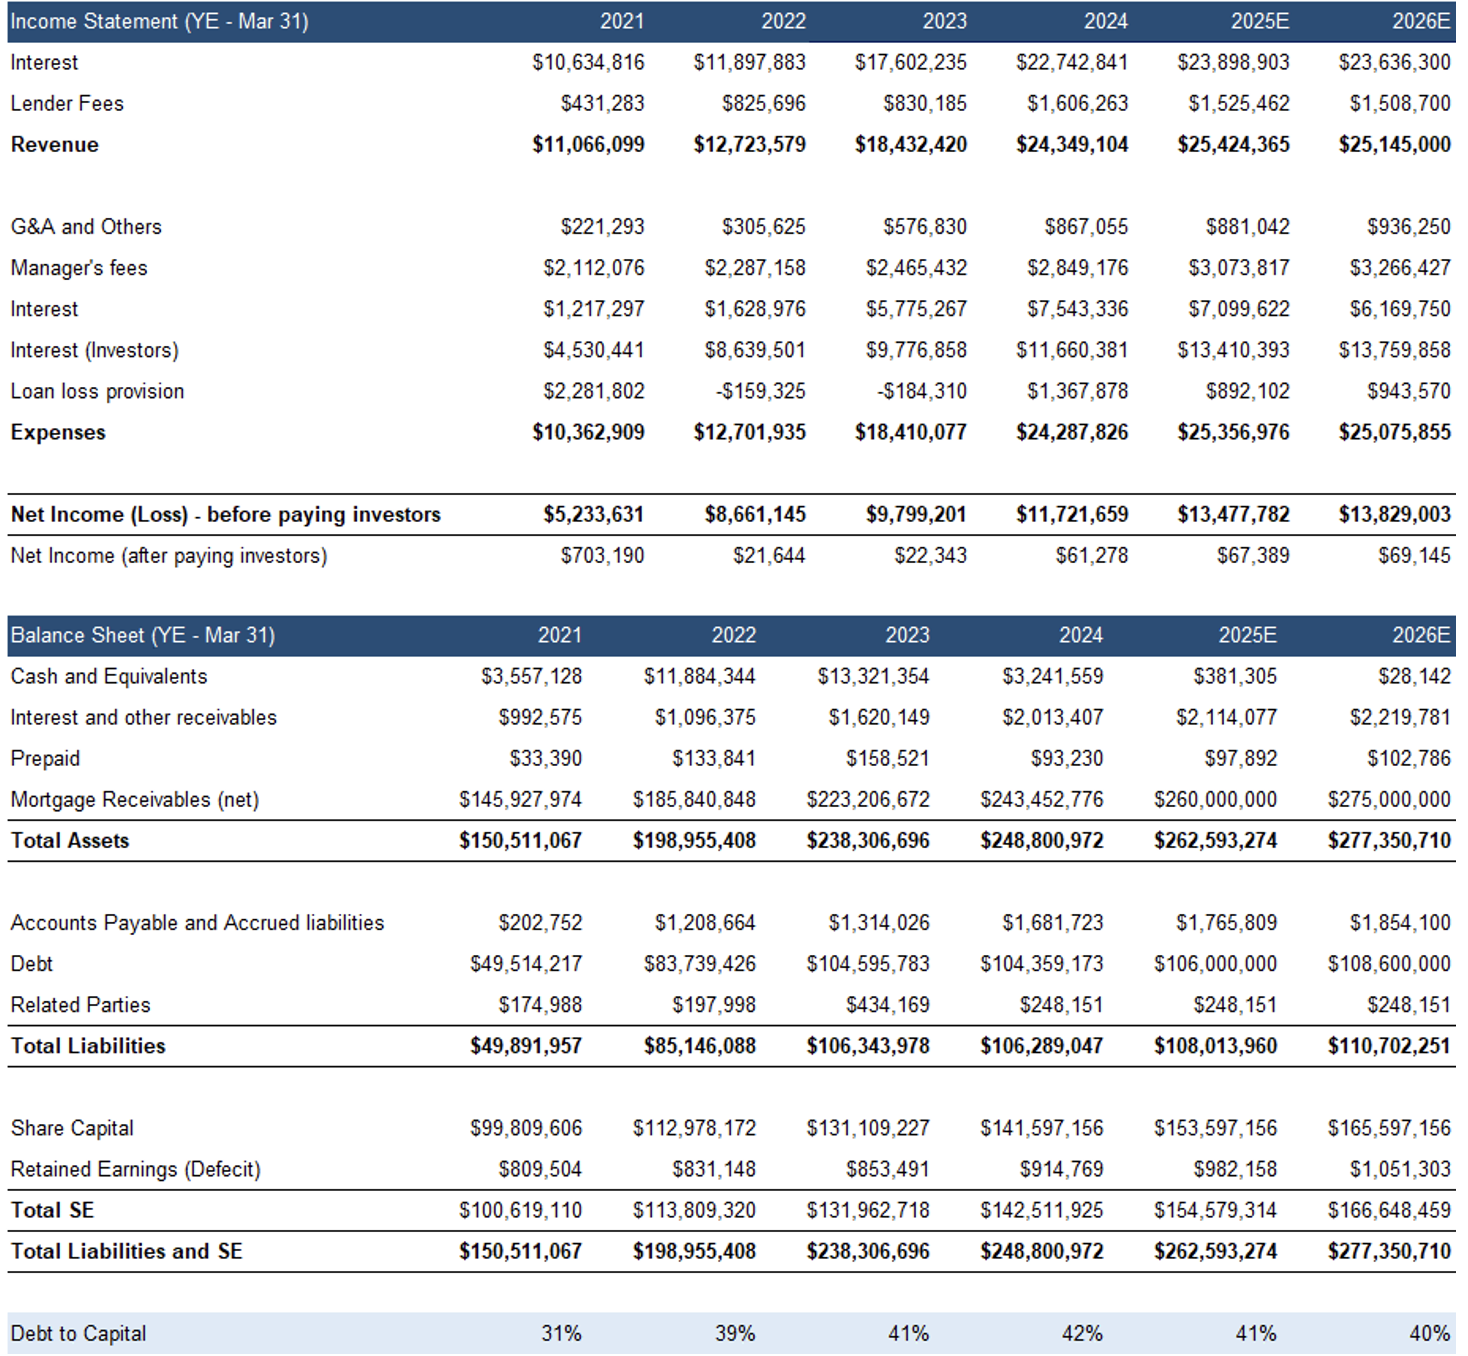
Even though the Manager has rights to 100% of lender fees, they have historically paid a portion of the fees to the fund, which we believe is a good sign for investors. We also understand that there is no guarantee that management will do so going forward.