Disclosure: Olympia Financial Group Inc. has paid FRC a fee for research coverage and distribution of reports. See last page for other important disclosures, rating, and risk definitions.
The analyst’s rating and fair value are one click away. Free FRC account, no credit card.
Already have an account?
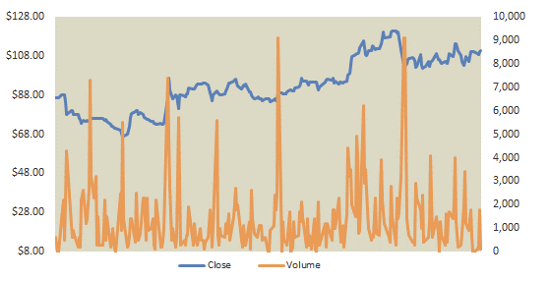
Price Performance (1-year)
*See important disclosures at the bottom of this report rating and risk definitions. All figures in US$ unless otherwise specified.
The leading Canadian custodian/ administrator of alternative investments
OLY managed 132k accounts at the end of 2023; its platform caters to a comprehensive range of investments not supported by banks, and other traditional trading/investment platforms
Source: Company / FRC
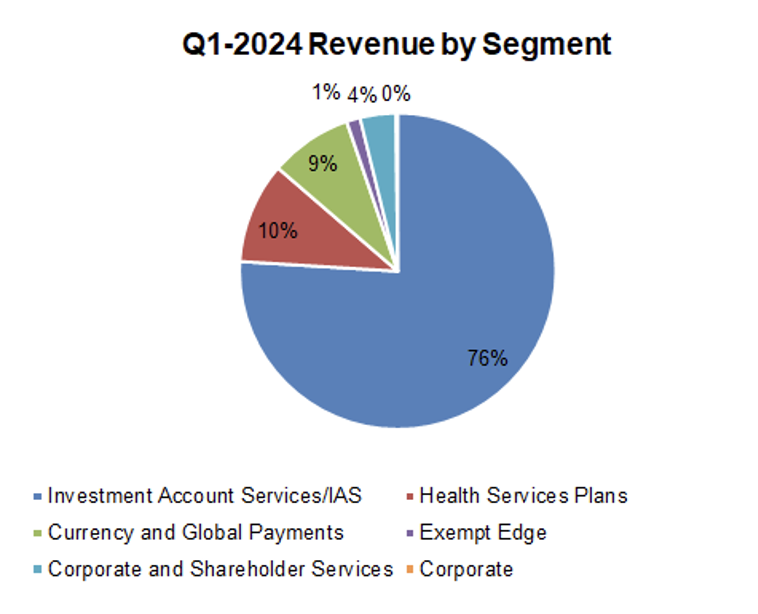
In Q1-2024, 76% of revenue came from IAS, 10% from health service plans, and the remaining 14% from other services
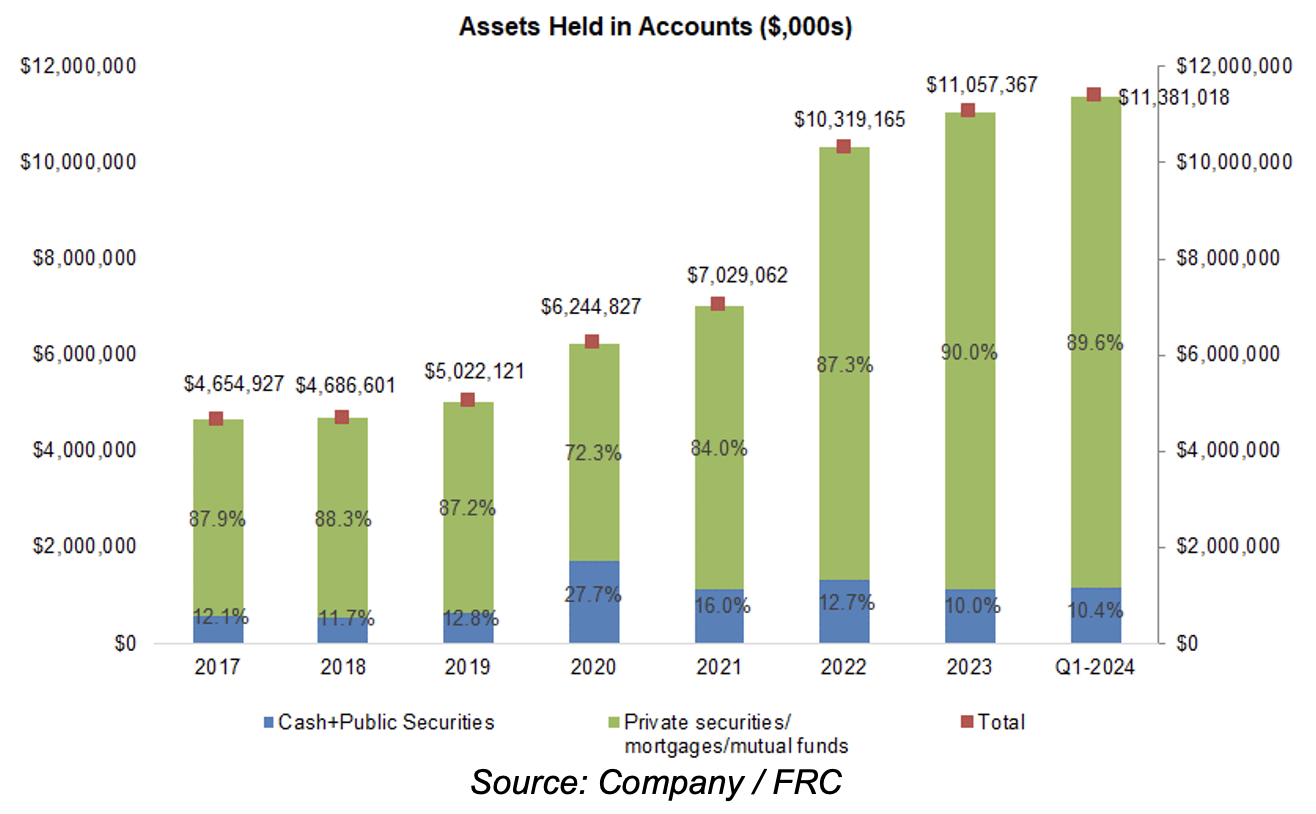
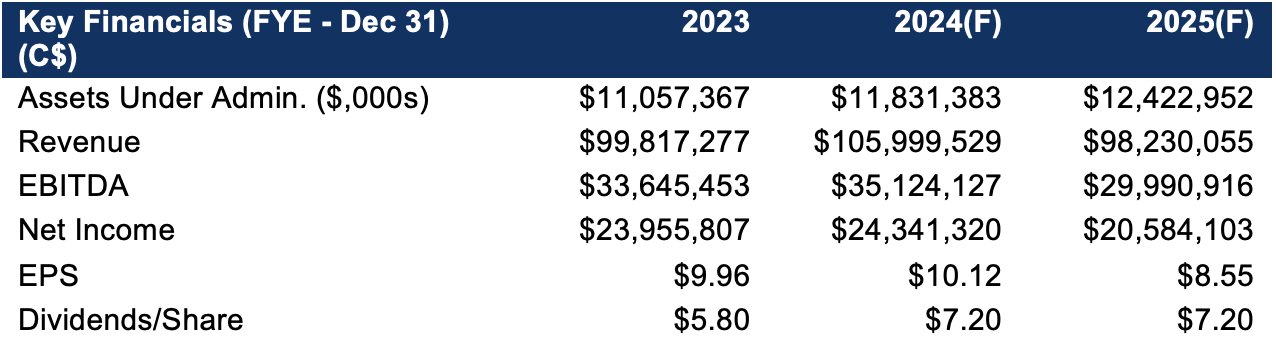
Client assets held by OLY were up 3% QoQ to $11.4B. We are raising our 2024 year-end estimate by 2% to $11.8B
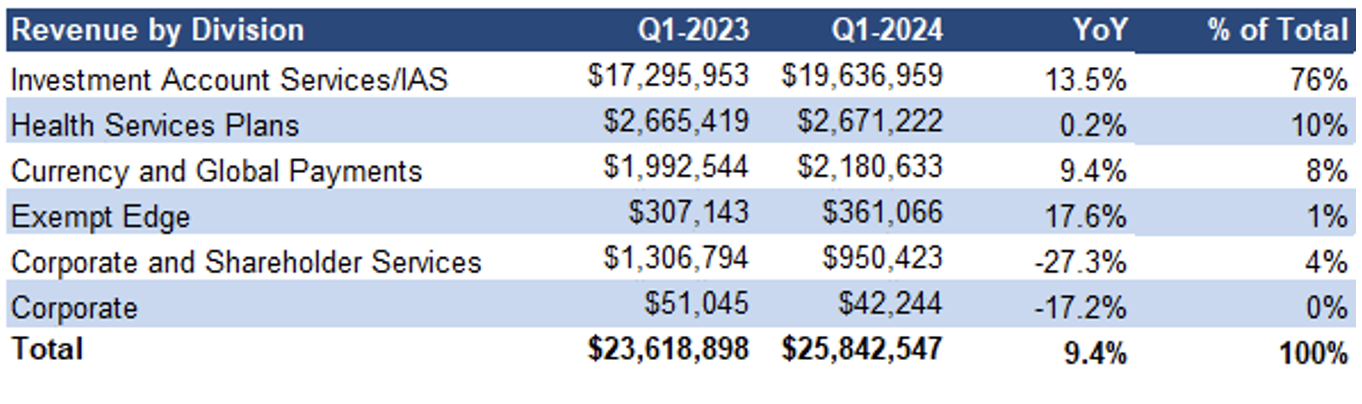
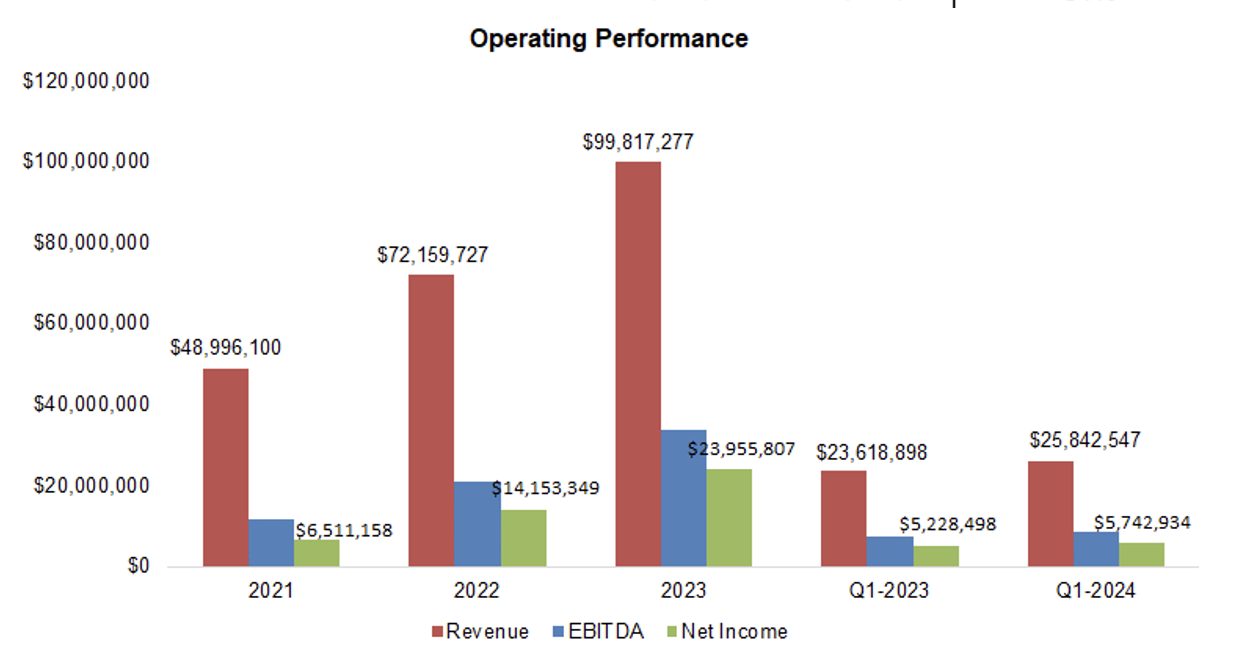
In Q1-2024, revenue was up 9% YoY amid higher interest rates, beating our estimate by 3%
Source: FRC / Company
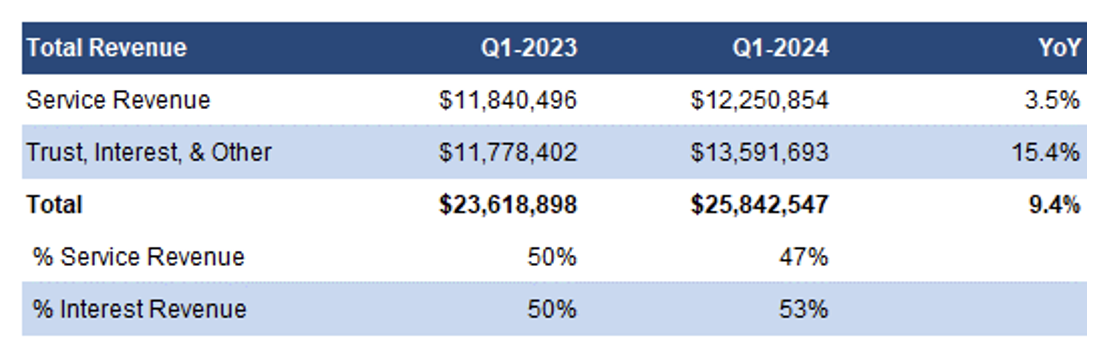
Services revenue was up 4% YoY, but 2% lower than our estimate. Interest revenue was up 15%, beating our estimate by 7%
Source: FRC / Company
*The primary source of revenue in the “Trust, Interest, & Other” category is the interest earned on placing undeployed client capital in cash accounts at major Canadian banks.

Source: FRC / Company
*Service revenue includes annual fees and transaction fees
*Trust, interest, and other’ primarily includes interest revenue
Services revenue from IAS was up 4% YoY, driven by an expanded client-base

Source: FRC / Company
*Service revenue includes annual fees and transaction fees
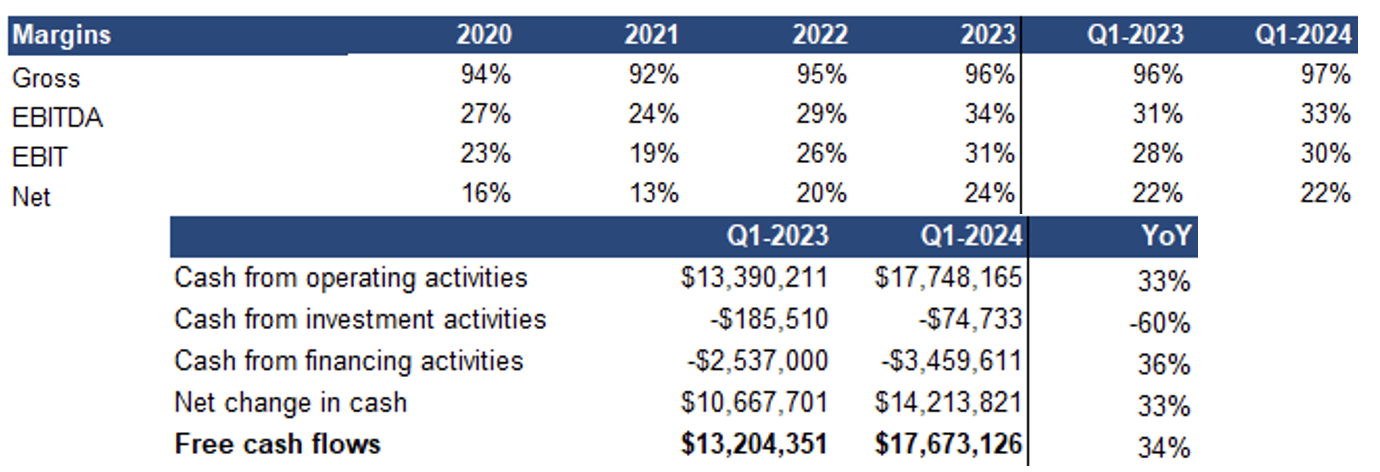
Margins improved across the board due to higher revenue
Source: Company/FRC
Source: Company/FRC
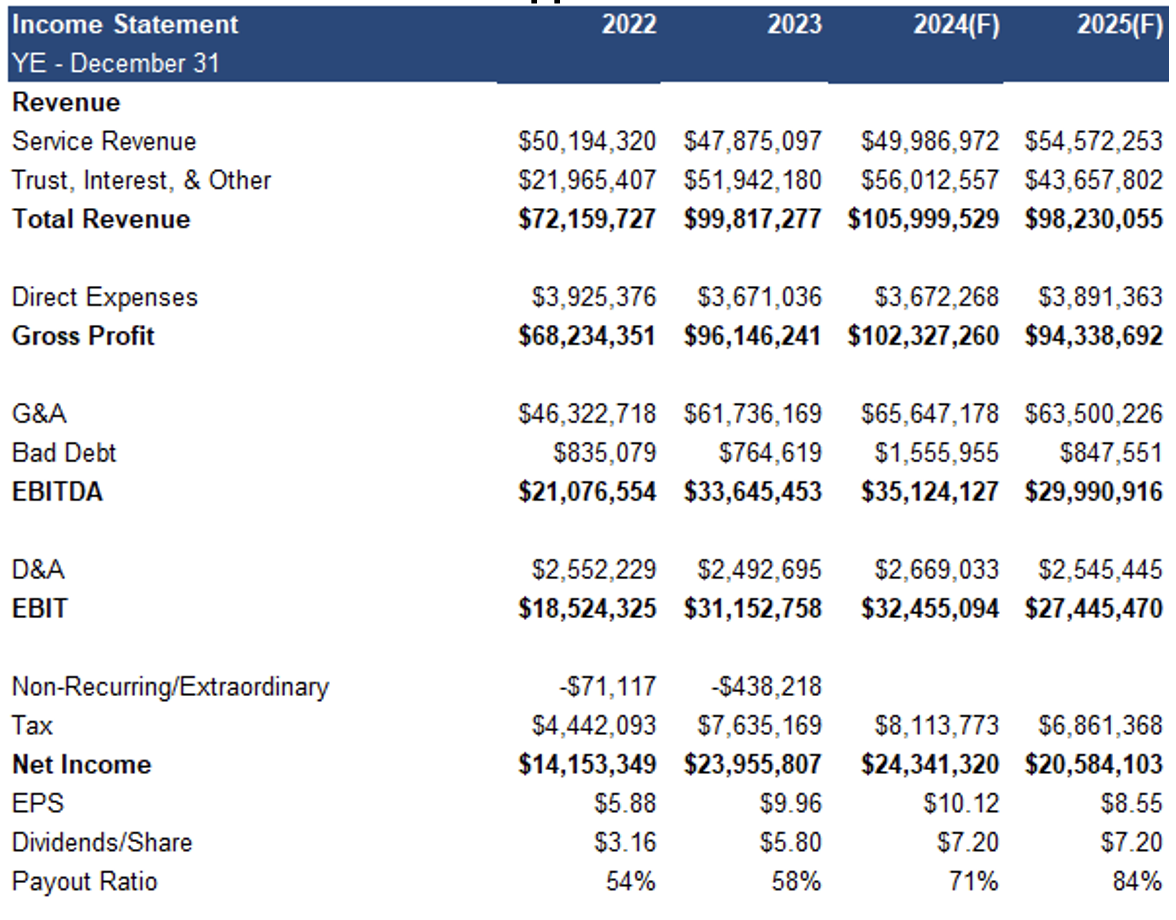
G&A expenses were up 6% YoY, and 5% higher than our estimate. EPS was up 10% YoY, but missed our estimate by 3% due to elevated G&A expenses
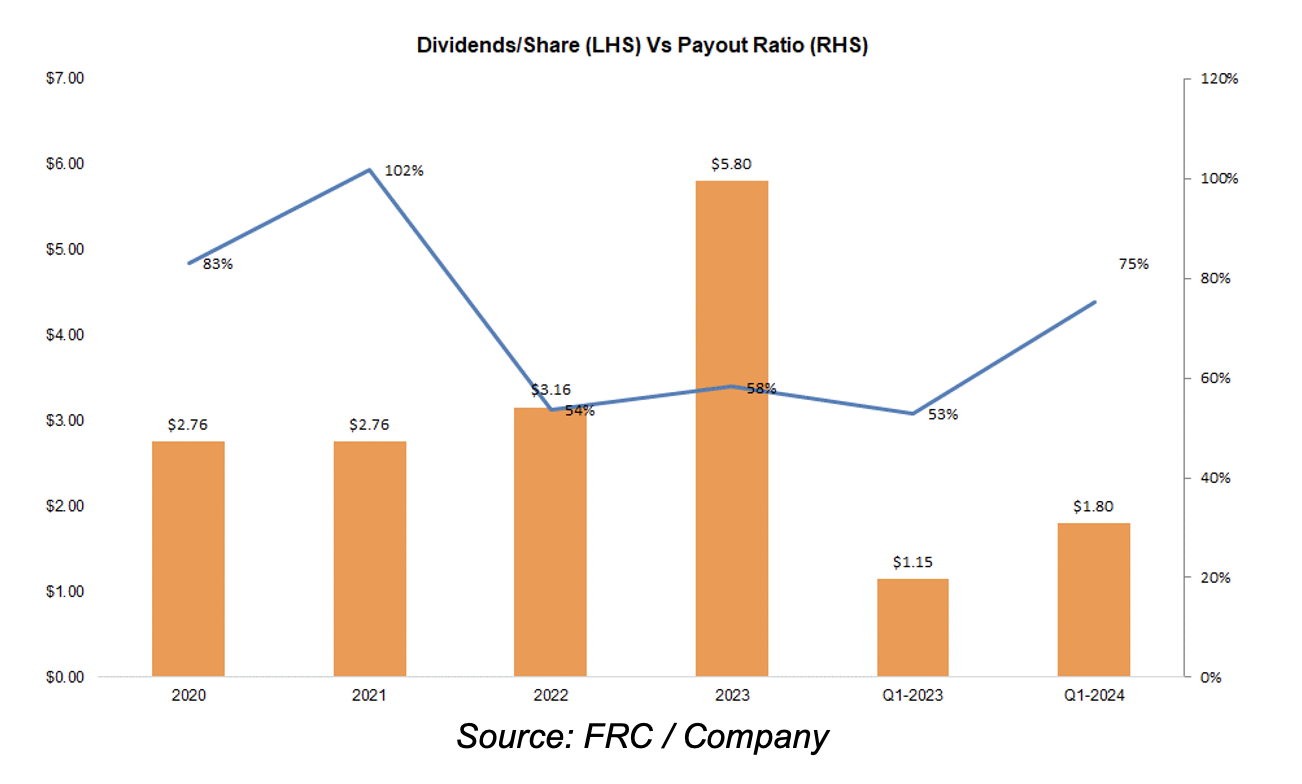
Dividends remained flat QoQ, but increased 57% YoY to $1.80, aligning with our estimate. The payout ratio was 75% vs the historic average of 70%
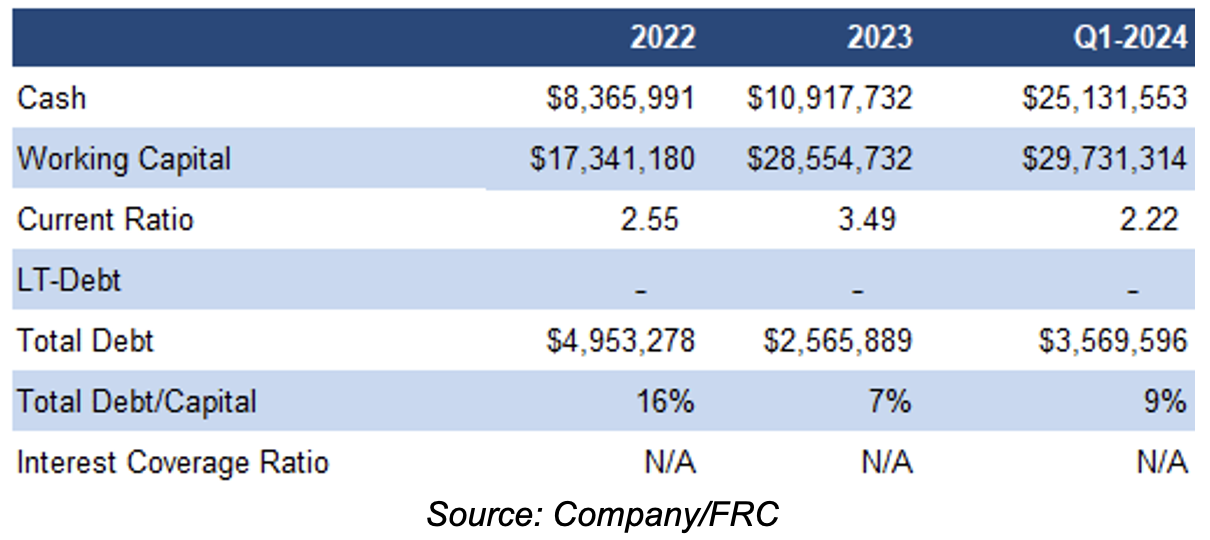
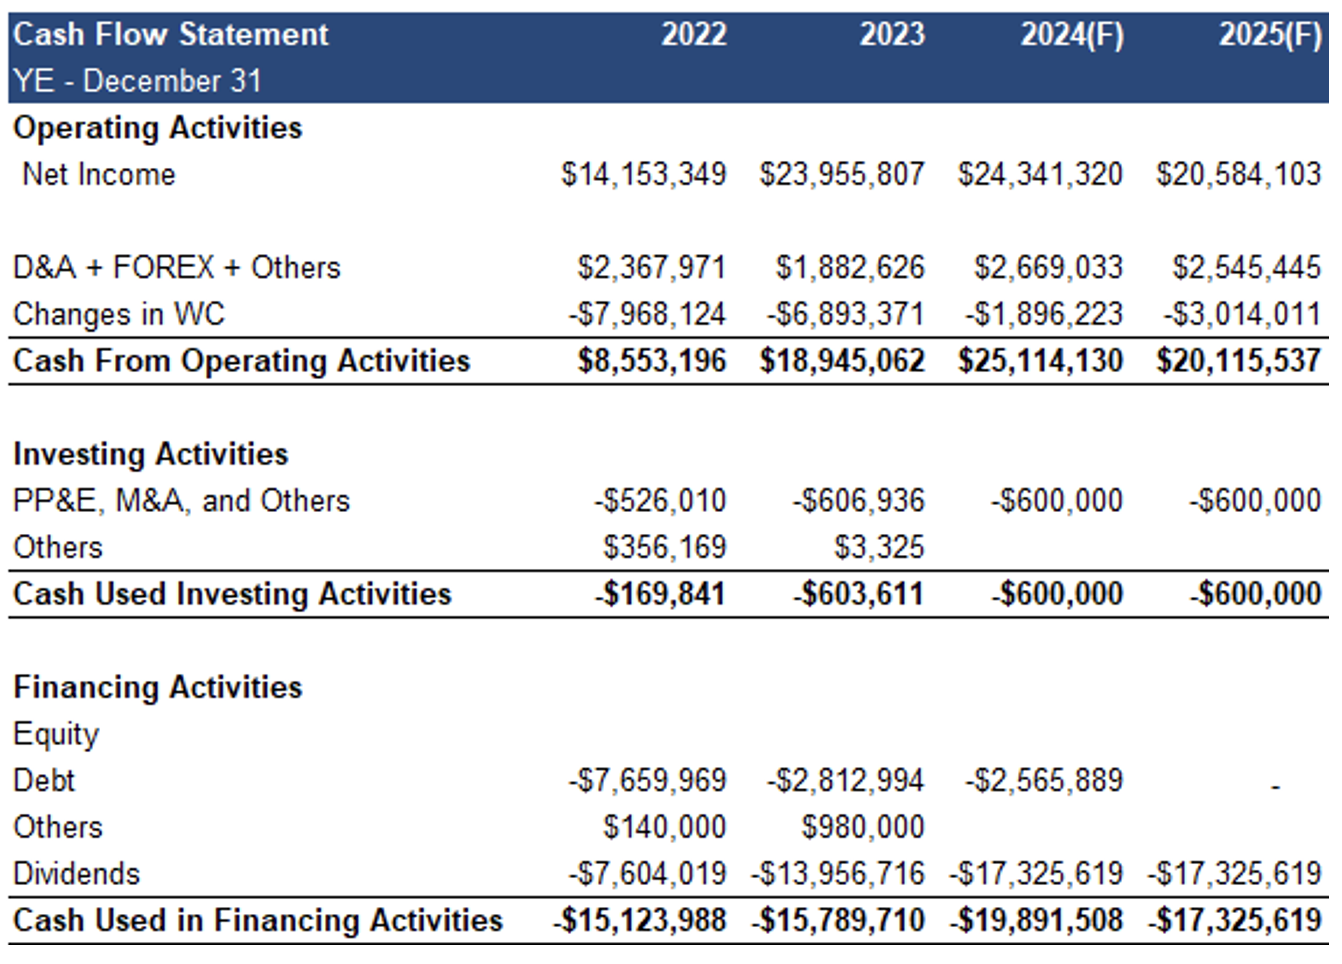
Strong balance sheet
As G&A expenses were higher than expected, we are lowering our 2024 EPS estimate by 3%, while maintaining dividends at $7.20/share
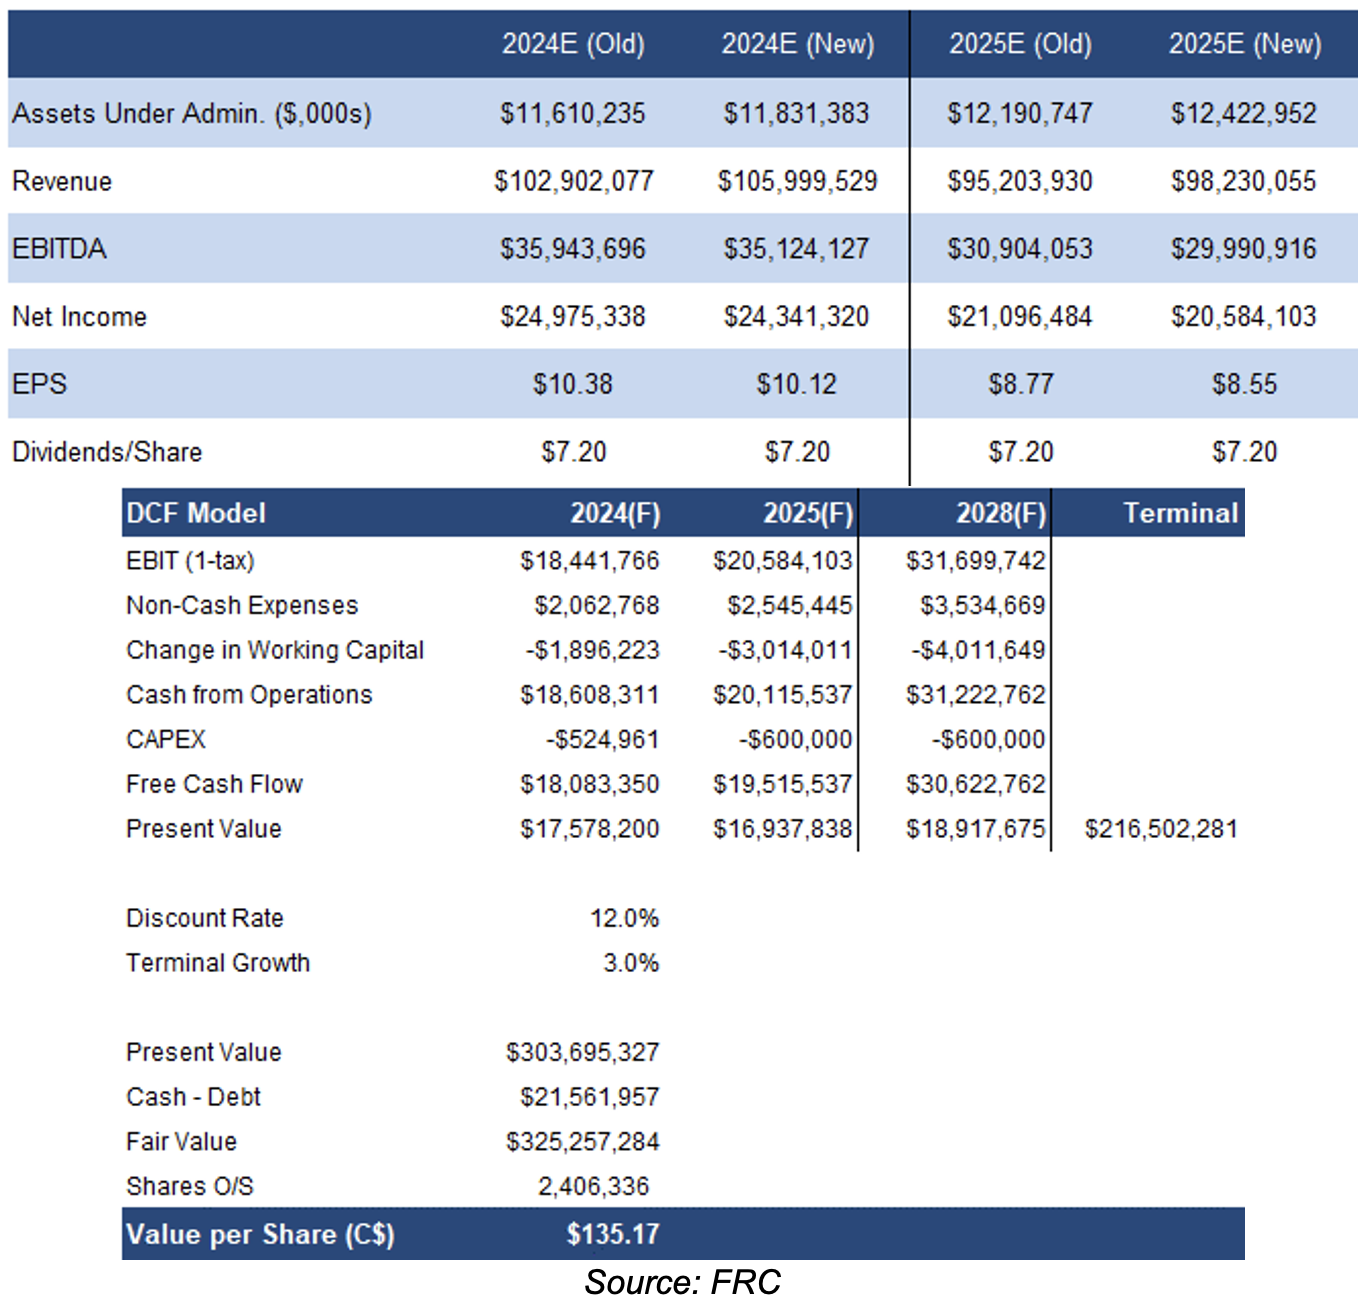
However, we are raising our long-term revenue/EPS estimates to account for potential expansion within ON. As a result, our DCF valuation increased from $115 to $135/share
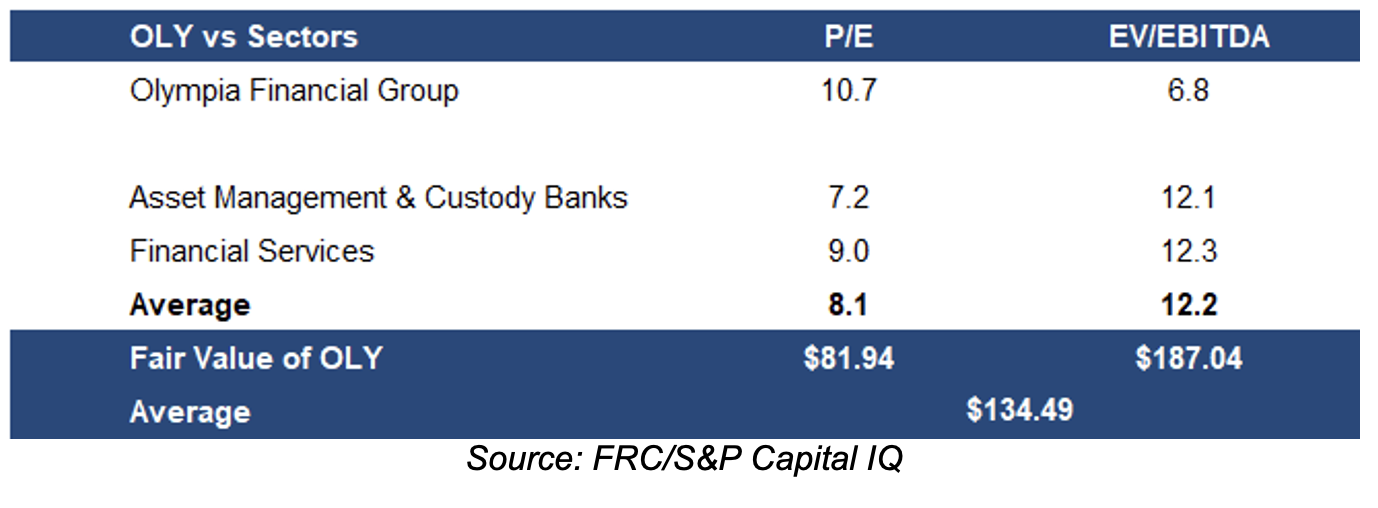
Our comparables valuation declined slightly (from $136 to $134) due to lower 2024 EBITDA/EPS estimates
We are reiterating our BUY rating, and raising our fair value estimate from $125.67 to $134.83/share (the average of our DCF and comparables valuations), implying a potential return of 31% (including dividends) in the next 12 months. We anticipate robust performance in Q2-2024, given the relatively high interest rate environment. The next major catalyst for the stock will likely stem from OLY’s potential registration as a federal trust corporation.
We believe the company is exposed to the following key risks (not exhaustive):
Maintaining our risk rating of 3 (Average)