
Disclosure: Olympia Financial Group Inc. has paid FRC a fee for research coverage and distribution of reports. See last page for other important disclosures, rating, and risk definitions.
The analyst’s rating and fair value are one click away. Free FRC account, no credit card.
Already have an account?
Through organic growth and acquisitions, OLY has captured 90%+ of the market, administering 132k+ accounts, totaling $11B by the end of Q3-2023. The company charges $150 per account in annual administration fees, plus transaction fees ($50-$200), and earns interest from placing unallocated client capital in cash accounts at major Canadian banks.
We believe barriers to entry are high due to OLY's dominant market position, and the need for a sizable client base to achieve profitability.
OLY also provides a wide range of additional services including administering Health Spending Accounts, FOREX services, corporate trust and transfer agency services, including maintenance of security holder registries, annual meeting organization, and dividend reinvestments.
Revenue increased from $42M in 2017, to $72M in 2022, reflecting a CAGR of 12%. In 2023 (9M), revenue increased 46%YoY to $74M. EPS increased from $2.95 in 2017 (full-year), to $7.24 in 2023 (9M). Dividends per share increased from $0.26/month in 2022 (fullyear), to $0.60/month, reflecting a yield of 8.0%. We anticipate robust performance in Q4, maintaining the momentum demonstrated in the first nine months of the year.
Background & Primary Offerings
OLY’s offerings are listed below:
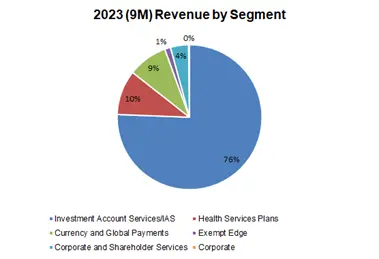
1. Investment Account Services (IAS): OLY is a trustee/custodian/administrator of self-directed registered investment accounts for alternative investments
2. Health Services Plans: Administers Health Spending Accounts for small/mid-sized corporations
3. Currency and Global Payments: Facilitates the buying and selling of currencies for both corporations, and individuals
4. Corporate and Shareholder Services: Offers corporate trust, and transfer agency services, such as maintenance of security holder registries, organizing annual meetings, and administering dividend reinvestments.
5. IT services: Provides IT services to exempt market dealers, issuers, and investment advisors through the brand Exempt Edge
Source: FRC / Company
In 2023 (9M), 76% of revenue came from IAS, 10% from health service plans, and the remaining 14% from other services
The following sections summarize the company’s key business segments.
Investment Account Services (IAS) - OLY administers self-directed registered investment accounts for Canadian investors interested in alternative assets including mortgages, and equity/debt instruments of private issuers. Banks, and other investment platforms, typically concentrate on conventional assets like publicly listed shares, and mutual funds. They do not offer the alternative investments mentioned above mainly because these investments are typically associated with smaller, less liquid niche markets.
Through organic growth and acquisitions, OLY has captured 90%+ of the market. The remaining share is held by traditional financial institutions, allowing their high net-worth clients to invest in alternative assets. We believe that barriers to entry are high in this space because OLY has already established itself as the go-to platform for investors interested in alternative assets. Additionally, an entity needs to attract a large client base before achieving profitability.
IAS offers the following services to investors:
1. Hold investments in trusts, act as custodian of investment certificates/ registrations, and administer investment accounts
2. Process dividends, interests, distributions, and mortgage payments
3. Prepare and issue tax-slips
4. Submit reports to the Canada Revenue Agency (CRA)
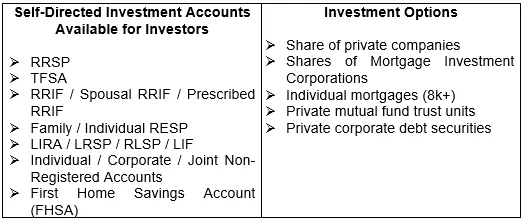
OLY's Platform caters to a comprehensive range of investments not supported by banks, and other traditional trading/investment platforms
 Source: Company / FRC
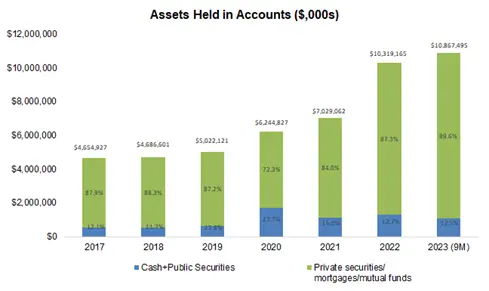
OLY currently manages 132k+ accounts, averaging $82k in assets per account
Client assets held in accounts administered by OLY increased from $5B in 2017, to $11B by the end of Q3-2023
In late 2021, Olympia acquired 34k investment accounts administered by Computershare Trust Company of Canada for $6.4M, or $191/account
OLY generates revenue through the following three streams:
1. Annual fees ($150/account) – Similar to any revenue model featuring paid members/subscribers, this stream offers steady, and recurring revenue, for OLY. For example, OLY can generate $20M in recurring annual revenue from its existing 132k+ accounts.
2. Transaction fees ($50-$200/account): OLY imposes fees ranging from $50 to $200 for various transactions including buying, selling, and withdrawals. This revenue stream exhibits greater volatility, as transaction activity is contingent on market conditions. Positive sentiment toward alternative investments generally leads to increased transactional activity, and higher revenue for OLY.
3. Interest revenue - OLY retains the interest generated from placing undeployed client capital in cash accounts at major Canadian banks. Typically, 10% of client capital remains undeployed at any given time. This revenue stream also exhibits volatility, as it relies on market yields.
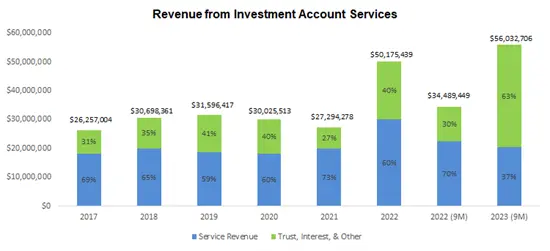
*‘Service revenue’ includes annual fees and transaction fees.
*‘Trust, interest, and other’ primarily includes interest revenue
Source: FRC / Company
Annual revenue ranged between $26M and $32M from 2017 to 2021, but spiked to $50M in 2022, and $56M in 2022 (9M), amid higher interest rates as well as the above mentioned acquisition
We anticipate that revenue growth will be driven by organic growth in demand for alternative investments
Private Health Services Plan (10% of revenue in 2023-9M) - OLY administers Health Spending Accounts (HSA) for small-medium businesses in Canada. An HSA is a tax-efficient employee benefit account, sponsored by an employer to reimburse an employee’s health, and dental expenses. An employer makes predetermined deposits into HSAs, which are accessible to employees. OLY generates revenue through annual fees from clients (ranging between $250 and $700 depending on the level of services rendered), as well as transaction fees based on claim volumes.
In contrast to the IAS business, this sector is fragmented, and characterized by intense competition, featuring numerous small-scale players. Pricing among these players is fairly uniform, and therefore, competition centers on the quality of customer services.
OLY has provided services to 61k+ small-medium businesses since the inception of this division in 1996
190k+ employees have submitted 1.9M+ claims, totalling $1.5B+

Source: Google Rating
Highly rated by users
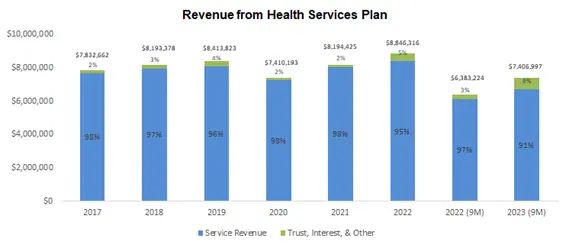
*Service revenue includes annual fees and transaction fees.
Source: FRC / Company
Over the past five years, this division’s annual revenue has remained stable, consistently falling within $8M and $9M
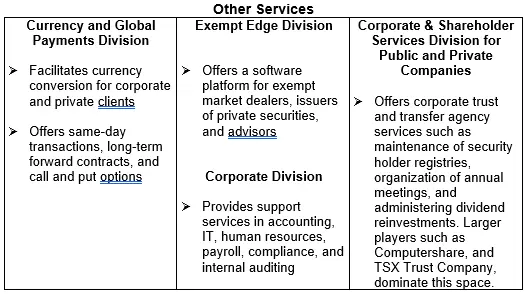
Other services accounted for 14% of OLY’s 2023 (9M) revenue
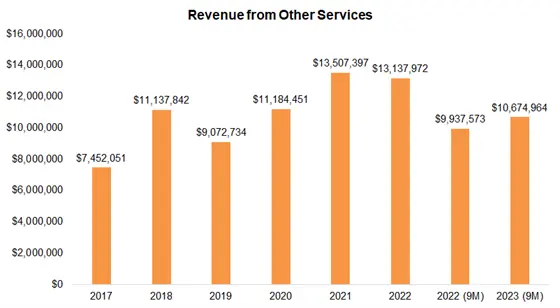
Source: FRC / Company
Annual revenue from these services has ranged between $7M and $14M in the past five years
Market Overview
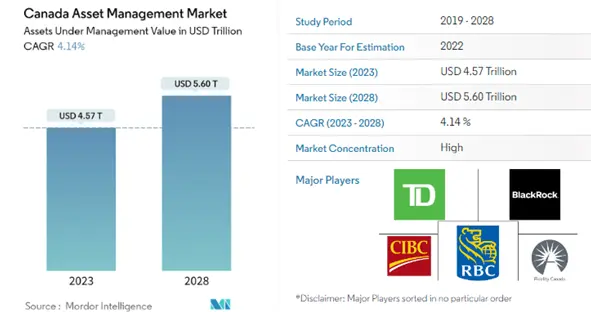
It is estimated that the Canadian asset management market (AUM) will grow from US$4.6T in 2023, to US$5.6T by 2028, reflecting a CAGR of 4%
We estimate that there are approximately 20M accounts for registered plans in Canada across 7M Canadians, with total assets of $1.5T. The Canadian alternative asset management market is approximately US$250B, or 5% of the total asset management market. We believe this is in line with the general recommendation by financial advisors to allocate <10% of assets in alternative investments. According to the Alternative Investment Management Association (AIMA) Canada, Canada lags behind the U.S. in the adoption of alternative investments, attributed to fewer available investment options, and limited access to such opportunities. Therefore, as the sector becomes more evolved with the addition of more players, we anticipate that the Canadian alternative investment market will grow faster than the U.S. market.
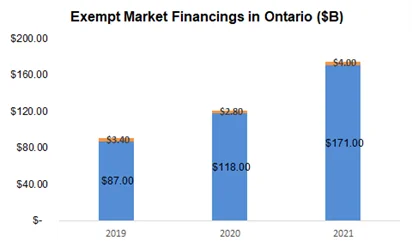
Source: The Ontario Securities Commission / FRC
In 2021, private issuers raised $175B in Ontario (the largest market in Canada) through prospectus exemptions, including $171B from institutions, and $4B from retail investors (OLY’s target market)
Real estate and mortgage-related investments accounted for 43% of financings in 2021 vs 37% in 2019
Management and Board
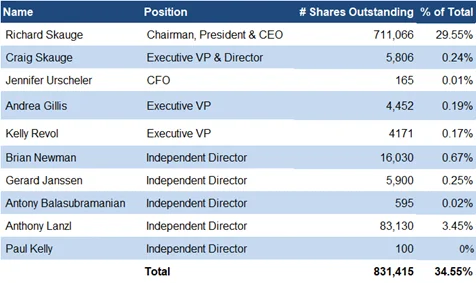
Source: Management Information Circular/FRC
The Chairman / CEO / Founder owns 30% of OLY’s shares, and is the largest shareholder
Richard Skauge – Founder, Chairman, President & CEO
Rick Skauge is a Director, President & Chief Executive Officer, and major shareholder of Olympia Financial Group since 1996. Rick is also involved with several private companies including Apple Creek Golf Course located at Airdrie, Alberta.
Craig Skauge – VP and Director
A 2019 recipient of Canada’s Top 40 Under 40, Craig Skauge is the President, Chief Executive Officer, and a Director of Olympia Trust Company. Craig is a Founder, Former Director & President of the Private Capital Market Association of Canada, and is a former member of the Alberta Securities Commission’s Exempt Market Dealer Advisory Committee. Craig was previously a member of both the Ontario Securities Commission Exempt Market Advisory Committee and Small and Medium Enterprises Committee.
Brian Newman - Independent Director
Mr. Newman is a Chartered Professional Accountant (CPA) and is the President of Brian Newman Professional Corporation, a public accounting firm.
Gerard Janssen - Independent Director
Mr. Janssen is the Vice President, Finance and Chief Financial Officer of Response Energy Corporation, a private oil and gas exploration company. Mr. Janssen is also a Certified Professional Accountant (CPA).
Antony Balasubramanian - Independent Director
Mr. Balasubramanian is a Certified Management Consultant (CMC), a Certified Business Intelligence Professional (CBIP), a Certified Computer Professional (CCP), and is the Vice President, Integration Services of Vistavu Solutions Inc
Anthony Lanzl - Independent Director
Mr. Lanzl is the President of Smile Denture Clinic. Mr. Lanzl was previously a director of the corporation from 2003 to 2011, and from 2015 to 2020.
Paul Kelly - Independent Director
Mr. Kelly recently retired as the CEO of Connect First Credit Union.
Financials (Year-End: Dec 31st)

 Source: FRC / Company
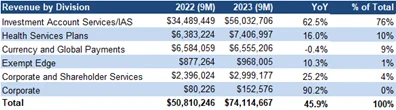
In 2023 (9M), revenue was up 46% YoY, driven by higher interest revenue
IAS accounted for 76% for revenue, health services plans accounted for 10%, and other services accounted for the remaining 14%



In 2023 (9M), services revenue declined as the company lowered its annual administrative fee from $175 to $150 to enhance its value proposition for customers
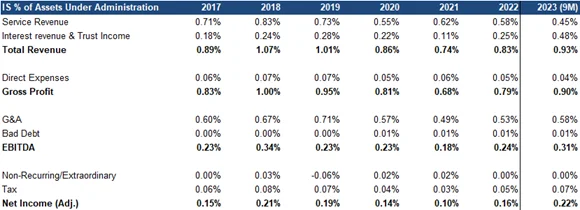
Margins improved across the board due to higher revenue
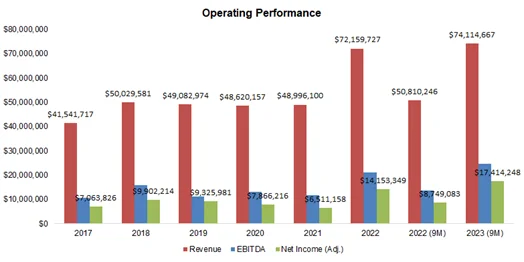
EBITDA, EPS, and FCF reported strong growth as well
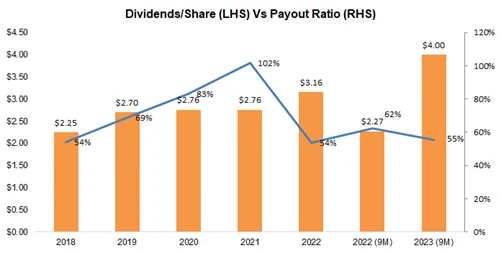
Dividends per share increased from $0.26/month in 2022 (full-year), to $0.60/month currently
The payout ratio was 55% in 2023 (9M) vs the historic average of 77%
Source: Company/FRC
Revenue, and net income, per assets under administration, showed material growth as well (this table shows income statement items as a % of assets under admin; gives us an idea how much OLY can generate in revenue and earnings for every $1 in assets)
Source: Company/FRC
On average, OLY generates 0.94% of assets under administration in revenue, and 0.17% in net profit
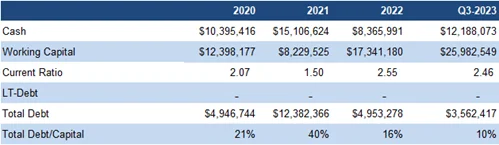
Healthy balance sheet
FRC Projections and Valuation
 Source: FRC
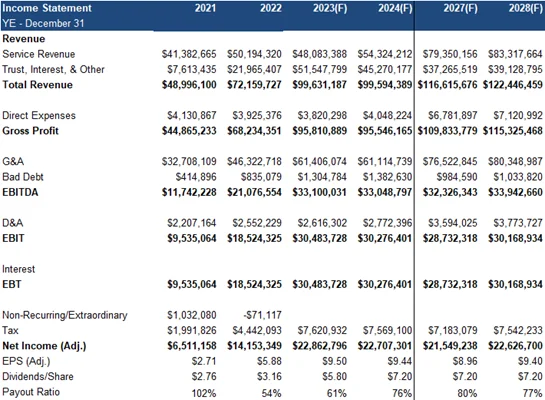
Our models are based on the assumptions that OLY should be able to increase its assets under administration in tandem with the forecasted growth in the Canadian asset management market
We anticipate a decline in interest revenue, as we expect the Bank of Canada to initiate rate cuts within the next six months
DCF Valuation
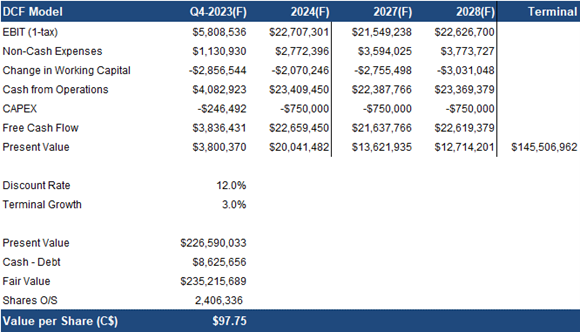
Our DCF valuation is $98/share
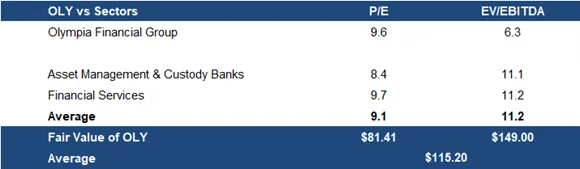
Comparables Valuation
Source: FRC/S&P Capital IQ
As OLY does not have a direct comparable, we are comparing OLY’s P/E, and EV/EBITDA, to financial sector averages we consider appropriate benchmarks
On average, OLY’s multiples are 19% lower than sector multiples
We are assigning a risk rating of 3 (Average)
We are initiating coverage with a BUY rating, and a fair value estimate of $106.48/share (the average of our DCF and comparables valuations), implying a potential return of 26% (including dividends) in the next 12 months. As OLY is the premier trustee/custodian/administrator for investors interested in mortgages, and equity/debt instruments of private issuers, we believe it could emerge as a potential acquisition target for banks, and large investment platforms, should they decide to enter this space in the future. We anticipate a robust performance in Q4, maintaining the momentum demonstrated in the first nine months of the year.
Risks
We believe the company is exposed to the following key risks (not exhaustive):
1. Operates in a regulated industry
2. The company's target market is niche compared to more traditional investment assets
3. Although OLY dominates the alternative investment market, there is no guarantee that banks and large investment platforms will not enter this space in the future.
4. Earnings are significantly affected by fluctuations in interest rates
5. Transaction revenue depends on market sentiment for alternative investments