- Despite Q3 falling short, services revenue from core divisions rose 10% YoY on higher transaction volumes. We anticipate continued growth in services revenue, fueled by rising interest in alternative investments, particularly Mortgage Investment Corporations (MICs), which represent the largest portion of client assets. MICs are high-yield, and generally attractive in a low-rate setting.
- Approximately 50% of revenue came from interest on unallocated client capital held in cash accounts at major Canadian banks/credit unions. Since June 2024, the BoC has cut rates nine times (275 bps) to 2.25%, with the possibility of one more cut amid tepid GDP growth, soft consumer confidence, elevated trade tensions, and high unemployment. Consequently, we expect interest revenue to continue declining in the coming quarters.
- Licensed in all provinces except Ontario, the company’s next catalyst may be federal approval, allowing it to offer services in Ontario as well.
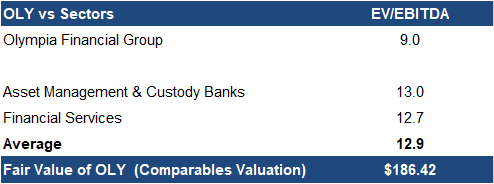
- OLY’s EV/EBITDA is 9.0x vs the sector average of 12.9x, a 30% discount.
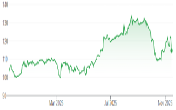
Price and Volume (1-year)


* Olympia Financial Group has paid FRC a fee for research coverage and distribution of reports. See last page for other important disclosures, rating, and risk definitions. All figures in C$ unless otherwise specified.
Primary Services
- Investment Account Services (IAS): OLY is a trustee/custodian/administrator of self-directed registered investment accounts for alternative investments
- Health Services Plans: Administers health spending accounts for small/mid-sized corporations
- Currency and Global Payments: Facilitates the buying and selling of currencies for corporations and individuals
- Corporate and Shareholder Services: Offers corporate trust, and transfer agency services, such as maintenance of security holder registries, organizing annual meetings, and administering dividend reinvestments
- Raisr (Exempt Edge): Provides IT services to exempt market dealers, issuers, and investment advisors
The leading Canadian custodian/ administrator of alternative investments
OLY’s platform supports a broad range of investments typically not offered by banks or traditional trading platforms
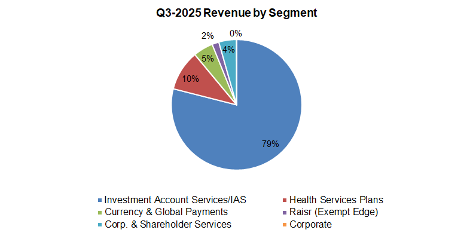
In Q3-2025, revenue mix remained stable: 79% from IAS, 10% from health service plans, and 11% from other services, consistent with last year
Source: Company / FRC
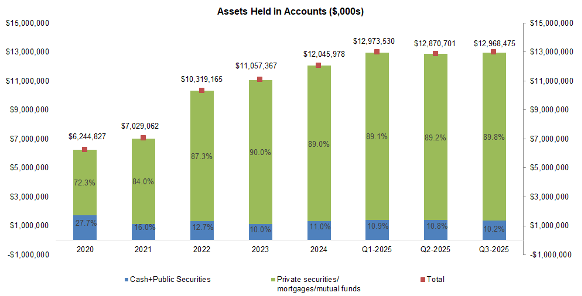
Client assets rose 1% QoQ to $12.97B in Q3
Given growth in recent quarters, we had expected stronger growth
We are lowering our year-end estimate by 3% to $13.16B
Financials (Year-End: Dec 31st)
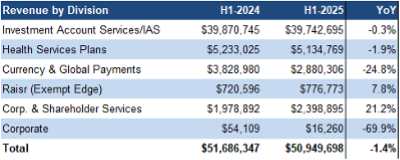
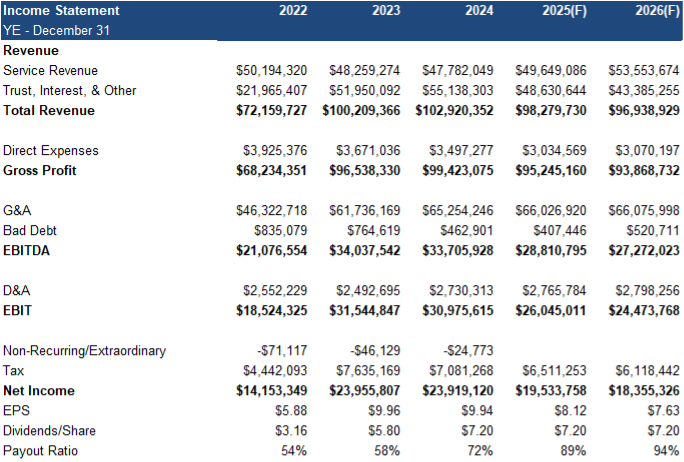
Q3 revenue was down 6% YoY, missing our forecast by 3% due to lower interest on unallocated client capital


Importantly, services revenue from core divisions (IAS and Health Service Plans) was up 10% YoY, driven by higher transaction volumes

*The primary source of revenue in the “Trust, Interest, & Other” category is the interest earned on placing undeployed client capital in cash accounts at major Canadian banks.
*Service revenue includes annual and transaction fees
*‘Trust, interest, and other’ primarily includes interest revenue

G&A expenses rose 2% YoY, coming in 1% above our forecast

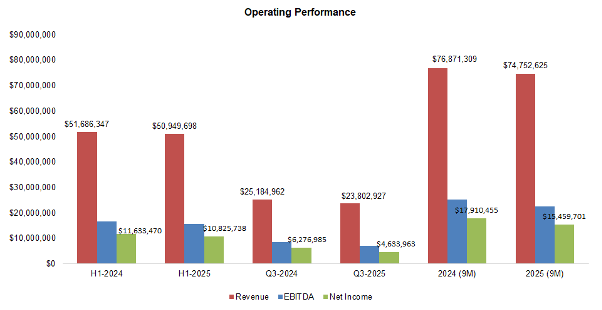
EPS declined 26% YoY vs. (7%) in H1, missing our forecast by 11%, primarily due to weaker revenue
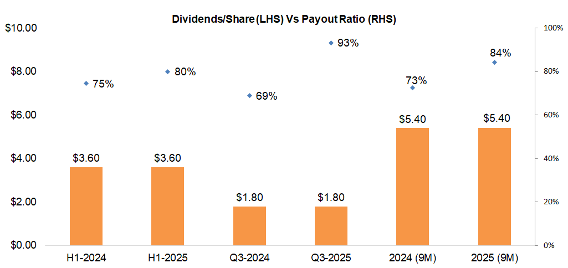
Dividends held steady at $1.80/quarter, aligning with our estimate
The payout ratio was 84% in 2025 (9M) vs the historic average of 70%

Source: FRC / Company
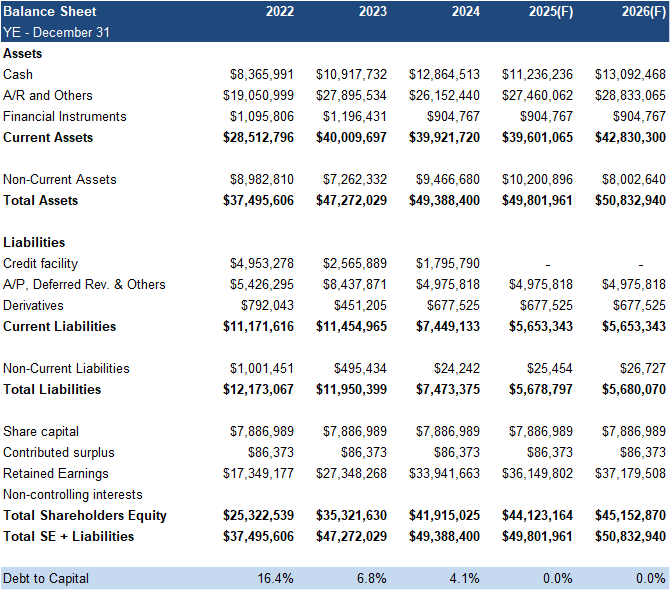
Strong balance sheet
FRC Projections and Valuation
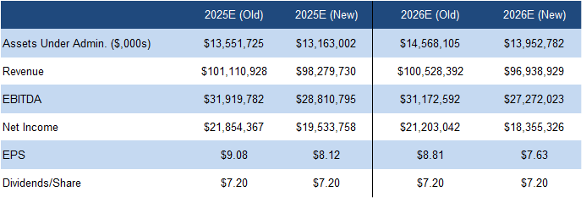
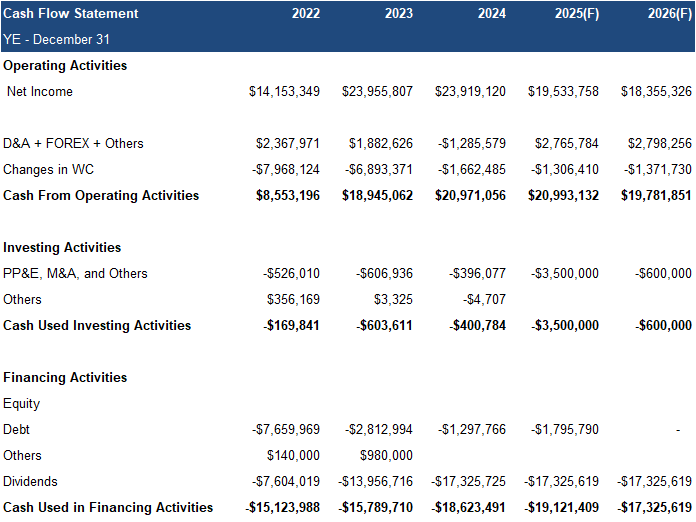
Given Q3 revenue was lower than expected, we are lowering our full-year revenue and EPS forecasts
Source: FRC
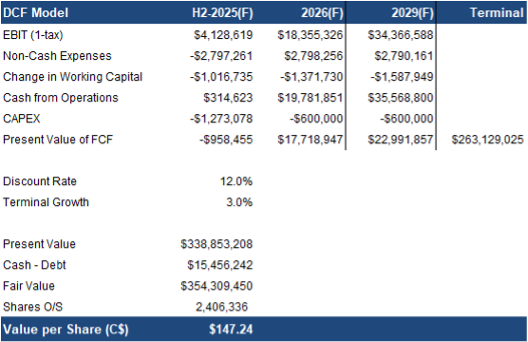
As a result, our DCF valuation declined from $153/share to $147/share
Source: FRC / S&P Capital IQ
With sector multiples down 6% since our August 2025 report, our comparables valuation fell from $202 to $186/share
We are reiterating our BUY rating, and adjusting our fair value estimate from $177.66 to $166.83/share (the average of our DCF and comparables valuations), implying a potential return of 53% (including dividends) in the next 12 months. Q3 revenue and EPS fell short of expectations, primarily due to declining interest on unallocated client capital. However, services revenue rose 10% YoY, supported by strong demand for alternative investments. Looking ahead, we expect interest revenue to continue declining, while services growth and potential expansion into Ontario offer upside potential.
Risks
We believe the company is exposed to the following key risks (not exhaustive):
• Operates in a regulated industry
• The company's target market is niche
• Although OLY dominates the alternative investment market, there is no guarantee that banks and large investment platforms will not enter this space in the future.
• Earnings are significantly affected by fluctuations in interest rates
• Transaction revenue depends on market sentiment for alternative investments
Maintaining our risk rating of 3 (Average)
APPENDIX
