FRC Logo
Top Picks

Connect With Us

Stay updated with our latest research and insights

Fundamental Research Corp Logo

Highly ranked equity research firm providing institutional grade tools and analysis to all investors worldwide. Trusted by global investors for over 20+ years.

20+ Years

Policies

  • Privacy Policy
  • Terms of Service
  • Disclaimer

Company

  • About Us
  • Our Team
  • Contact Us

Resources

  • Videos
  • Research Reports

© 2025 Fundamental Research Corp. All Rights Reserved.

Professional investment research since 2003

    Home
    Content
    Screener
    Top Picks
    Home🔹Latest Reports🔹Enterprise Group, Inc.🔹Solid Q3 Revenue Growth; Share Price Lagging Without Justification
    Enterprise Group, Inc.

    Solid Q3 Revenue Growth; Share Price Lagging Without Justification

    ByFRC AnalystsNovember 14, 2025
    Solid Q3 Revenue Growth; Share Price Lagging Without Justification

    Disclosure: Enterprise Group, Inc. has paid FRC a fee for research coverage and distribution of reports. See last page for other important disclosures, rating, and risk definitions.

    Company Details

    Sector
    Energy
    Industry
    Oil & Gas Equipment & Services

    Trading Information

    Live Price
    Loading...
    Ticker & Exchange
    E.TO
    :TSX
    ETOLF:NASDAQ

    Rating and Key Data

    •••
    MetricsValue
    Current PriceCAD $1.26
    Fair ValueCAD $2.38
    Risk3
    52 Week RangeCAD $1.08 - 2.69
    Shares O/S (M)77
    Market Cap. (M)CAD $98
    Current Yield (%)N/A
    P/E (forward)19.5
    P/B1.1

    Want to see the full analysis?

    Subscribe for free to get exclusive insights and fair value data.

    Already a subscriber?

    Report Highlights

    • Q3 Performance: Revenue rose 35% YoY vs. (16%) in H1, in line with our estimate. EPS turned positive but came in 10% below expectations, reflecting lower gross margins. Q2 and Q3 are typically seasonally weak, while Q4 and Q1 are usually the strongest.
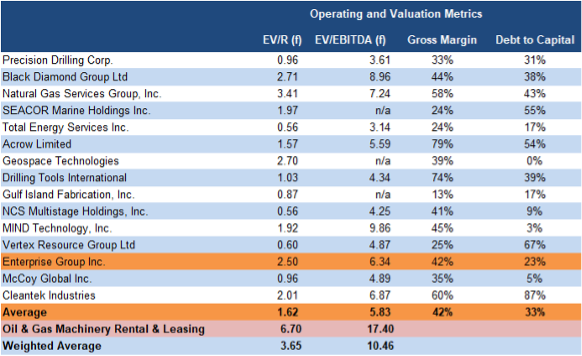
    • Balance Sheet & Valuation: E’s balance sheet remains strong, with a debt-to-capital ratio of 28% vs. the sector average of 33%. Despite robust revenue growth, sector-comparable margins, lower leverage, and attractive EV/Revenue and EV/EBITDA multiples, E’s share price has lagged peers for no justifiable reason, highlighting upside potential.
    • Oil & Gas CAPEX: North American sector CAPEX is down ~4% this year due to lower oil prices, and elevated economic and geopolitical risks. With consensus forecasts projecting an oil price recovery in 2026, lower interest rates, and modest GDP growth, CAPEX is projected to rise 5–7% in 2026, which should meaningfully benefit E.
    • Valuation: E’s forward EV/Revenue and EV/EBITDA are 35% below sector averages, highlighting potential relative value.

    Price and Volume (1-year)

    * Enterprise Group has paid FRC a fee for research coverage and distribution of reports. See last page for other important disclosures, rating, and risk definitions. All figures in C$ unless otherwise specified.

    Enterprise vs Larger Players 
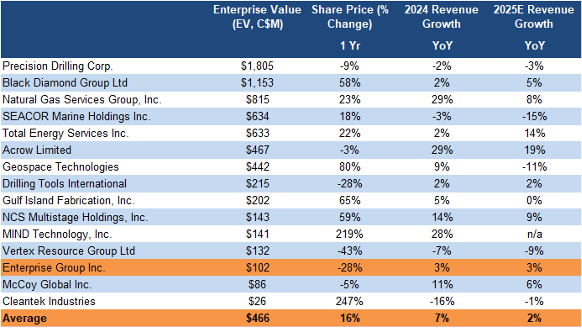
    We forecast E’s 2025 revenue growth to match the sector average and note its comparable margins, lower debt, and favorable EV/Revenue and EV/EBITDA multiples
    Source: FRC / S&P Capital IQ

    Despite this, the stock has lagged peers (-28% YoY vs. +16% YoY) without clear justification, highlighting potential upside

    Financials

    Q3 revenue rose 35% YoY vs. (16%) in H1, in line with our estimate

    Gross margins expanded 5 pp YoY to 42%, though still below our 45% forecast

    *Sector: Oil & Gas Machinery Rental and Leasing

     G&A expenses were flat YoY (H1: +20%) and 9% below our estimate 

    Following the Q2 FlexEnergy acquisition, forecasting EPS remains somewhat challenging without more clarity on stabilized G&A expenses, and gross margins

    EPS turned positive but came in 10% below our estimate, driven by lower gross margins

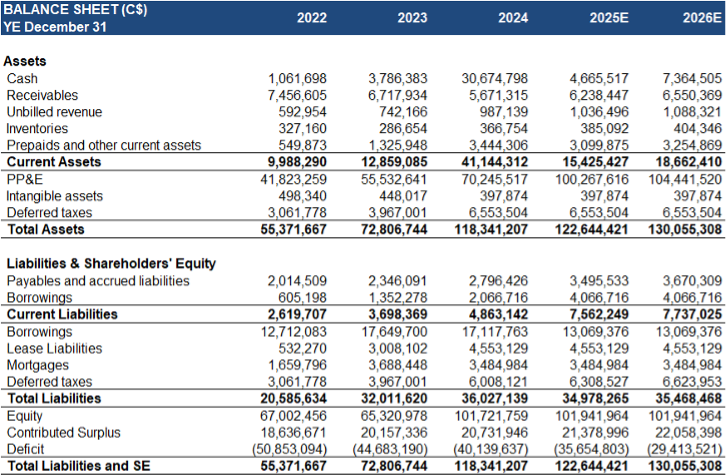
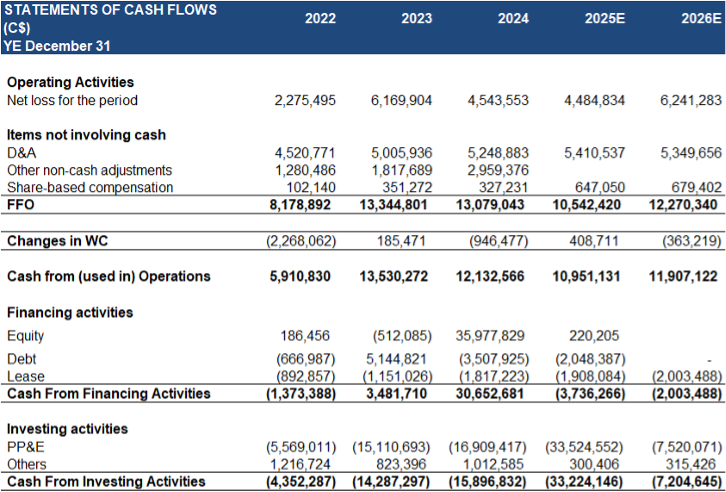
    CAPEX surged 141% to $32M, driven primarily by the FlexEnergy acquisition in Q2

    Source: FRC / Company

    Debt/capital increased QoQ (from 23% to 29%) but remained below the sector average of 33%

    Can raise up to $10M from in-the-money options and warrants 

    Oil & Gas Price Outlook 
    Source: FRC/Sproule/GLJ

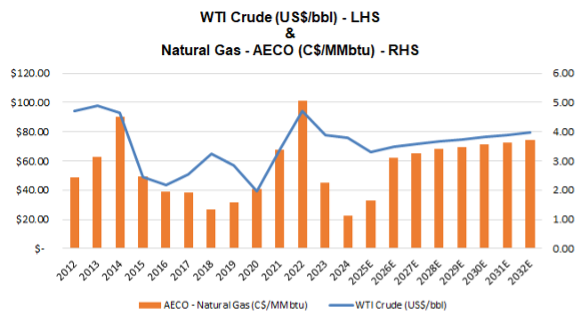
    Consensus oil price forecasts (near and long-term) are well above historic averages of US$70/bbl oil and $2.6/mmbtu gas), implying a positive outlook for the oilfield services sector 
    Source: FRC/Various

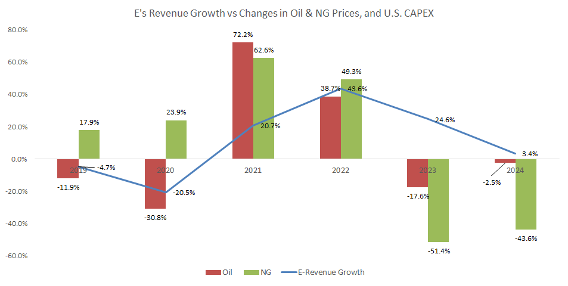
    E's revenue generally tracks changes in oil and gas prices, and sector CAPEX spending

    Historically, a 1.0% change in oil and gas prices has led to a 1.9% change in E's revenue

    FRC Projections and Valuation 
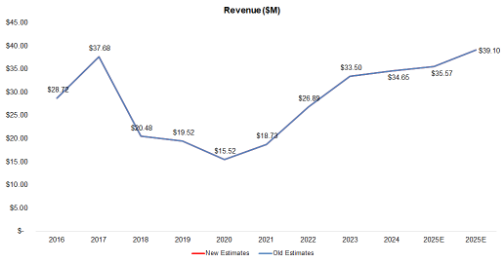
    With Q3 gross margins below expectations, we are lowering our EPS forecasts

    Source: FRC

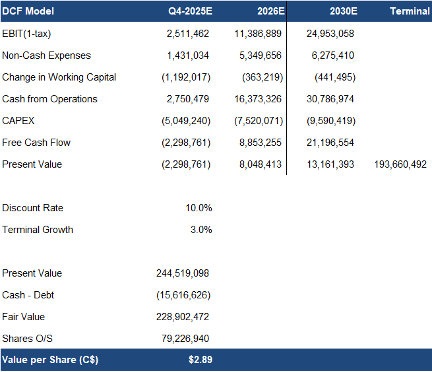
    As a result, our DCF valuation fell from $3.04 to $2.89/share
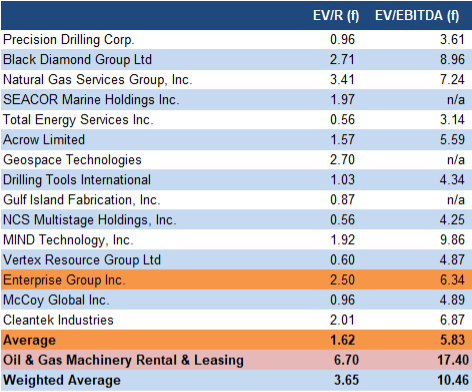
    Source: FRC / S&P Capital IQ 

    Sector multiples are up 11% since our previous report in August

    Our fair value decreased from $2.42 to $2.38/share, driven by lower EBITDA and EPS forecasts, partially offset by higher sector multiples

    We are reiterating our BUY rating, and adjusting our fair value estimate from $2.42 to $2.38/share (the average of our DCF and comparables valuations). E delivered strong Q3 revenue growth, up 35% YoY, though EPS came in 10% below expectations due to lower gross margins. The company’s balance sheet is solid, with debt below the sector average, yet its share price has lagged peers for no justifiable reason. With North American oil and gas CAPEX projected to rise 5–7% in 2026, we believe E is well-positioned to benefit.

    Risks

    We believe the company is exposed to the following key risks (not exhaustive):

    • The oil/gas field services market is highly dependent on oil and gas prices
    • Operates in a competitive space
    • Revenue and growth are tied to sector CAPEX levels
    • Exposed to geopolitical risks and regulatory changes
    • Balance sheet strength is critical for weathering industry downturns

    Maintaining our risk rating of 3 (Average)

    APPENDIX

    Rating and Key Data

    •••
    MetricsValue
    Current PriceCAD $1.26
    Fair ValueCAD $2.38
    Risk3
    52 Week RangeCAD $1.08 - 2.69
    Shares O/S (M)77
    Market Cap. (M)CAD $98
    Current Yield (%)N/A
    P/E (forward)19.5
    P/B1.1

    Want to see the full analysis?

    Subscribe for free to get exclusive insights and fair value data.

    Already a subscriber?

    Related Content

    Analysts' Ideas of the Week

    Big Moves in Critical Minerals & Canadian Student Housing

    November 10, 2025
    Thumbnail for Big Moves in Critical Minerals & Canadian Student Housing
    Analysts' Ideas of the Week

    Top Picks, Key Financing, Promising Exploration Results

    November 4, 2025
    Thumbnail for Top Picks, Key Financing, Promising Exploration Results
    Analysts' Ideas of the Week

    Rocket Doctor AI Insights | Magnesium Project Gets Permit | Resource Stocks Retreat

    October 28, 2025
    Thumbnail for Rocket Doctor AI Insights | Magnesium Project Gets Permit | Resource Stocks Retreat
    Analysts' Ideas of the Week

    Denarius Receives Permit; Gold, Potash, Uranium, and Copper Updates

    October 20, 2025
    Thumbnail for Denarius Receives Permit; Gold, Potash, Uranium, and Copper Updates