Updates from Financials, Technology, Energy, and Special Situations Companies Under Coverage
Pixie Dust Technologies / NASDAQ : PXDT
PR Title: Announces preliminary revenue estimate for FY2024
Analyst Opinion: Positive – Preliminary estimates by management indicate FY2024 (ended April 2024) revenue to be around 1.0 - 1.2B yen (US$6.4 - $7.7M) vs our forecast of 0.9B. Additionally, Pixie has secured 1B Yen in debt financings to fund working capital. We will publish an update when the financial statements are published. Pixie has six commercialized products (all launched in the past one/two years), and several others in R&D stages. One of its flagship products promotes hair growth, and mitigates hair loss.
Voyageur Pharmaceuticals Ltd./ TSXV: VM
PR Title: Secures US$1.9M sales contract for its SmoothX 2% barium contrast
Analyst Opinion: Positive – A distributor specializing in radiology product sales in Latin America has committed to purchasing US$1.9M worth of VM’s contrast agents over the next three years. The distributor will bear the costs and responsibility for product regulatory approvals, and commercialization. While actual product sales are subject to receiving approvals, we view this as a significant milestone for VM, marking its first substantial sales order. VM’s contrast agents are administered to patients before undergoing imaging technologies such as X-ray, MRI, and CT scans.
Hemostemix Inc./ TSXV: HEM
PR Title: Announces strategic manufacturing partnership with CytoImmune Therapeutics, and $1.80M in financing commitments
Analyst Opinion: Positive – Cytolmmune is a privately held company providing clinical manufacturing services to biotech firms. HEM has signed a LOI with Cytolmmune to jointly manufacture its flagship product (ACP-01), targeting patients in critical need on a compassionate basis. This initiative aims to provide investigational products for life-threatening conditions where alternative treatment options are unavailable. Additionally, Cytolmmune has agreed to invest $1.37 million in HEM. HEM's initial target markets are patients with critical limb ischemia (CLI), and ischemic heart disease.
Resuming Coverage on a Former Top Pick
Lake Resources N.L. (ASX: LKE / OTC: LLKKF)
We are resuming coverage on Lake Resources, a former top pick. LKE is down 89% YoY, significantly more than other junior lithium stocks, which are down 60%-70%. We believe lithium prices have bottomed, signaling a favorable opportunity to revisit lithium stocks. We believe LKE stands out as one of the most undervalued lithium stocks based on EV/NPV and EV/Resource ratios.
Lithium prices are down 37% YoY to US$15.4k/t vs the five-year average of US$21k/t. Despite anticipated subdued near-term demand growth resulting from slower global GDP and EV sales growth, we remain optimistic about long-term prices. We also maintain a positive outlook on juniors focused on EV metals. Battery/EV manufacturers/miners are actively seeking stable/long-term supply sources.
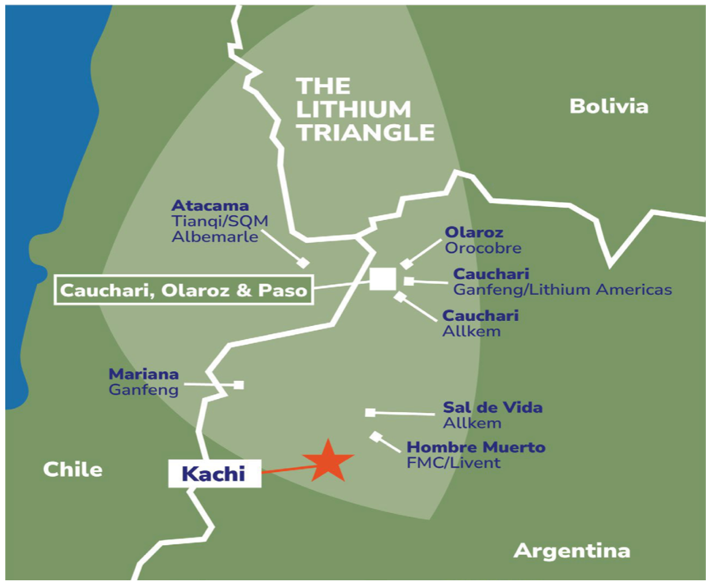
Lake’s Kachi Lithium Brine Project is located 100 km southwest of Arcadium Lithium’s (NYSE: LTM) Hombre Muerto lithium brine operation, and southeast of Ganfeng Lithium’s (SZSE: 002460) Mariana lithium project, slated for production later this year.
Project Location
Source: Company
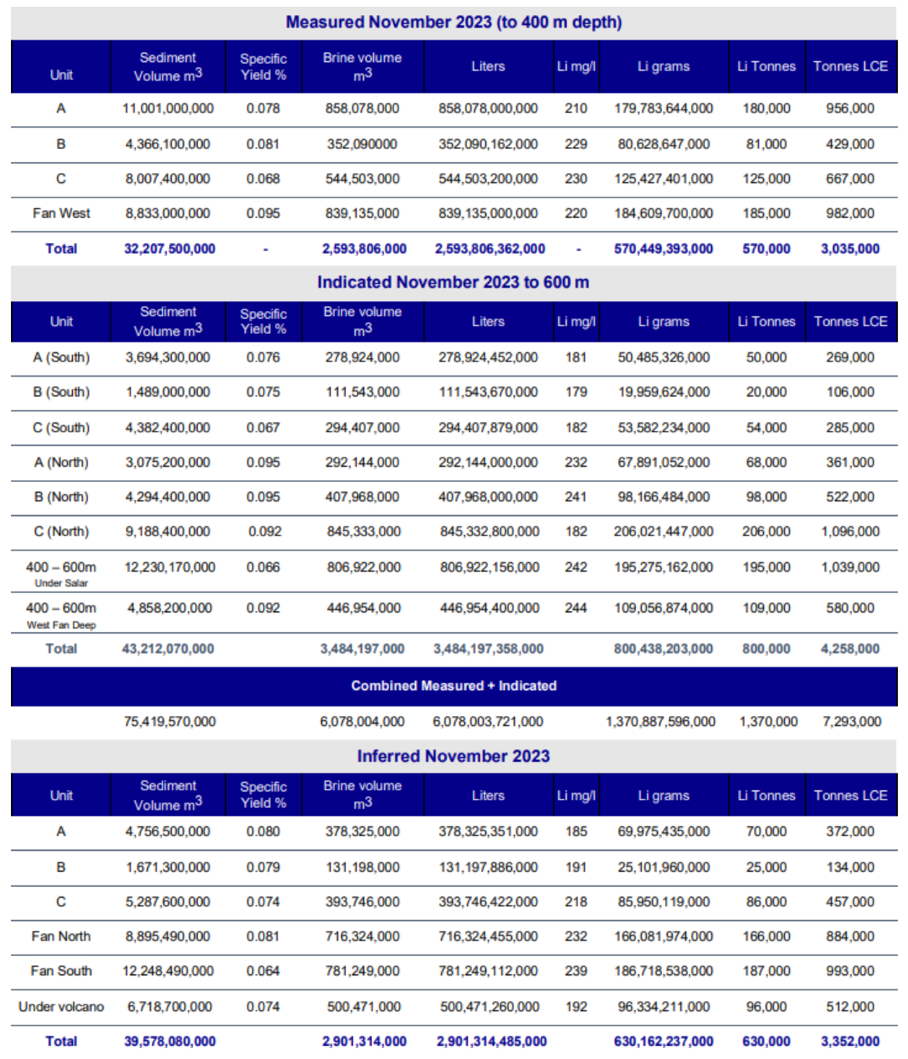
Kachi hosts a large lithium brine resource (10.6 Mt LCE).
2023 Resource Estimate (Inclusive of Reserves)
Source: Company
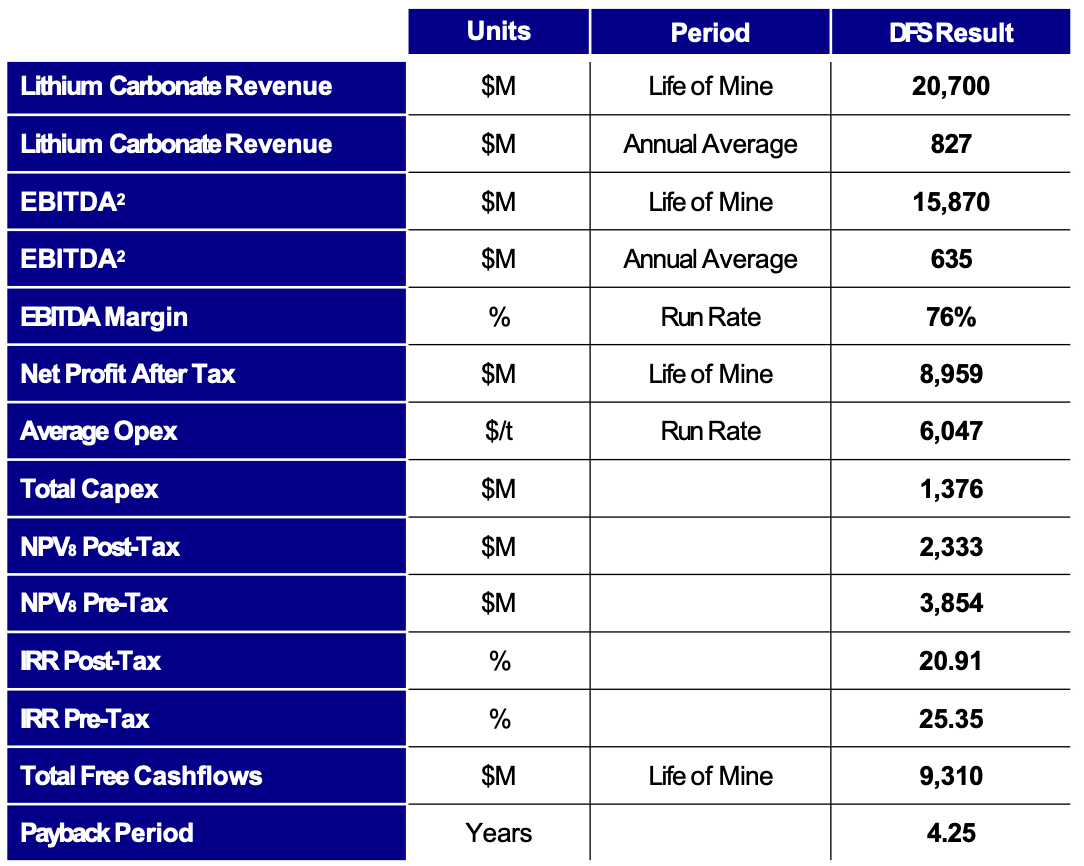
In December 2023, LKE completed a phase one Definite Feasibility Study (DFS) centered on a 25,000 tonne per annum operation, projecting a 25-year mine life, utilizing only 12% of its M&I resources. The study returned an AT-NPV8% of US$1.7B using US$28k/t LCE, and US$0.7B using US$21k/t LCE vs the current spot price of US$15.4k/t, and the five-year average of US$21k/t. LKE is trading at just 3% of the AT-NPV. Kachi is slated for production in 2027. In our upcoming report, we will present a comprehensive valuation, including its sensitivity to long-term lithium prices
2023 DFS Highlights
 Source: Company
FRC Top Picks
The following table shows last month’s top five performers among our Top Picks, including five junior resource companies. The top performer, World Copper (TSXV: WCU), was up 196%. WCU is advancing multiple copper projects in the Americas.
| Top Five Monthly Performers |
MoM Returns |
| World Copper Ltd. (WCU.V) |
195.7% |
| Fortune Minerals Limited (FT.TO) |
140.0% |
| Southern Silver Exploration Corp. (SSV.V) |
55.0% |
| Starcore International Mines Ltd. (SAM.TO) |
45.5% |
| South Star Battery Metals Corp. (STS.V) |
25.0% |
| * Past performance is not indicative of future performance (as of May 27, 2024) |
|
Source: FRC
Last month, companies on our Top Picks list were up 12.7% on average vs 2.8% for the benchmark (TSXV). Our top picks have outperformed the benchmark in all of the six time periods listed below.
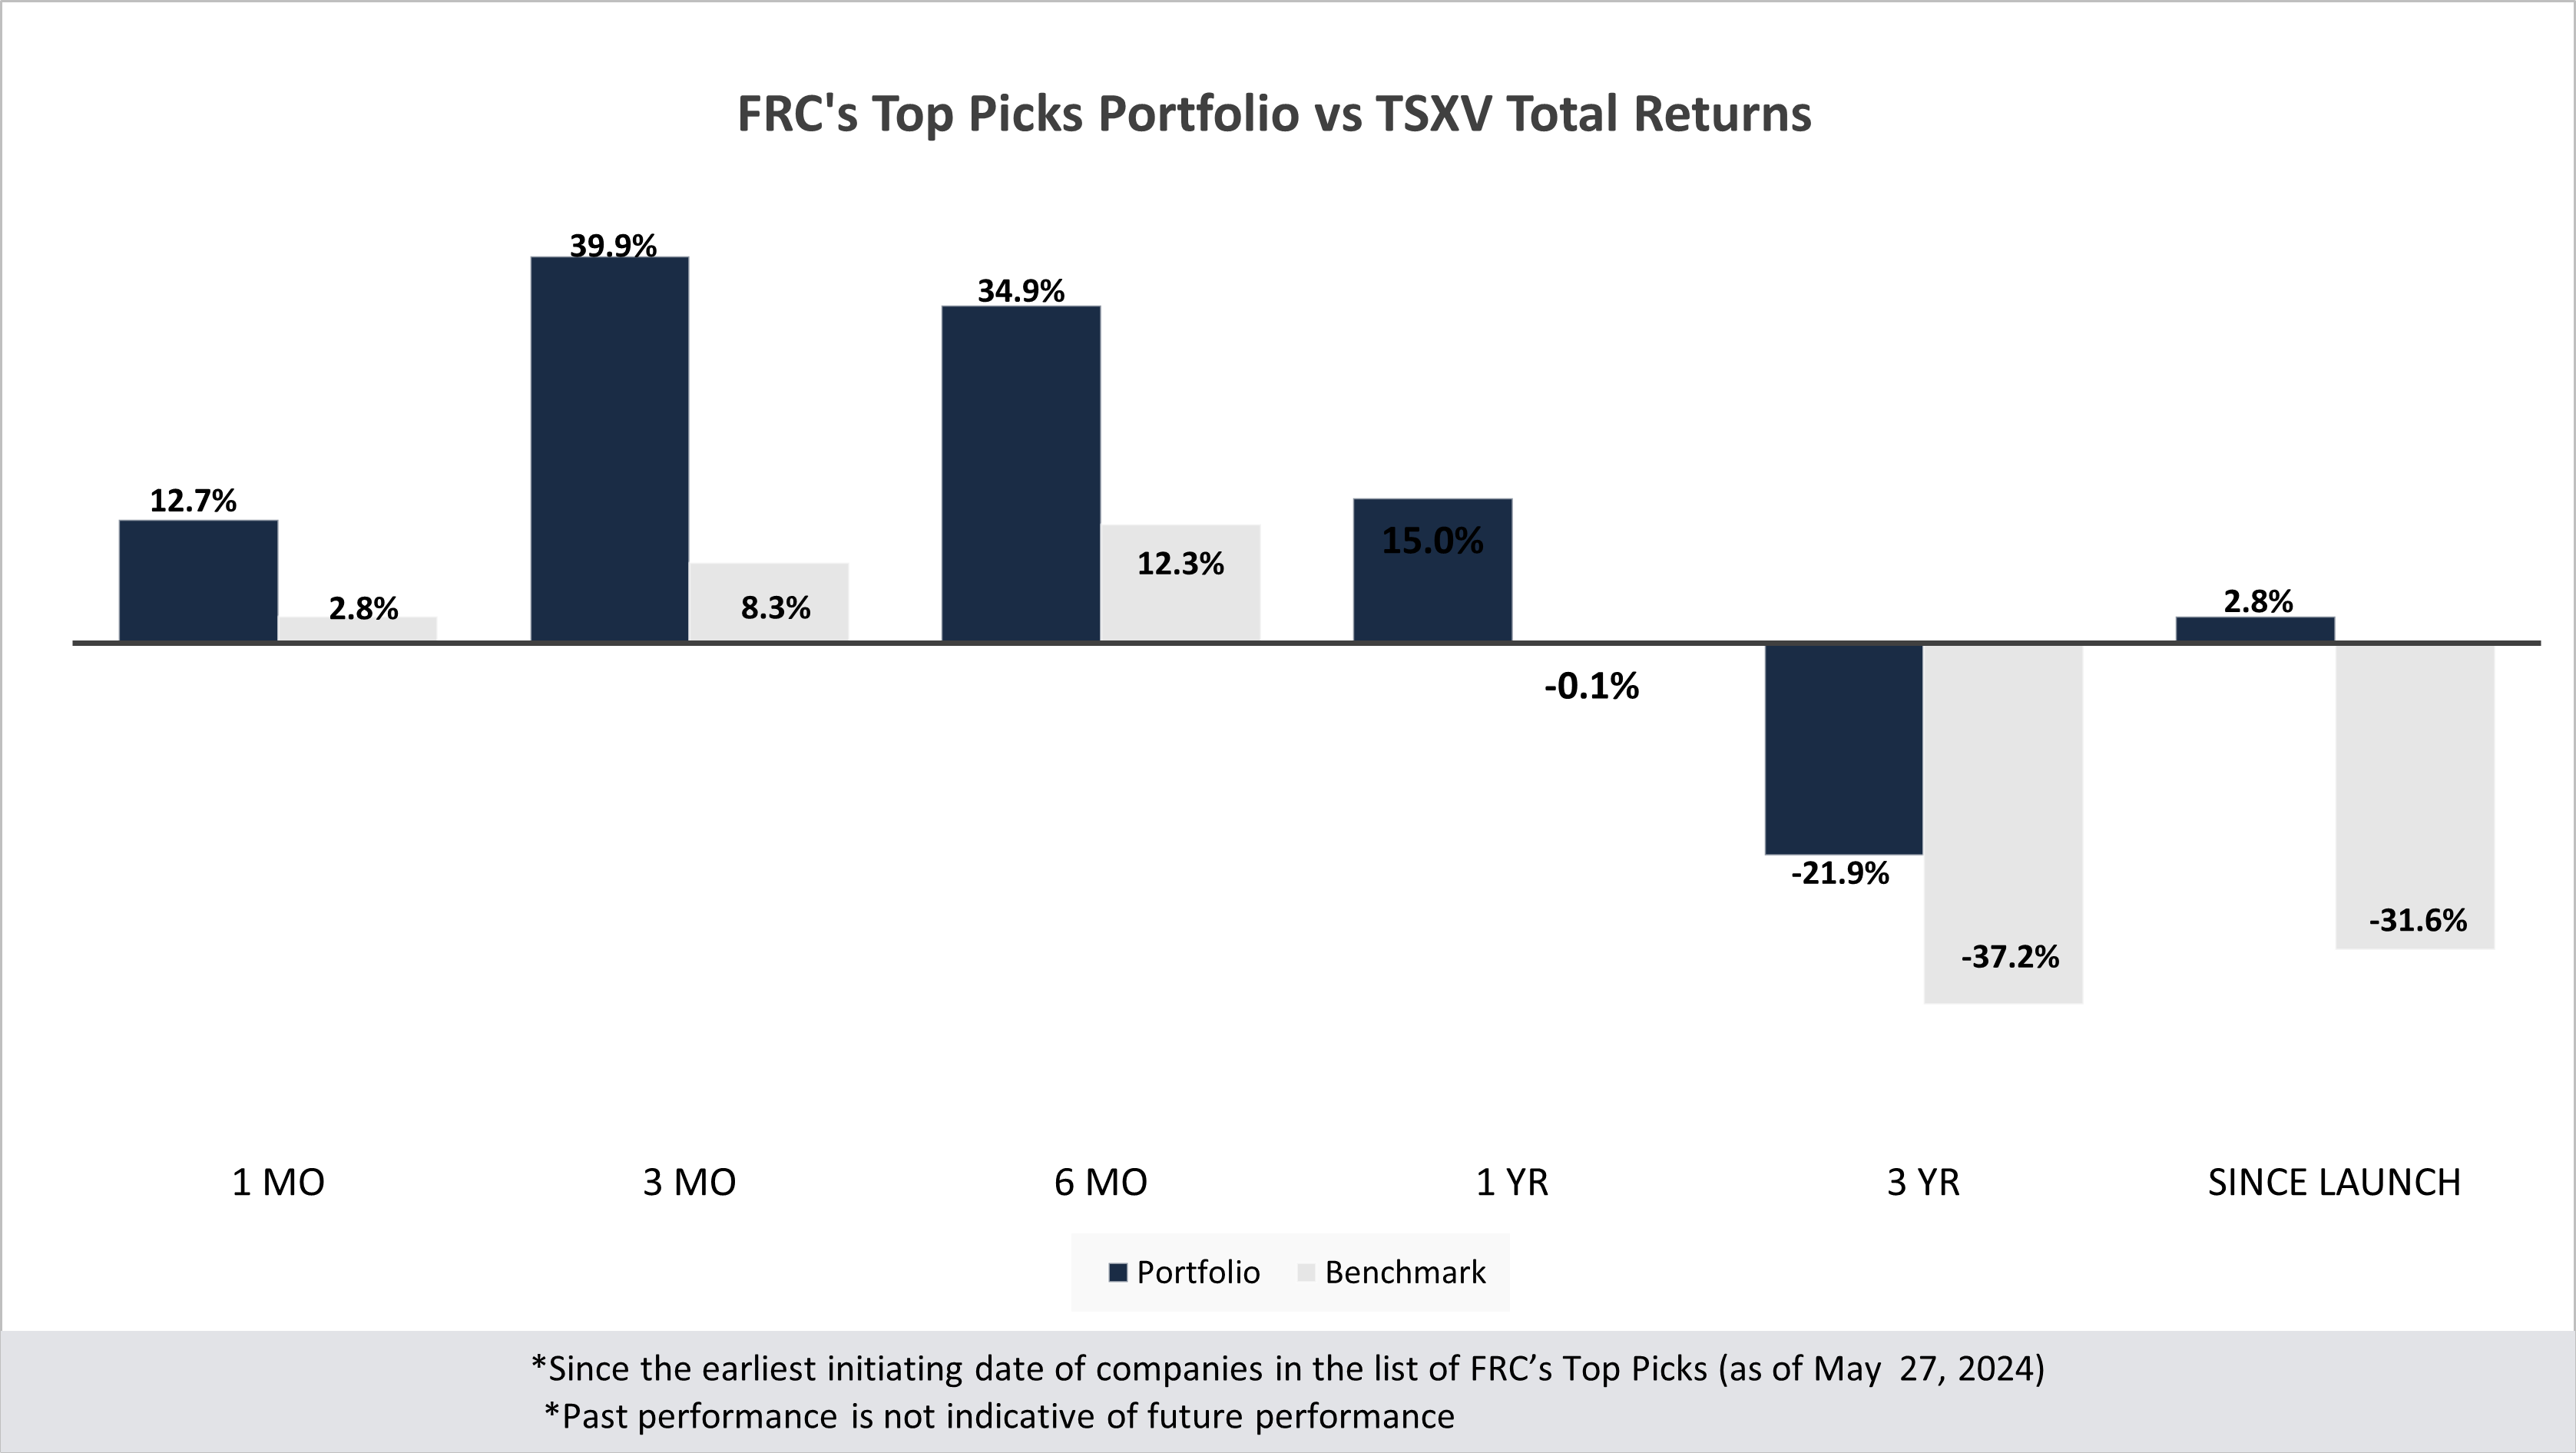
Performance by Sector
| Total Return |
1 mo |
3 mo |
6 mo |
1 yr |
3 yr |
Since launch |
| Mining |
19.7% |
54.8% |
45.0% |
17.6% |
-41.9% |
2.6% |
| Cannabis |
N/A |
N/A |
N/A |
N/A |
-41.6% |
-23.6% |
| Tech |
-27.3% |
42.9% |
33.3% |
-27.3% |
-35.5% |
-4.2% |
| Special Situations (MIC) |
-4.1% |
-3.8% |
10.8% |
19.3% |
-17.1% |
-10.5% |
| Private Companies |
N/A |
N/A |
N/A |
6.7% |
20.5% |
30.5% |
| Portfolio (Total) |
12.7% |
39.9% |
34.9% |
15.0% |
-21.9% |
2.8% |
| Benchmark (Total) |
2.8% |
8.3% |
12.3% |
-0.1% |
-37.2% |
-31.6% |
| Portfolio (Annualized) |
- |
- |
- |
15.0% |
-7.9% |
0.3% |
| Benchmark (Annualized) |
- |
- |
- |
-0.1% |
-14.4% |
-3.6% |
1. Since the earliest initiating date of companies in the list of Top Picks (as of May 27, 2024) 2. Green (blue) indicates FRC's picks outperformed (underperformed) the benchmark. 3. Past performance is not indicative of future performance. 4. Our complete list of top picks (updated weekly) can be viewed here: Top Picks List
Weekly Mining Commentary
Last week, global equity markets were down 0.6% on average (down 0.1% in the previous week). The S&P 500, gold, and copper have extended their retreat from the historic peaks observed two weeks ago. Last week, U.S. macroeconomic indicators pointed to weaker-than-anticipated GDP growth and moderate inflation, reinforcing our expectation of rate cuts by the Fed later this year.
That said, we anticipate the US$ will remain strong, given indications that global central banks, particularly the Bank of Canada, the European Central Bank, and the Bank of England, will likely cut rates sooner than the Fed. A robust US$ could exert downward pressure on both equity and metal prices.
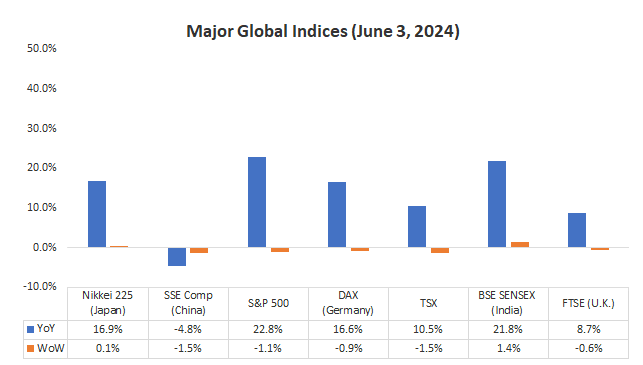
Source: FRC / Various
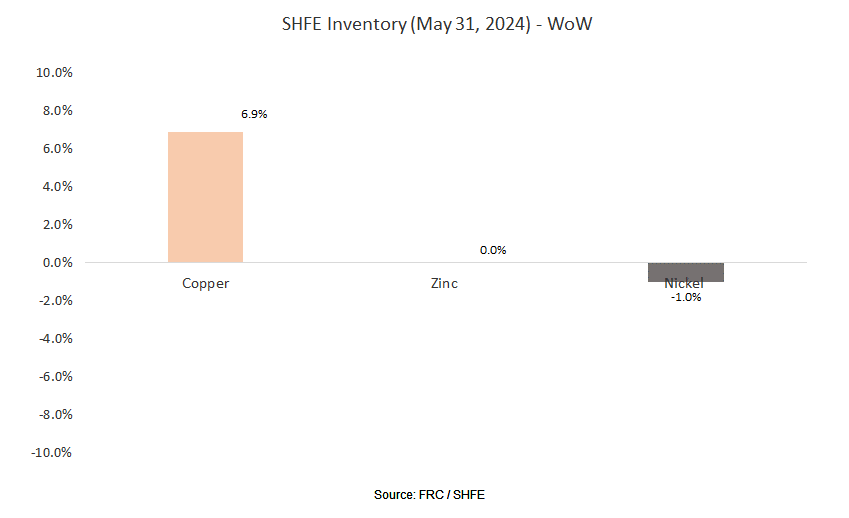
Last week, metal prices were down 2.0% on average (up 3.5% in the previous week).
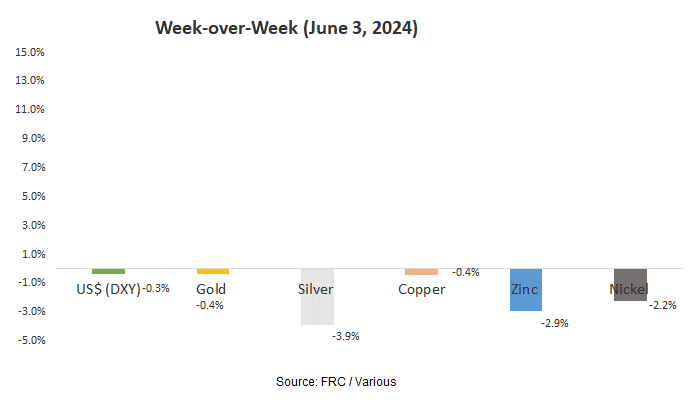
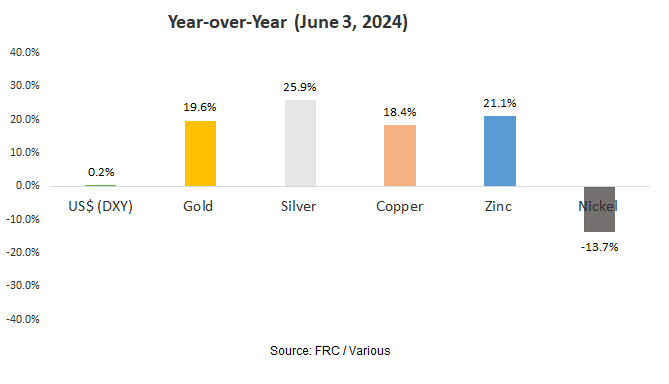
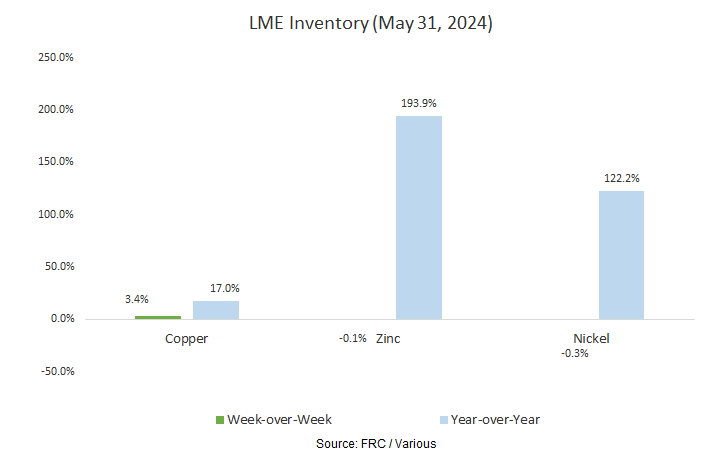
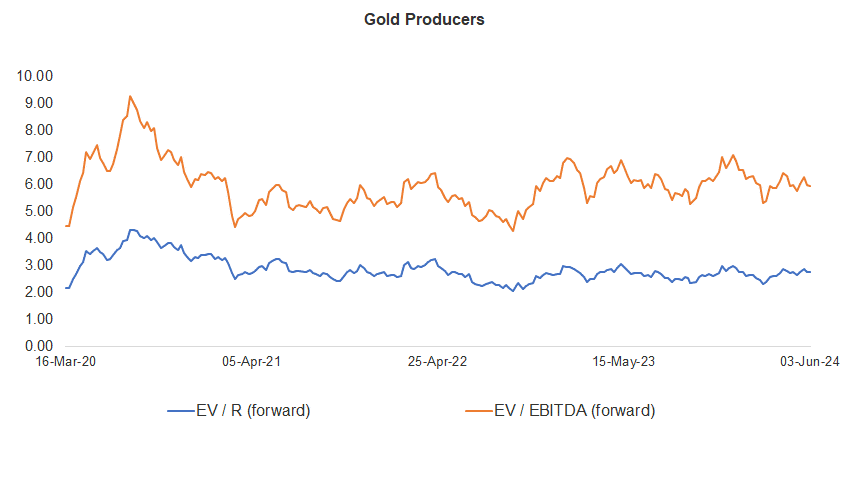
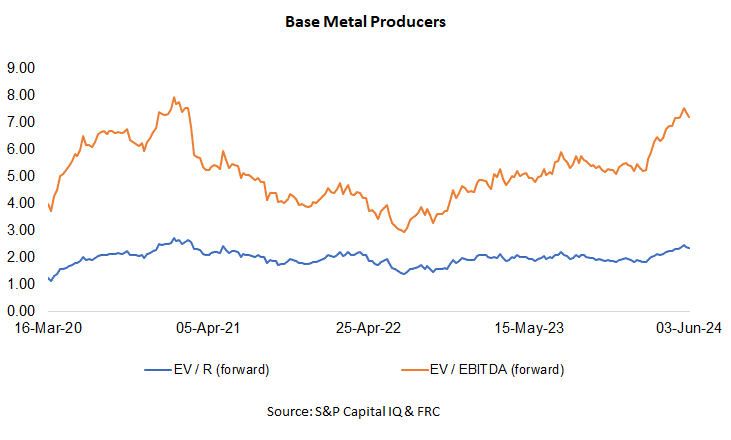
Gold producer valuations were down 0.3% last week (down 4.3% in the prior week); base metal producers were down 1.7% last week (down 2.6% in the prior week). On average, gold producer valuations are 17% lower (unchanged) than the past three instances when gold surpassed US$2k/oz.
| |
|
27-May-24 |
03-Jun-24 |
| |
Gold Producers |
EV / R (forward) |
EV / EBITDA (forward) |
EV / R (forward) |
EV / EBITDA (forward) |
| |
|
|
|
|
|
| |
|
|
|
|
|
| 1 |
Barrick |
3.10 |
6.60 |
3.09 |
6.50 |
| 2 |
Newmont |
3.18 |
7.37 |
3.17 |
7.29 |
| 3 |
Agnico Eagle |
4.53 |
8.55 |
4.53 |
8.42 |
| 4 |
AngloGold |
2.18 |
4.98 |
2.19 |
5.11 |
| 5 |
Kinross Gold |
2.55 |
5.71 |
2.57 |
5.61 |
| 6 |
Gold Fields |
2.85 |
5.29 |
2.78 |
4.98 |
| 7 |
Sibanye |
0.78 |
4.17 |
0.75 |
4.00 |
| 8 |
Hecla Mining |
4.89 |
15.87 |
5.05 |
16.58 |
| 9 |
B2Gold |
1.65 |
3.29 |
1.70 |
3.38 |
| 10 |
Alamos |
5.03 |
9.52 |
5.06 |
9.59 |
| 11 |
Harmony |
1.76 |
5.13 |
1.74 |
5.20 |
| 12 |
Eldorado Gold |
2.54 |
5.18 |
2.64 |
5.14 |
| |
Average (excl outliers) |
2.74 |
5.98 |
2.75 |
5.93 |
| |
Min |
0.78 |
3.29 |
0.75 |
3.38 |
| |
Max |
5.03 |
15.87 |
5.06 |
16.58 |
| |
Industry (three year average) |
110.70 |
116.70 |
110.70 |
116.70 |
| |
|
|
|
|
|
| |
Base Metal Producers |
EV / R (forward) |
EV / EBITDA (forward) |
EV / R (forward) |
EV / EBITDA (forward) |
| |
|
|
|
|
|
| |
|
|
|
|
|
| 1 |
BHP Group |
3.07 |
5.92 |
3.06 |
5.89 |
| 2 |
Rio Tinto |
2.41 |
5.14 |
2.33 |
4.91 |
| 3 |
South32 |
1.69 |
7.95 |
1.73 |
8.05 |
| 4 |
Glencore |
0.46 |
6.19 |
0.46 |
6.29 |
| 5 |
Anglo American |
2.00 |
5.93 |
1.96 |
5.79 |
| 6 |
Teck Resources |
3.11 |
7.17 |
3.11 |
7.08 |
| 7 |
First Quantum |
3.92 |
13.38 |
3.82 |
12.50 |
| |
Average (excl outliers) |
2.38 |
7.38 |
2.35 |
7.22 |
| |
Min |
0.46 |
5.14 |
0.46 |
4.91 |
| |
Max |
3.92 |
13.38 |
3.82 |
12.50 |
Source: S&P Capital IQ & FRC
We are maintaining our metal price forecasts.

Weekly Crypto Commentary
Prices of mainstream/popular cryptos were down 1% on average last week (up 2% in the previous week).
| June 3, 2024 |
|
|
| Cryptocurrencies |
1-Week |
1-Year |
| Bitcoin |
2% |
155% |
| Binance Coin |
5% |
104% |
| Cardano |
1% |
21% |
| Ethereum |
0% |
99% |
| Polkadot |
-7% |
35% |
| XRP |
-1% |
0% |
| Polygon |
-5% |
-21% |
| Solana |
-2% |
688% |
| |
|
|
| AVERAGE |
-1% |
135% |
| MIN |
-7% |
-21% |
| MAX |
5% |
688% |
| |
|
|
| Indices |
| Canadian |
1-Week |
1-Year |
| BTCC |
1% |
162% |
| BTCX |
2% |
172% |
| EBIT |
1% |
169% |
| FBTC |
1% |
48% |
| U.S. |
1-Week |
1-Year |
| BITO |
-6% |
82% |
| BTF |
-2% |
115% |
| IBLC |
-3% |
61% |
Source: FRC/Yahoo Finance
The global MCAP of cryptos is US$2.71T, up 10% MoM, and 126%YoY.
Total Crypto Market Cap Chart

Source: CoinGecko
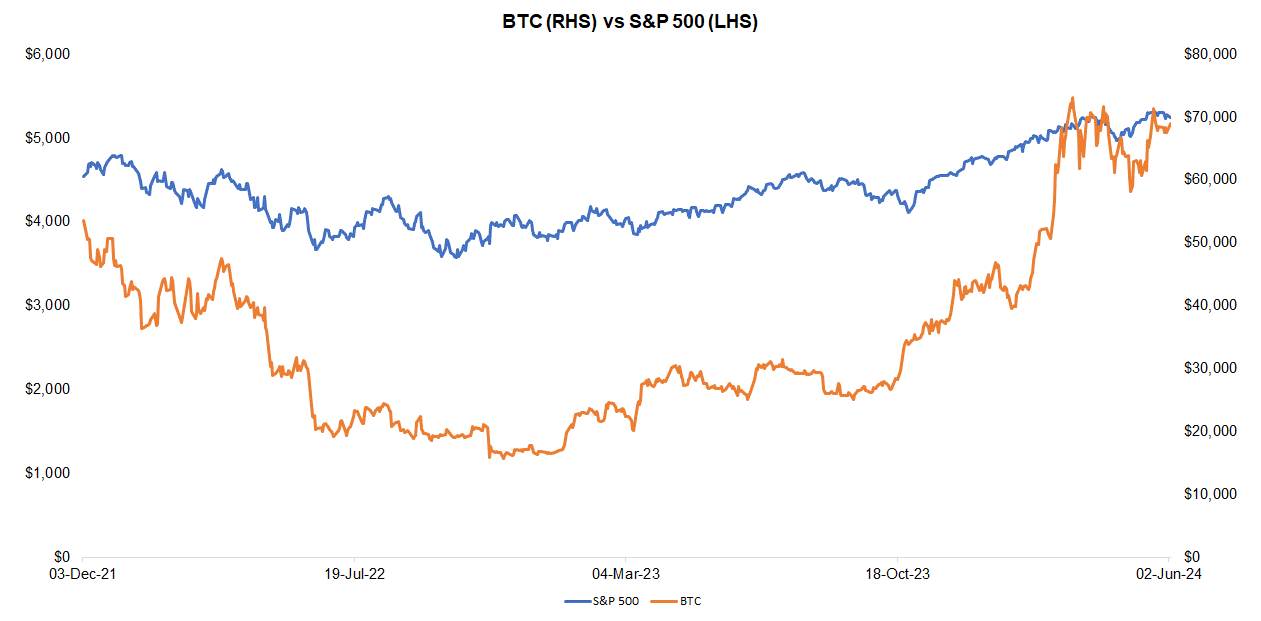
Last week, BTC was up 2.3%, while the S&P 500 was down 1.1%. The U.S. 10-year treasury yield was down 1.5%.
Source: FRC/ Yahoo Finance
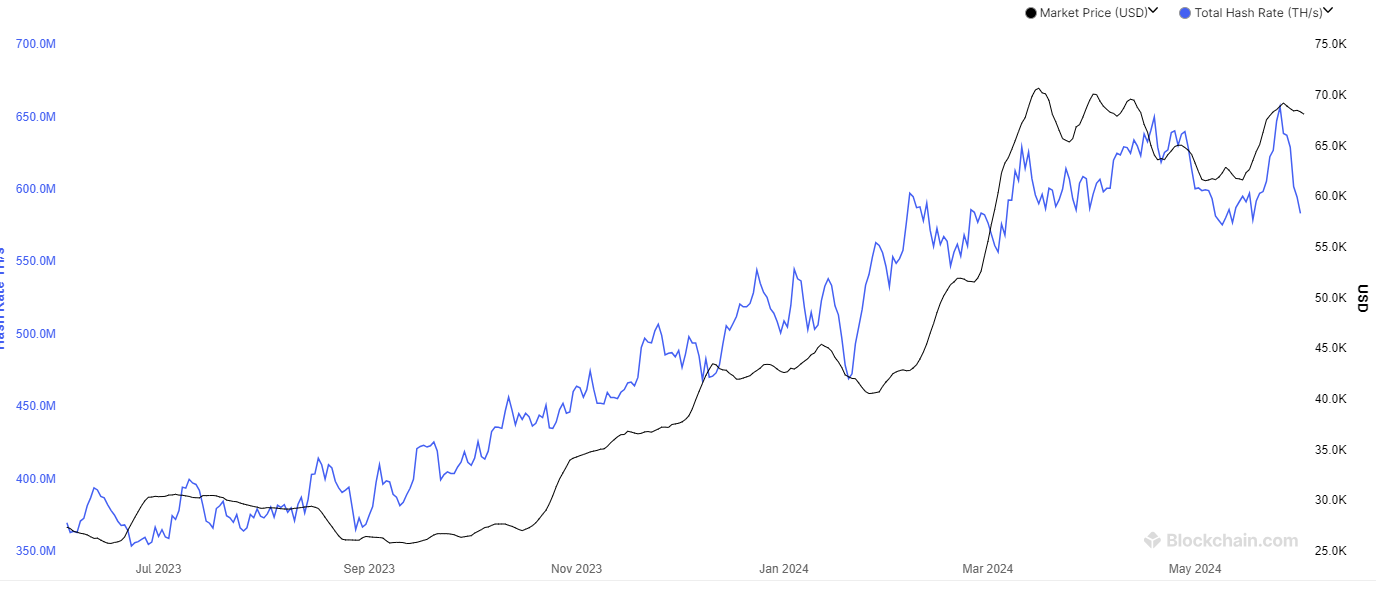
The global hash rate of BTC (defined as calculations performed per second/an indicator of network difficulty) is 584 exahashes per second (EH/s), down 8% WoW, and 3% MoM. The decrease in hash rates is positive for miners as their efficiency rates (BTC production per EH/s) are inversely linked to global hash rates.
Total Hash Rate (BTC)
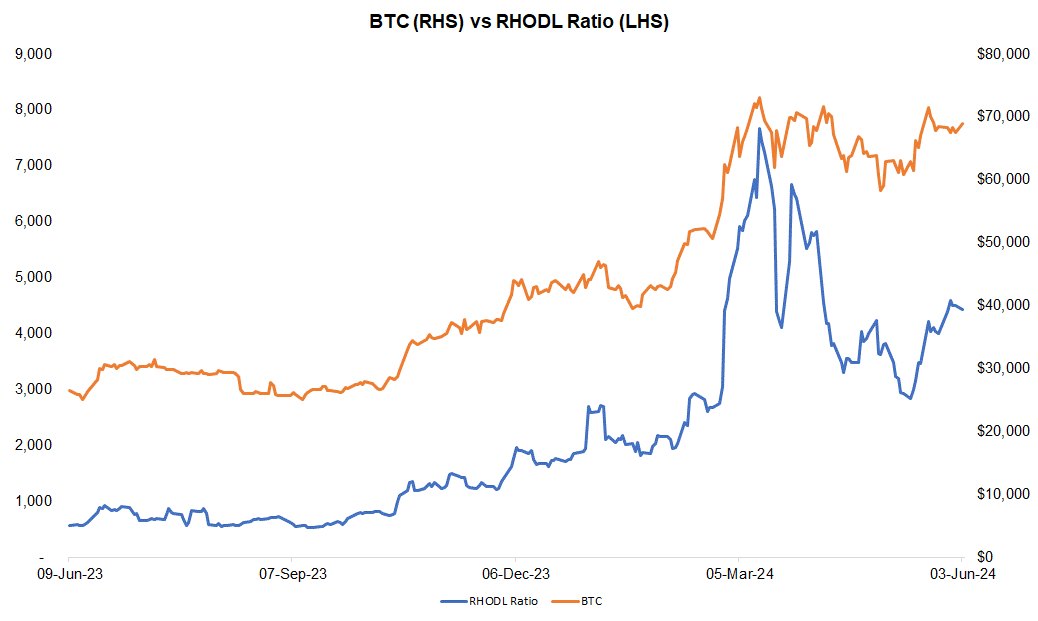
The Realized HODL ratio (RHODL), which gauges the activity of short-term holders relative to long-term holders, is up 10% WoW, and 675% YoY. We interpret the increase in RHODL as a sign of strengthening demand, suggesting potential for an uptick in near-term prices. Historically, BTC prices have moved in tandem with this ratio. By tracking RHODL, we believe we can identify potential turning points in BTC prices.
Source: FRC/ Various
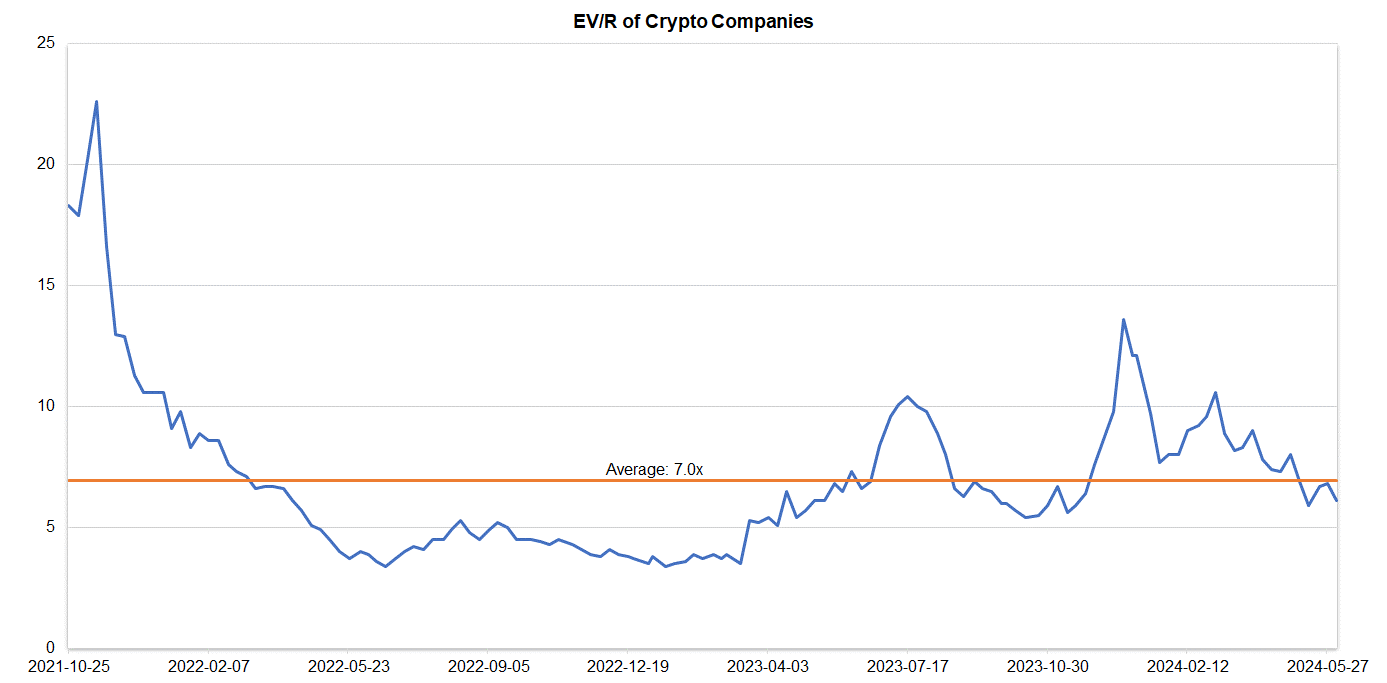
Companies operating in the crypto space are trading at an average EV/R of 6.1x (previously 6.8x).
Source: S&P Capital IQ/FRC
| June 3, 2024 |
|
|
| Crypto Companies |
Ticker |
TEV/Revenue |
| Argo Blockchain |
LSE: ARB |
2.2 |
| BIGG Digital |
CSE: BIGG |
5.8 |
| Bitcoin Well |
TSXV: BTCW |
0.9 |
| Canaan Inc. |
NASDAQ: CAN |
1.2 |
| CleanSpark Inc. |
NasdaqCM:CLSK |
11.8 |
| Coinbase Global |
NASDAQ: COIN |
14.1 |
| Galaxy Digital Holdings |
TSX: GLXY |
N/A |
| HIVE Digital |
TSXV:HIVE |
3.0 |
| Hut 8 Mining Corp. |
TSX: HUT |
8.2 |
| Marathon Digital Holdings |
NASDAQ: MARA |
10.7 |
| Riot Platforms |
NASDAQ: RIOT |
7.5 |
| SATO Technologies |
TSXV: SATO |
1.5 |
| AVERAGE |
|
6.1 |
| MEDIAN |
|
5.8 |
| MINIMUM |
|
0.9 |
| MAXIMUM |
|
14.1 |
Source: S&P Capital IQ/FRC


 Source: Company


