Updates from Financials, Technology, Energy, and Special Situations Companies Under Coverage
Enterprise Group Inc./ TSX
PR Title: Adds a new tier one petroleum producer client
FRC Opinion: Positive – E has secured an undisclosed tier-one client, bolstering its roster. The company generates revenue from renting equipment to oil and gas companies, including majors such as Suncor (TSX: SU), Chevron (NYSE: CVX), ConocoPhillips (NYSE: COP), Tourmaline Oil (TSX:TOU), and Cenovus Energy (TSX:CVE). In response to increased demand from clients, the company recently closed a $7M bought deal financing to expand its rental equipment fleet.
FRC Top Picks
The following table shows last week’s top five performers among our Top Picks, including five junior resource companies. The top performer, World Copper (TSXV: WCU), was up 58%. WCU is advancing multiple copper projects in the Americas.
| Top 5 Weekly Performers |
WoW Returns |
| World Copper Ltd. (WCU.V) |
57.5% |
| Fortune Minerals Limited (FT.TO) |
50.0% |
| Transition Metals Corp.(XTM.V) |
45.5% |
| Verde Agritech Plc. (NPK.TO) |
38.2% |
| Southern Silver Exploration Corp. (SSV.V) |
34.8% |
| * Past performance is not indicative of future performance (as of May 21, 2024) |
|
Source: FRC
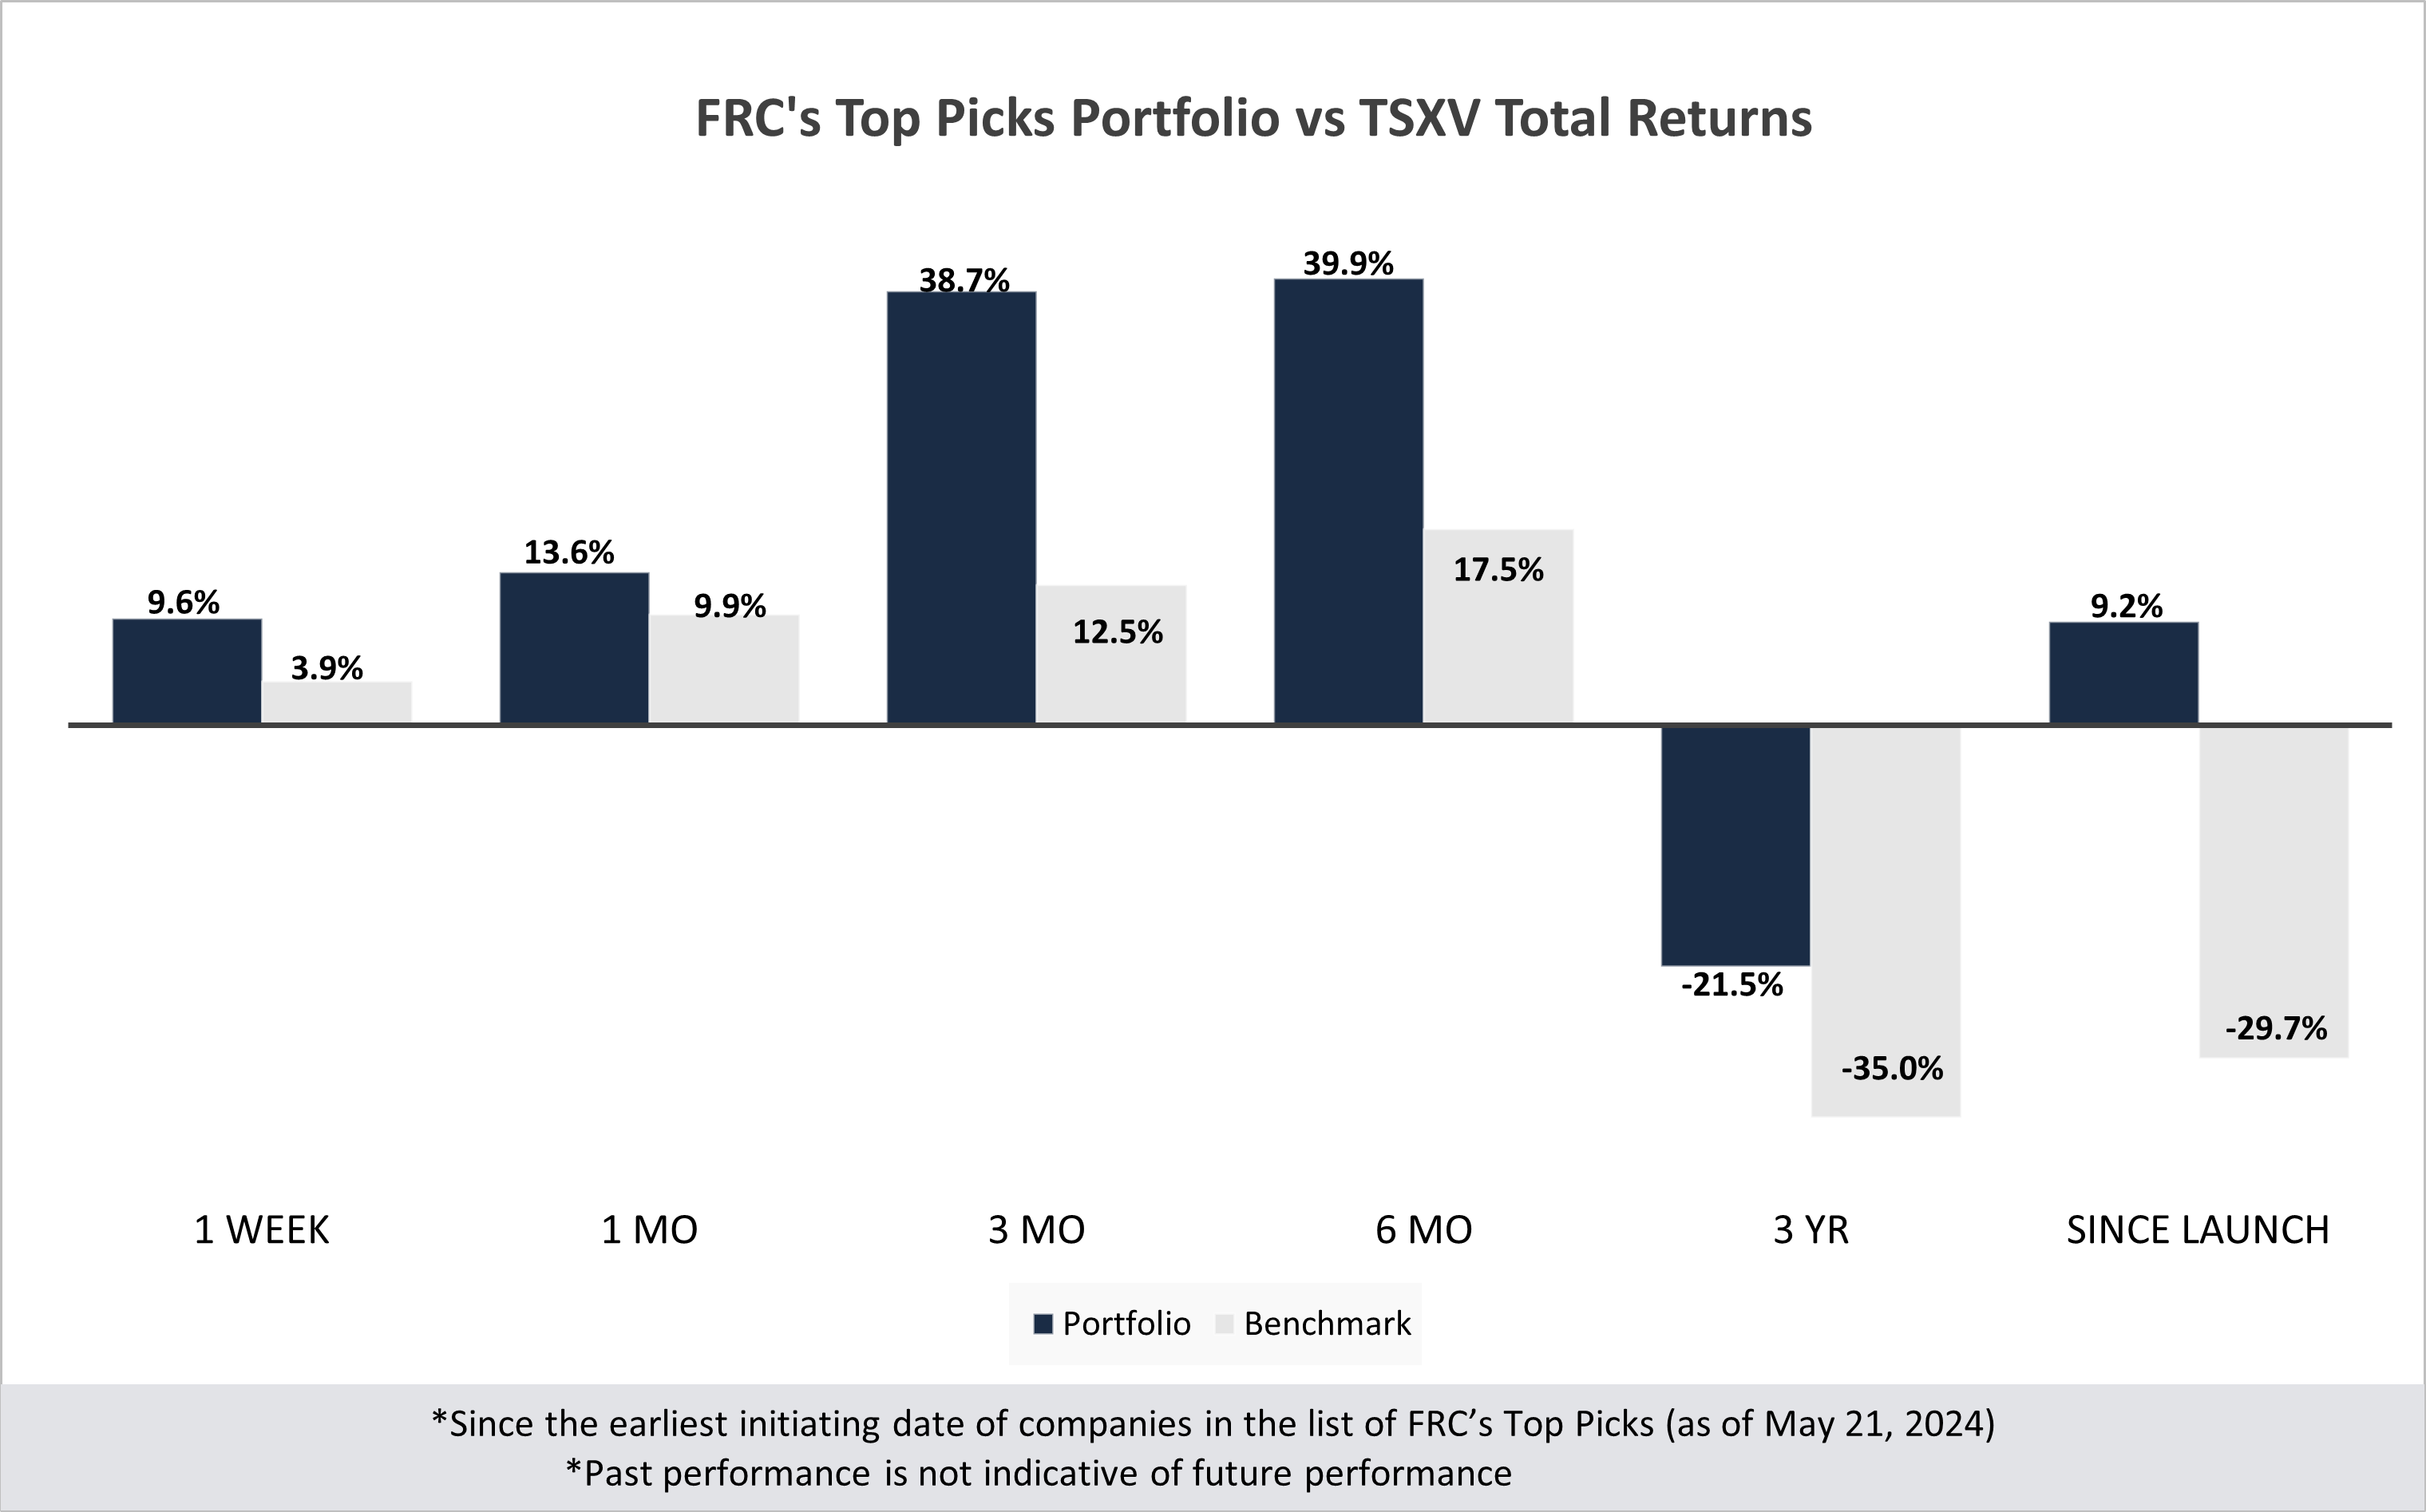
Last week, companies on our Top Picks list were up 9.6% on average vs 3.9% for the benchmark (TSXV). Our top picks have outperformed the benchmark in all of the six time periods listed below.
Performance by Sector
| Total Return |
1 Week |
1 mo |
3 mo |
6 mo |
3 yr |
Since launch |
| Mining |
13.6% |
20.7% |
53.4% |
50.0% |
-41.9% |
16.0% |
| Cannabis |
N/A |
N/A |
N/A |
N/A |
-41.7% |
-23.6% |
| Tech |
-4.7% |
-31.7% |
25.0% |
2.5% |
-34.6% |
-4.2% |
| Special Situations (MIC) |
-0.9% |
-3.4% |
-2.0% |
8.9% |
-17.4% |
-11.4% |
| Private Companies |
N/A |
N/A |
N/A |
N/A |
20.5% |
30.5% |
| Portfolio (Total) |
9.6% |
13.6% |
38.7% |
39.9% |
-21.5% |
9.2% |
| Benchmark (Total) |
3.9% |
9.9% |
12.5% |
17.5% |
-35.0% |
-29.7% |
| Portfolio (Annualized) |
- |
- |
- |
- |
-7.8% |
0.9% |
| Benchmark (Annualized) |
- |
- |
- |
- |
-13.4% |
-3.3% |
1. Since the earliest initiating date of companies in the list of Top Picks (as of May 13, 2024) 2. Green (blue) indicates FRC's picks outperformed (underperformed) the benchmark. 3. Past performance is not indicative of future performance. 4. Our complete list of top picks (updated weekly) can be viewed here: Top Picks List
Weekly Mining Commentary
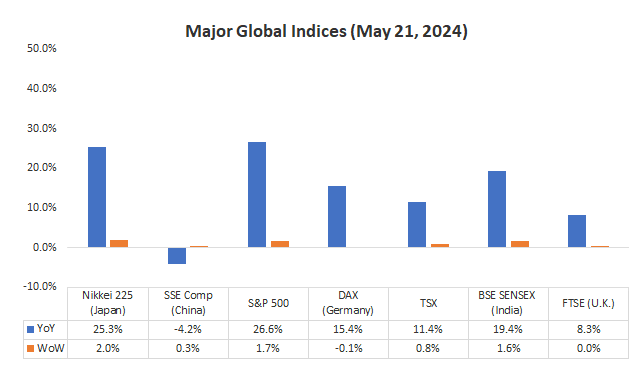
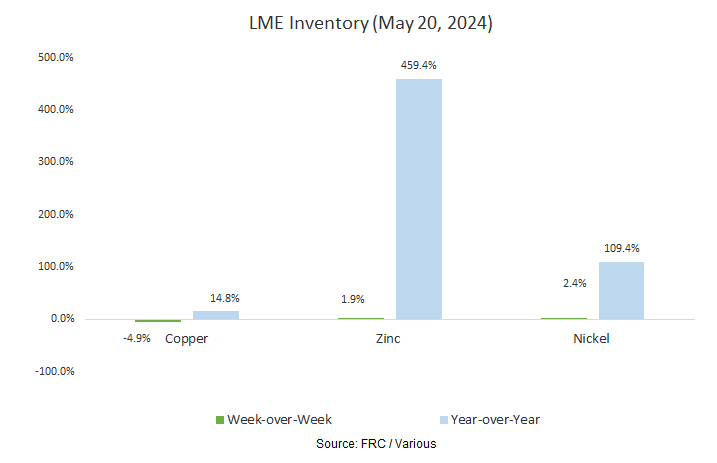
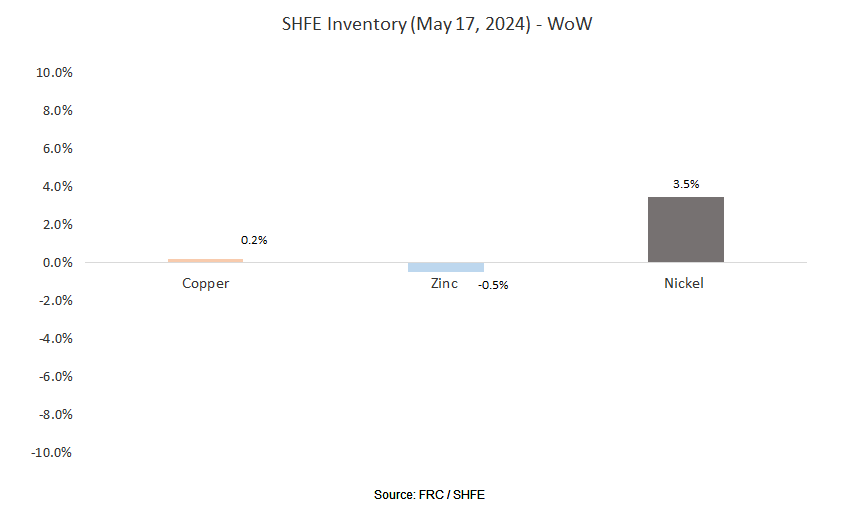
Last week, global equity markets were up 0.9% on average (up 0.8% in the previous week). Equity markets and metal prices surged as the US$ retreated amidst signs of a slowing U.S. economy. New data indicated stagnating retail sales, weak industrial production, high jobless claims, and a weaker than expected core CPI. Consequently, the S&P 500 surged past 5,300 for the first time.
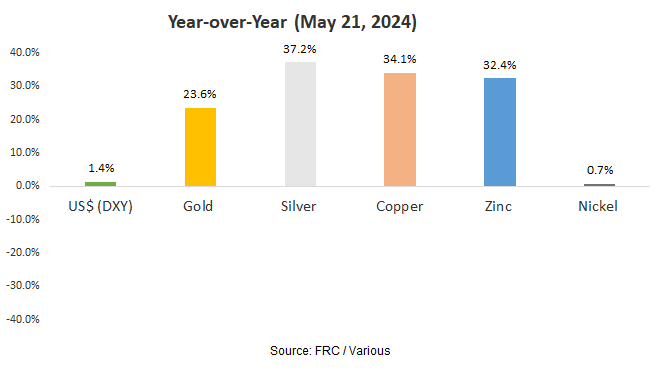
Gold broke the US$2,400/oz barrier, while copper breached US$5/lb, both reaching unprecedented levels. Additionally, silver climbed above US$30/oz for the first time since 2012. Our forecasts proved accurate. Earlier this year, we anticipated gold and silver surpassing US$2,300/oz and US$30/oz, respectively, when they were trading at US$2,000/oz and US$23/oz.
Source: FRC / Various
Last week, metal prices were up 7.9% on average (up 2.1% in the previous week).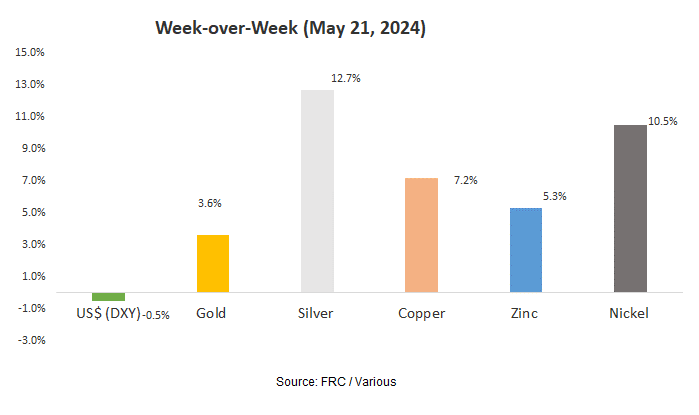
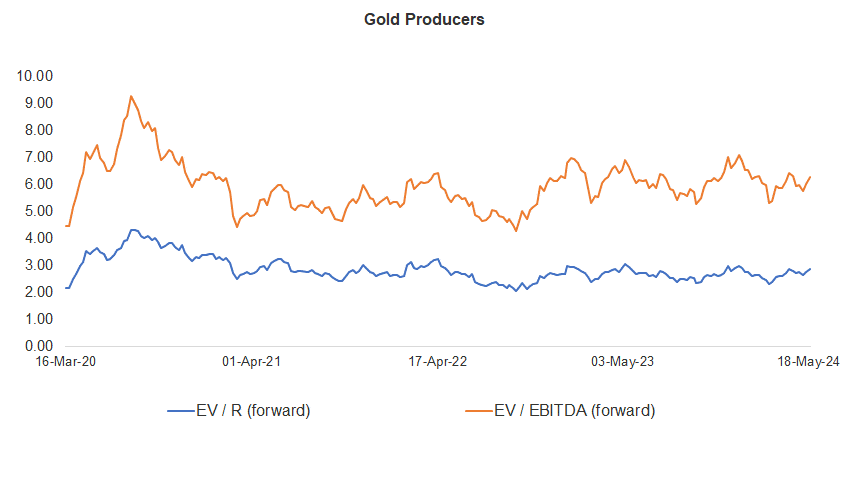
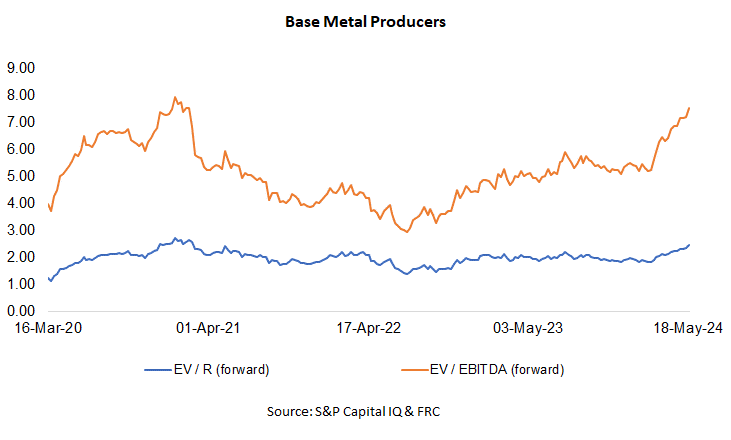
Gold producer valuations were up 4.2% last week (down 3.8% in the prior week); base metal producers were up 4.8% last week (up 0.8% in the prior week). On average, gold producer valuations are 13% lower (previously 17%) compared to the past three instances when gold surpassed US$2k/oz.
| |
|
13-May-24 |
21-May-24 |
| |
Gold Producers |
EV / R (forward) |
EV / EBITDA (forward) |
EV / R (forward) |
EV / EBITDA (forward) |
| |
|
|
|
|
|
| |
|
|
|
|
|
| 1 |
Barrick |
3.10 |
6.59 |
3.22 |
6.86 |
| 2 |
Newmont |
3.29 |
7.61 |
3.42 |
7.90 |
| 3 |
Agnico Eagle |
4.67 |
8.89 |
4.82 |
9.19 |
| 4 |
AngloGold |
2.18 |
4.96 |
2.30 |
5.26 |
| 5 |
Kinross Gold |
2.43 |
5.50 |
2.55 |
5.71 |
| 6 |
Gold Fields |
2.93 |
5.45 |
2.89 |
5.38 |
| 7 |
Sibanye |
0.75 |
3.96 |
0.81 |
4.33 |
| 8 |
Hecla Mining |
4.64 |
14.85 |
5.34 |
17.31 |
| 9 |
B2Gold |
1.71 |
3.52 |
1.78 |
3.59 |
| 10 |
Alamos |
5.02 |
9.46 |
5.20 |
9.79 |
| 11 |
Harmony |
1.70 |
4.95 |
1.87 |
5.45 |
| 12 |
Eldorado Gold |
2.47 |
5.07 |
2.61 |
5.35 |
| |
Average (excl outliers) |
2.75 |
6.00 |
2.86 |
6.26 |
| |
Min |
0.75 |
3.52 |
0.81 |
3.59 |
| |
Max |
5.02 |
14.85 |
5.34 |
17.31 |
| |
Industry (three year average) |
110.70 |
116.70 |
110.70 |
116.70 |
| |
|
|
|
|
|
| |
Base Metal Producers |
EV / R (forward) |
EV / EBITDA (forward) |
EV / R (forward) |
EV / EBITDA (forward) |
| |
|
|
|
|
|
| |
|
|
|
|
|
| 1 |
BHP Group |
2.93 |
5.65 |
3.14 |
6.04 |
| 2 |
Rio Tinto |
2.34 |
4.98 |
2.47 |
5.23 |
| 3 |
South32 |
1.58 |
7.36 |
1.71 |
7.97 |
| 4 |
Glencore |
0.45 |
6.04 |
0.47 |
6.31 |
| 5 |
Anglo American |
2.01 |
5.96 |
2.04 |
6.02 |
| 6 |
Teck Resources |
3.12 |
7.21 |
3.20 |
7.39 |
| 7 |
First Quantum |
3.92 |
13.30 |
4.11 |
13.99 |
| |
Average (excl outliers) |
2.34 |
7.21 |
2.45 |
7.56 |
| |
Min |
0.45 |
4.98 |
0.47 |
5.23 |
| |
Max |
3.92 |
13.30 |
4.11 |
13.99 |
Source: S&P Capital IQ & FRC
Despite the recent surge in metal prices, we are maintaining our metal price forecasts. We will make changes if prices remain at their current levels for an extended period.

Weekly Crypto Commentary
Prices of mainstream/popular cryptos were up 13% on average last week (down 5% in the previous week).
| May 21, 2024 |
|
|
| Cryptocurrencies |
1-Week |
1-Year |
| Bitcoin |
7% |
161% |
| Binance Coin |
8% |
101% |
| Cardano |
9% |
39% |
| Ethereum |
27% |
107% |
| Polkadot |
16% |
43% |
| XRP |
5% |
18% |
| Polygon |
11% |
-16% |
| Solana |
22% |
781% |
| |
|
|
| AVERAGE |
13% |
154% |
| MIN |
5% |
-16% |
| MAX |
27% |
781% |
| |
|
|
| Indices |
| Canadian |
1-Week |
1-Year |
| BTCC |
13% |
149% |
| BTCX |
13% |
158% |
| EBIT |
13% |
155% |
| FBTC |
9% |
50% |
| U.S. |
1-Week |
1-Year |
| BITO |
8% |
81% |
| BTF |
16% |
102% |
| IBLC |
8% |
60% |
Source: FRC/Yahoo Finance
The global MCAP of cryptos is US$2.77T, up 10% MoM, and 137%YoY.
Total Crypto Market Cap Chart

Source: CoinGecko
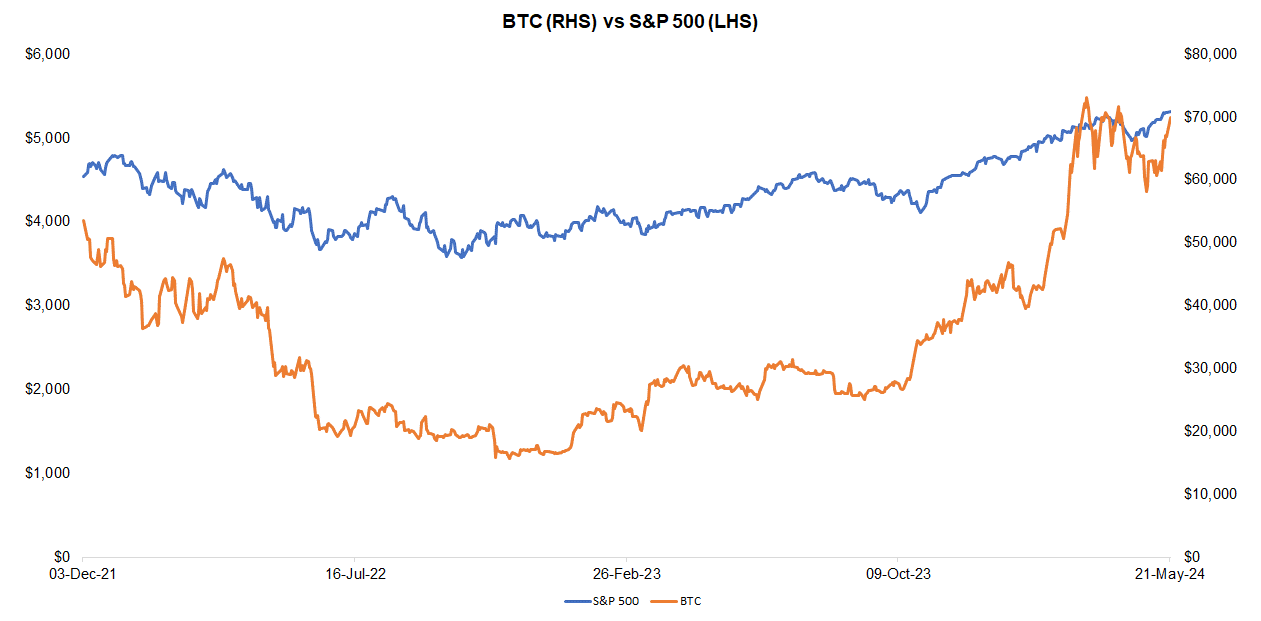
Last week, BTC was up 7%, while the S&P 500 was up 2%.
Source: FRC/ Yahoo Finance
The global hash rate of BTC (defined as calculations performed per second/an indicator of network difficulty) is 592 exahashes per second (EH/s), up 1% WoW, but down 9% MoM. The increase in hash rates is negative for miners as their efficiency rates (BTC production per EH/s) are inversely linked to global hash rates.
Total Hash Rate (BTC)

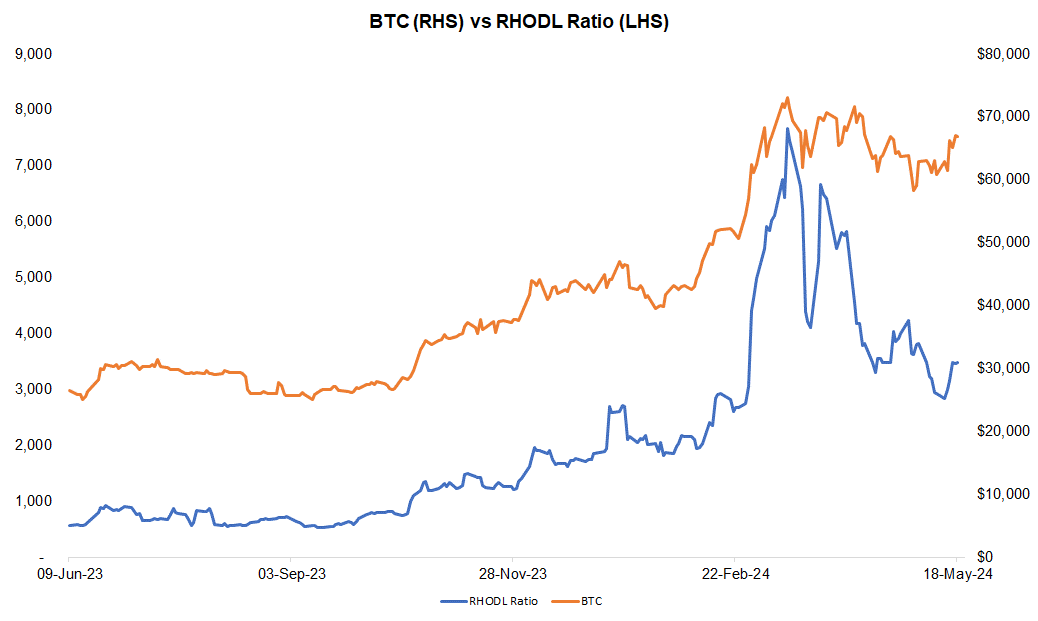
The Realized HODL ratio (RHODL), which gauges the activity of short-term holders relative to long-term holders, is up 19% WoW, and 505% YoY. We interpret the increase in RHODL ratio as a sign of strengthening demand, suggesting potential for an uptick in near-term prices. Historically, BTC prices have moved in tandem with this ratio. By tracking the RHODL, we believe we can identify potential turning points in BTC prices.
Source: FRC/ Various
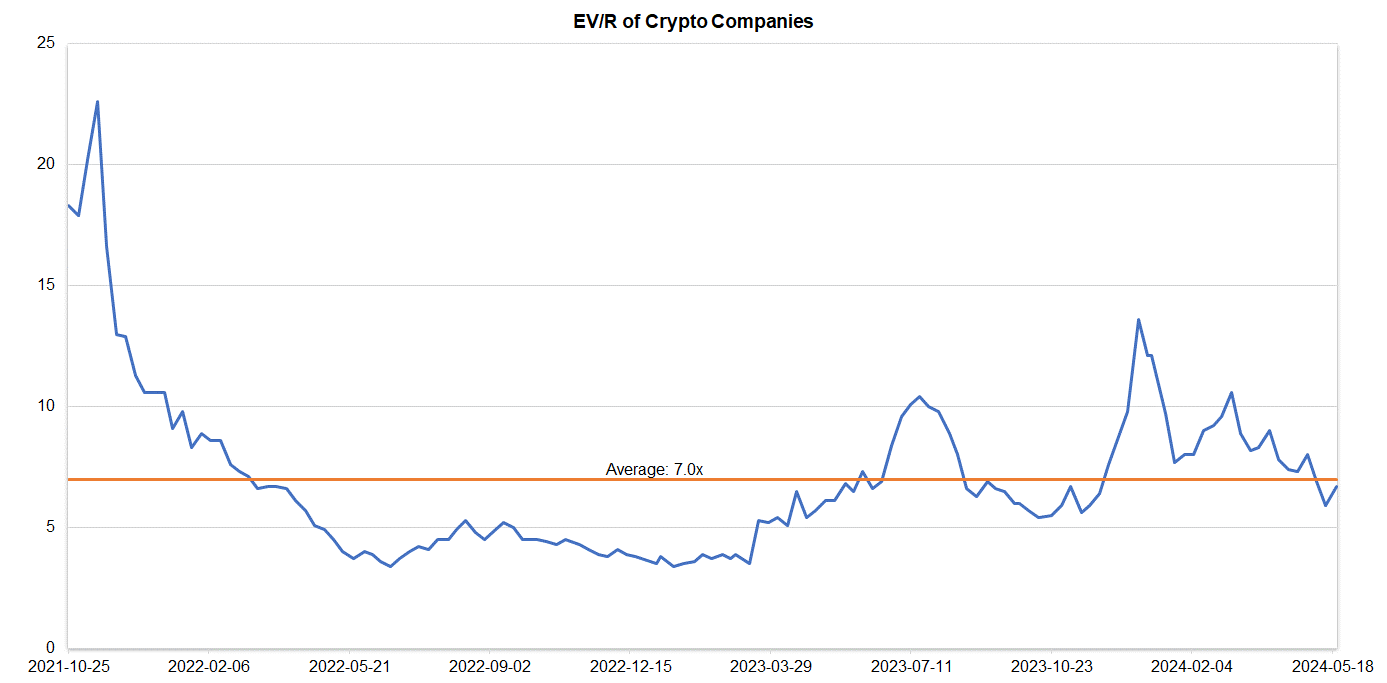
Companies operating in the crypto space are trading at an average EV/R of 6.7x (previously 5.9x).
Source: S&P Capital IQ/FRC
| May 21, 2024 |
|
|
| Crypto Companies |
Ticker |
TEV/Revenue |
| Argo Blockchain |
LSE: ARB |
2.8 |
| BIGG Digital |
CSE: BIGG |
8.4 |
| Bitcoin Well |
TSXV: BTCW |
0.8 |
| Canaan Inc. |
NASDAQ: CAN |
1.0 |
| CleanSpark Inc. |
NasdaqCM:CLSK |
13.6 |
| Coinbase Global |
NASDAQ: COIN |
14.1 |
| Galaxy Digital Holdings |
TSX: GLXY |
N/A |
| HIVE Digital |
TSXV:HIVE |
2.8 |
| Hut 8 Mining Corp. |
TSX: HUT |
8.2 |
| Marathon Digital Holdings |
NASDAQ: MARA |
12.2 |
| Riot Platforms |
NASDAQ: RIOT |
8.7 |
| SATO Technologies |
TSXV: SATO |
1.5 |
| AVERAGE |
|
6.7 |
| MEDIAN |
|
8.2 |
| MINIMUM |
|
0.8 |
| MAXIMUM |
|
14.1 |
Source: S&P Capital IQ/FRC


