Updates on Financials, Technology, Energy, and Special Situations Companies Under Coverage
Enterprise Group Inc./TSX:E
PR Title: Announces an exclusive agreement with a leading turbine manufacturer
Analyst Opinion: Positive - E will start offering FlexEnergy Solutions's products, including turbine units for temporary power needs, to businesses in Western Canada. FlexEnergy is a globally recoginized original equipment manufacturer of turbine and microturbine power generation equipment. We believe it is highly commendable that a leading manufacturer has signed an exclusive deal with Enterprise. This agreement also broadens E's product offering. E is up 50% since our previous report in August 2024, and 428% since our initial report in July 2022. In Q2-2024, revenue was up 41% YoY, and EPS turned positive. We anticipate record revenue and EPS in 2024.
FRC Top Picks
The following table shows last month’s top five performers among our Top Picks. The top performer, Zepp Health Corporation, was up 22%. Zepp is the sixth-largest player in the global smartwatch market by sales, trailing Apple (NASDAQ: AAPL), Garmin (NYSE: GRMN), Samsung (KOSE: A005930), Huawei, and Fitbit (Google/NASDAQ: GOOGL).
| Top Five Weekly Performers |
WoW Returns |
| Zepp Health Corporation (ZEPP) |
22.0% |
| Millennial Potash Corp. (MLP.V) |
21.3% |
| Golden Minerals Company (AUMN.TO) |
18.2% |
| Panoro Minerals (PML.V) |
7.4% |
| Steppe Gold (STGO.TO) |
6.7% |
| * Past performance is not indicative of future performance (as of Oct 1, 2024) |
|
Source: FRC
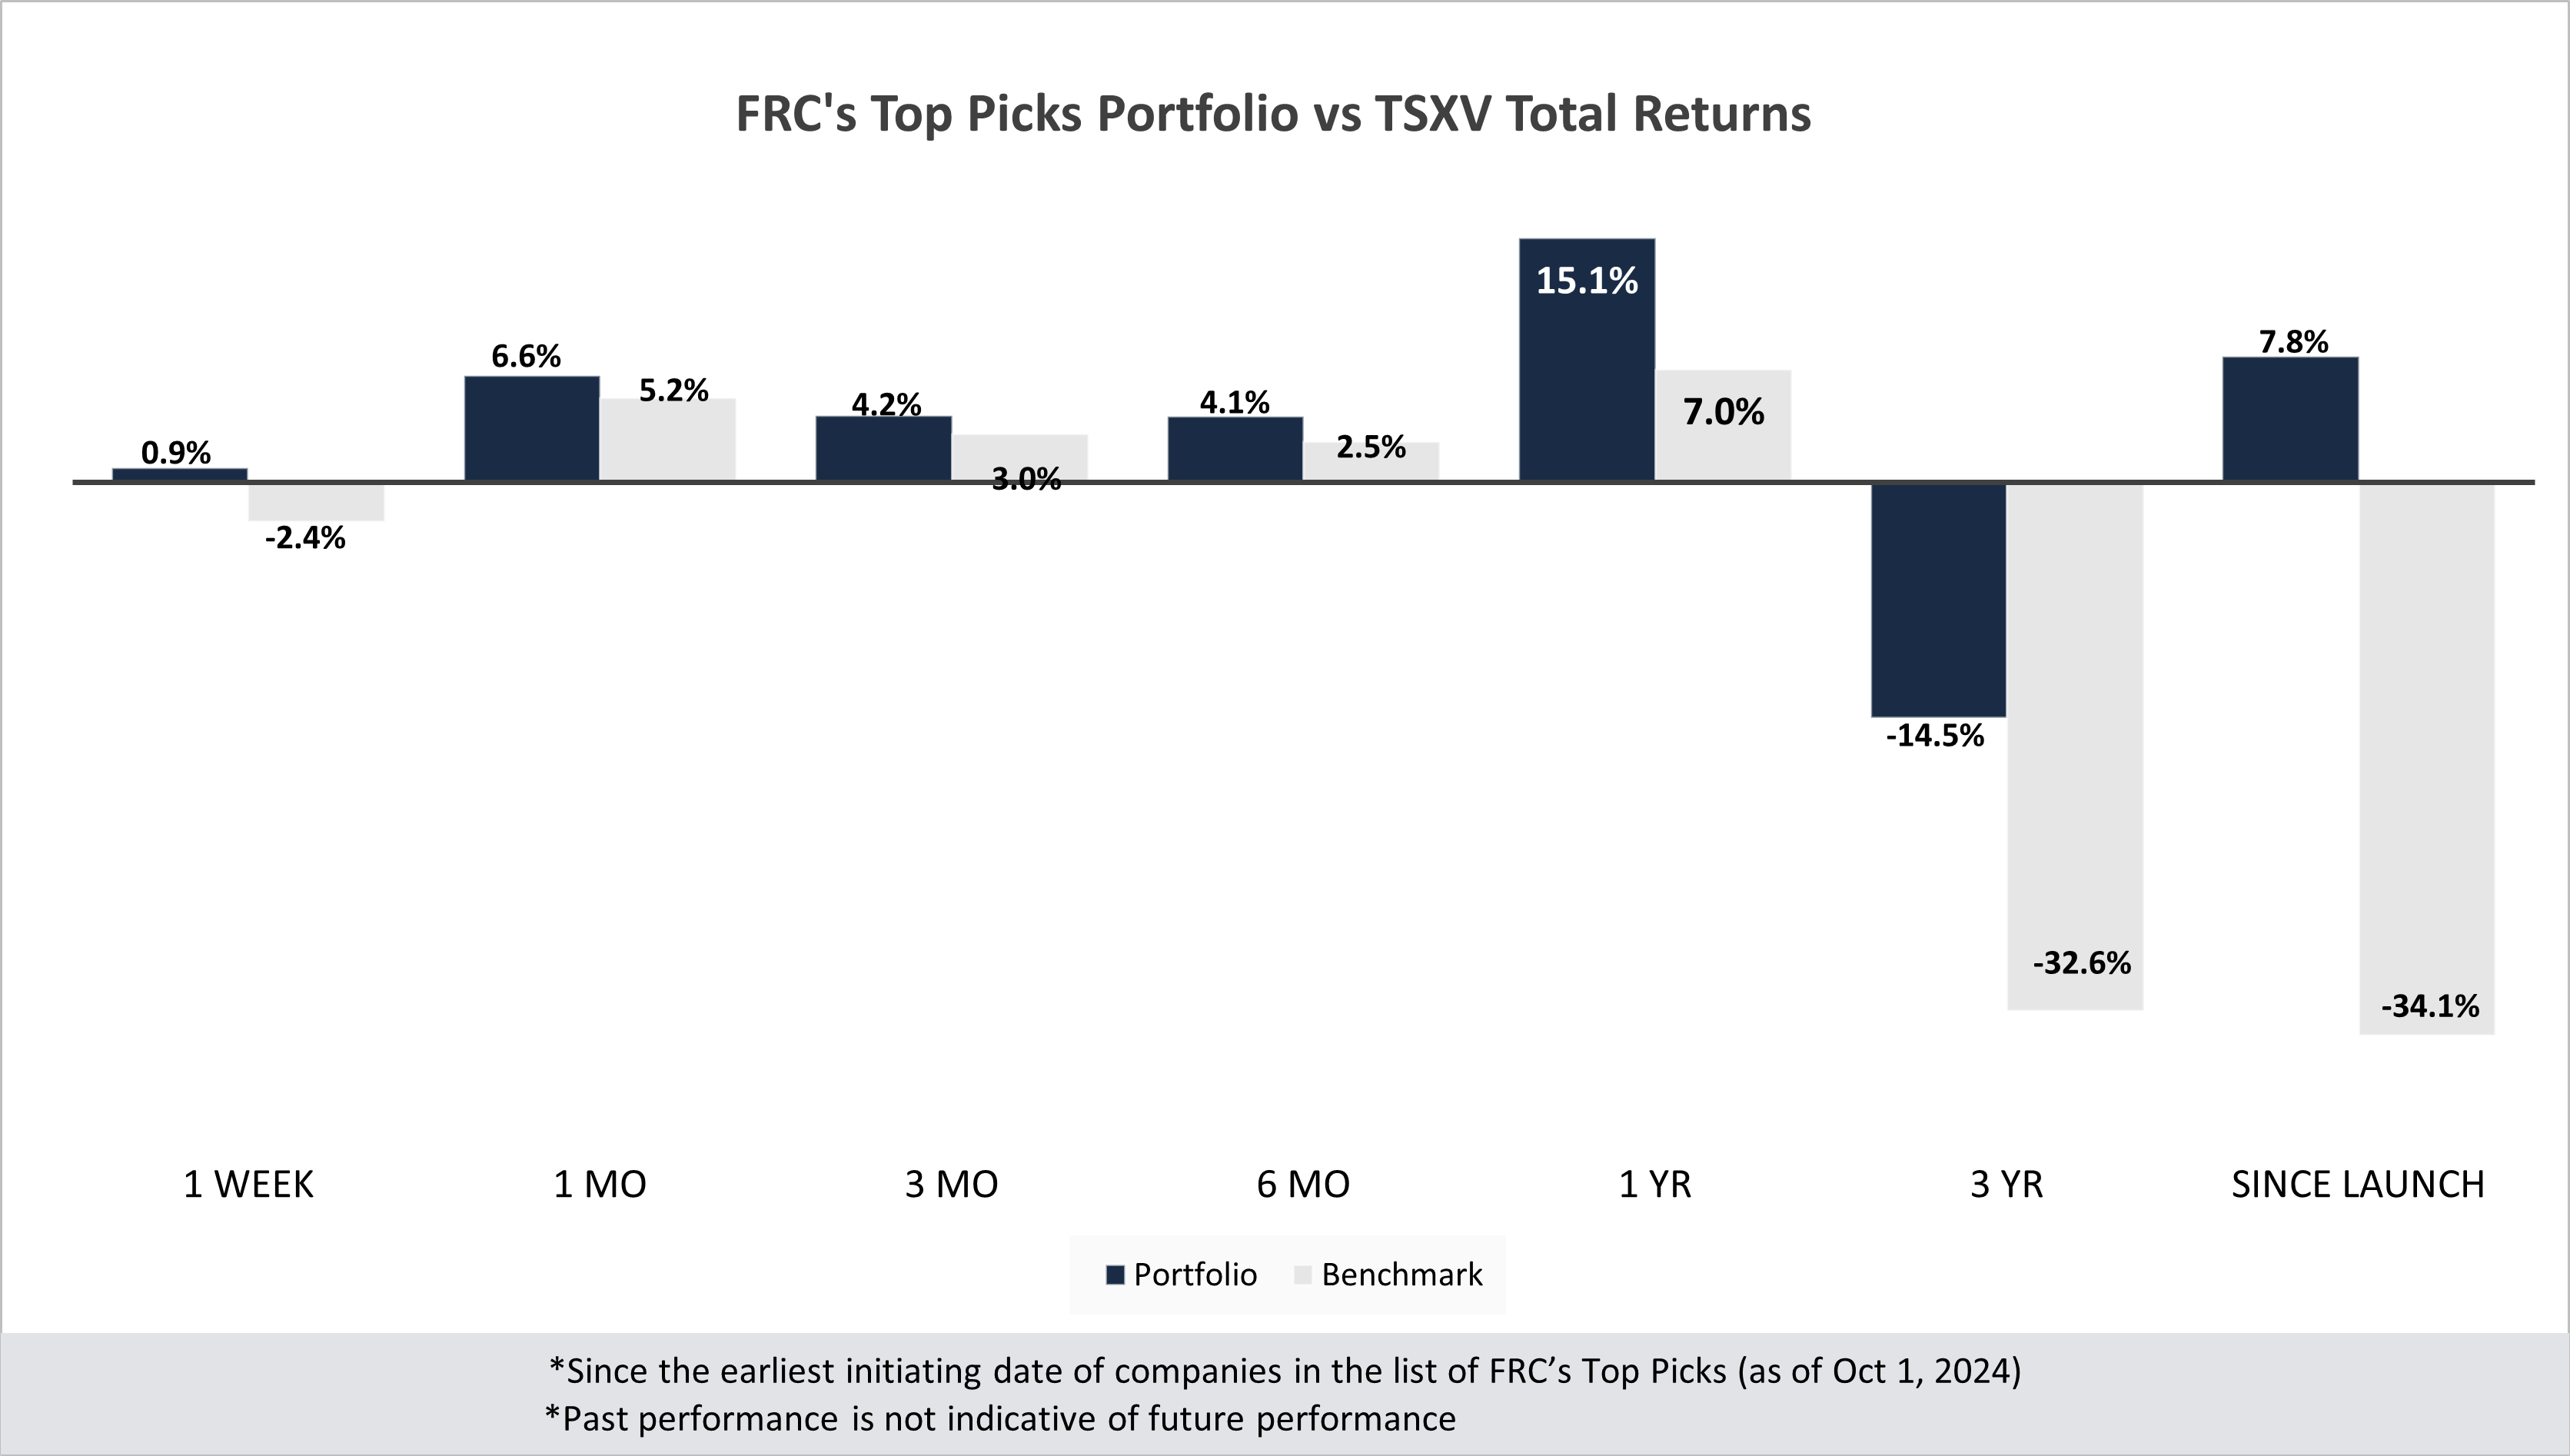
Our top picks have outperformed the benchmark (TSXV) in all seven time periods listed below.
Performance by Sector
| Total Return |
1 Week |
1 mo |
3 mo |
6 mo |
1 yr |
3 yr |
Since launch |
| Mining |
0.5% |
5.5% |
-3.3% |
-0.2% |
8.4% |
-26.2% |
-4.3% |
| Cannabis |
N/A |
N/A |
N/A |
N/A |
N/A |
-37.7% |
-23.6% |
| Tech |
0.0% |
-7.1% |
-13.0% |
-35.0% |
-31.6% |
-37.1% |
-4.7% |
| Special Situations (MIC) |
-1.3% |
11.7% |
29.9% |
36.9% |
62.1% |
-24.3% |
8.5% |
| Private Companies |
N/A |
N/A |
N/A |
N/A |
6.7% |
20.5% |
30.5% |
| Portfolio (Total) |
0.9% |
6.6% |
4.2% |
4.1% |
15.1% |
-14.5% |
7.8% |
| Benchmark (Total) |
-2.4% |
5.2% |
3.0% |
2.5% |
7.0% |
-32.6% |
-34.1% |
| Portfolio (Annualized) |
- |
- |
- |
- |
15.1% |
-5.1% |
0.7% |
| Benchmark (Annualized) |
- |
- |
- |
- |
7.0% |
-12.3% |
-3.8% |
| 1. Since the earliest initiating date of companies in the list of Top Picks (as of Oct 1, 2024) |
|
|
|
|
| 2. Green (blue) indicates FRC's picks outperformed (underperformed) the benchmark. |
|
|
|
|
| 3. Past performance is not indicative of future performance. |
|
|
|
|
|
|
Market Updates and Insights: Mining
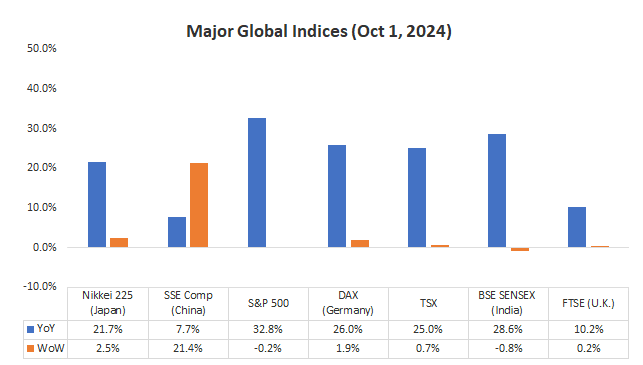
Last week, global equity markets were up 3.7% on average (up 1.5% in the previous week). Notably, the SSE Composite (Shanghai) was up 8% driven by a series of economic stimulus measures, including interest rate cuts, aimed at supporting the country’s struggling real estate market. That said, the S&P 500 dropped 1% today after Iran launched missiles at Israel, escalating tensions in the Middle East. Gold and oil edged higher, with gold currently trading at US$2,670/oz, reaching record highs. We anticipate heightened volatility in the coming days, and suggest that risk-averse investors refrain from active trading.
Source: FRC / Various
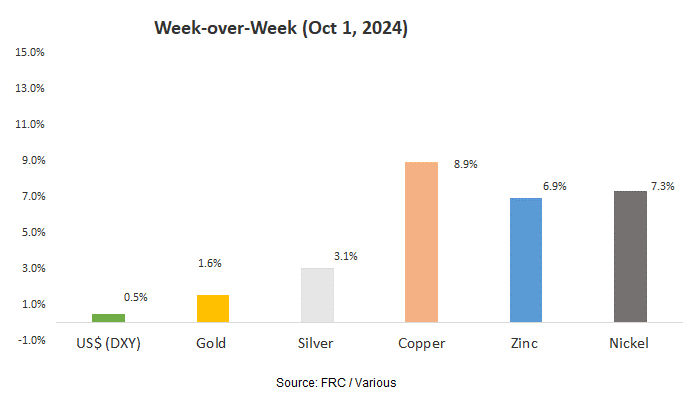
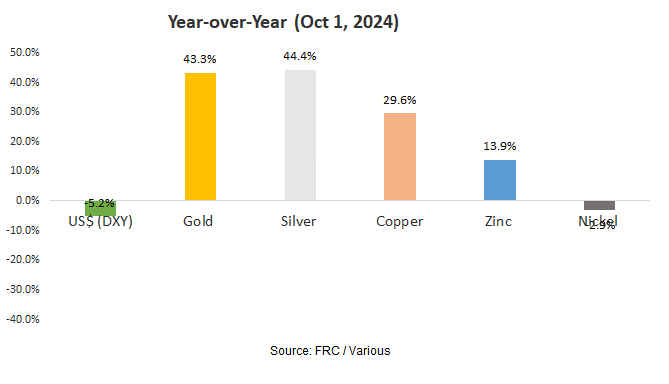
Last week, metal prices were up 5.6% on average (up 0.8% in the previous week).
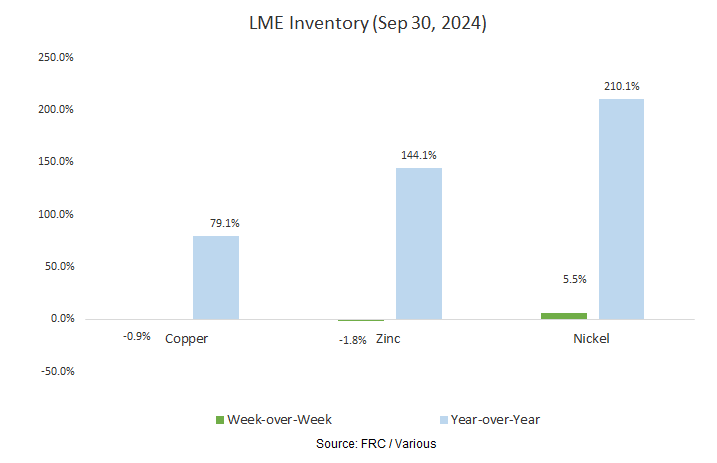
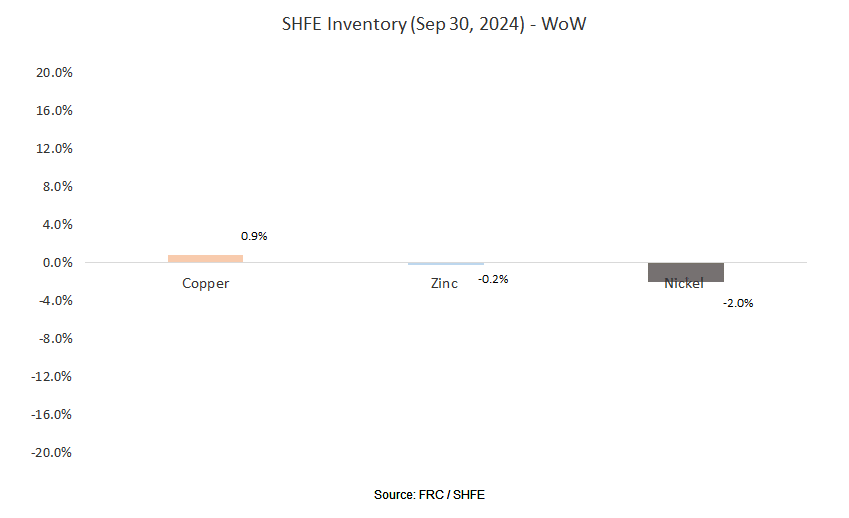
Gold producer valuations were down 3.0% last week (up 0.5% in the prior week); base metal producers were up 7.3% last week (up 4.2% in the prior week). On average, gold producer valuations are 10% lower (previously 7%) than the past three instances when gold surpassed US$2k/oz.
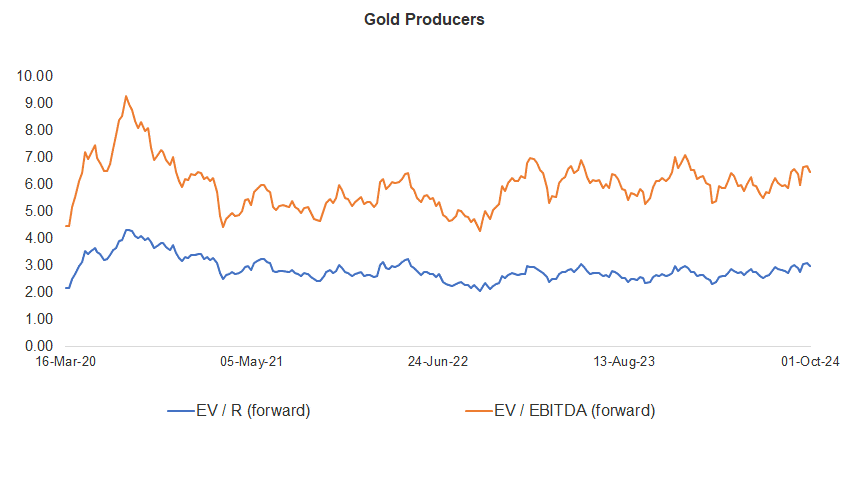
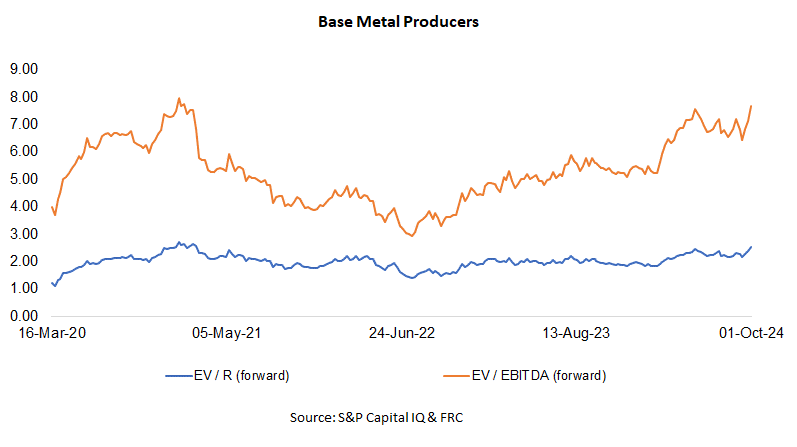
Source: S&P Capital IQ & FRC
| |
|
23-Sep-24 |
01-Oct-24 |
| |
Gold Producers |
EV / R (forward) |
EV / EBITDA (forward) |
EV / R (forward) |
EV / EBITDA (forward) |
| |
|
|
|
|
|
| 1 |
Barrick |
3.42 |
7.00 |
3.35 |
6.87 |
| 2 |
Newmont |
3.82 |
8.40 |
3.75 |
8.33 |
| 3 |
Agnico Eagle |
5.25 |
9.53 |
5.07 |
9.20 |
| 4 |
AngloGold |
2.35 |
5.36 |
2.24 |
5.12 |
| 5 |
Kinross Gold |
2.78 |
5.86 |
2.70 |
5.69 |
| 6 |
Gold Fields |
3.02 |
5.95 |
3.08 |
6.03 |
| 7 |
Sibanye |
0.69 |
4.51 |
0.70 |
4.68 |
| 8 |
Hecla Mining |
5.26 |
14.45 |
5.19 |
14.18 |
| 9 |
B2Gold |
2.15 |
4.35 |
1.93 |
3.71 |
| 10 |
Alamos |
6.36 |
11.92 |
6.01 |
11.08 |
| 11 |
Harmony |
1.64 |
4.54 |
1.63 |
4.52 |
| 12 |
Eldorado Gold |
2.77 |
5.37 |
2.73 |
5.31 |
| |
Average (excl outliers) |
3.07 |
6.67 |
2.98 |
6.47 |
| |
Min |
0.69 |
4.35 |
0.70 |
3.71 |
| |
Max |
6.36 |
14.45 |
6.01 |
14.18 |
| |
|
|
|
|
|
| |
Base Metal Producers |
EV / R (forward) |
EV / EBITDA (forward) |
EV / R (forward) |
EV / EBITDA (forward) |
| |
|
|
|
|
|
| 1 |
BHP Group |
2.91 |
5.47 |
3.25 |
6.13 |
| 2 |
Rio Tinto |
2.18 |
4.88 |
2.39 |
5.35 |
| 3 |
South32 |
1.49 |
5.53 |
1.70 |
6.32 |
| 4 |
Glencore |
0.38 |
5.53 |
0.41 |
6.00 |
| 5 |
Anglo American |
1.84 |
5.57 |
2.01 |
6.12 |
| 6 |
Teck Resources |
3.63 |
8.88 |
3.79 |
9.36 |
| 7 |
First Quantum |
4.20 |
14.20 |
4.25 |
14.57 |
| |
Average (excl outliers) |
2.38 |
7.15 |
2.54 |
7.69 |
| |
Min |
0.38 |
4.88 |
0.41 |
5.35 |
| |
Max |
4.20 |
14.20 |
4.25 |
14.57 |
We are revising our full-year average metal price forecasts after adjusting for prices in Q3; changes are highlighted in red.

Market Updates and Insights: Cryptos
Prices of mainstream/popular cryptos were down 5.7% on average last week (up 5.4% in the previous week).
| October 1, 2024 |
|
|
| Cryptos |
WoW |
YoY |
| Bitcoin |
-5% |
122% |
| Binance Coin |
-8% |
152% |
| Cardano |
-11% |
34% |
| Ethereum |
-5% |
44% |
| Polkadot |
-13% |
-2% |
| XRP |
4% |
17% |
| Polygon |
-7% |
-32% |
| Solana |
0% |
546% |
| Average |
-6% |
110% |
| Min |
-13% |
-32% |
| Max |
4% |
546% |
| |
|
|
| Indices |
| Canadian |
WoW |
YoY |
| BTCC |
-3% |
115% |
| BTCX |
-2% |
117% |
| EBIT |
-2% |
115% |
| FBTC |
-3% |
32% |
| |
|
|
| U.S. |
WoW |
YoY |
| BITO |
-9% |
23% |
| BTF |
-4% |
52% |
| IBLC |
-4% |
74% |
Source: FRC/Yahoo Finance
The global MCAP of cryptos is US$2.33T, up 8% MoM, and 110%YoY.
Total Crypto Market Cap Chart

Source: CoinGecko
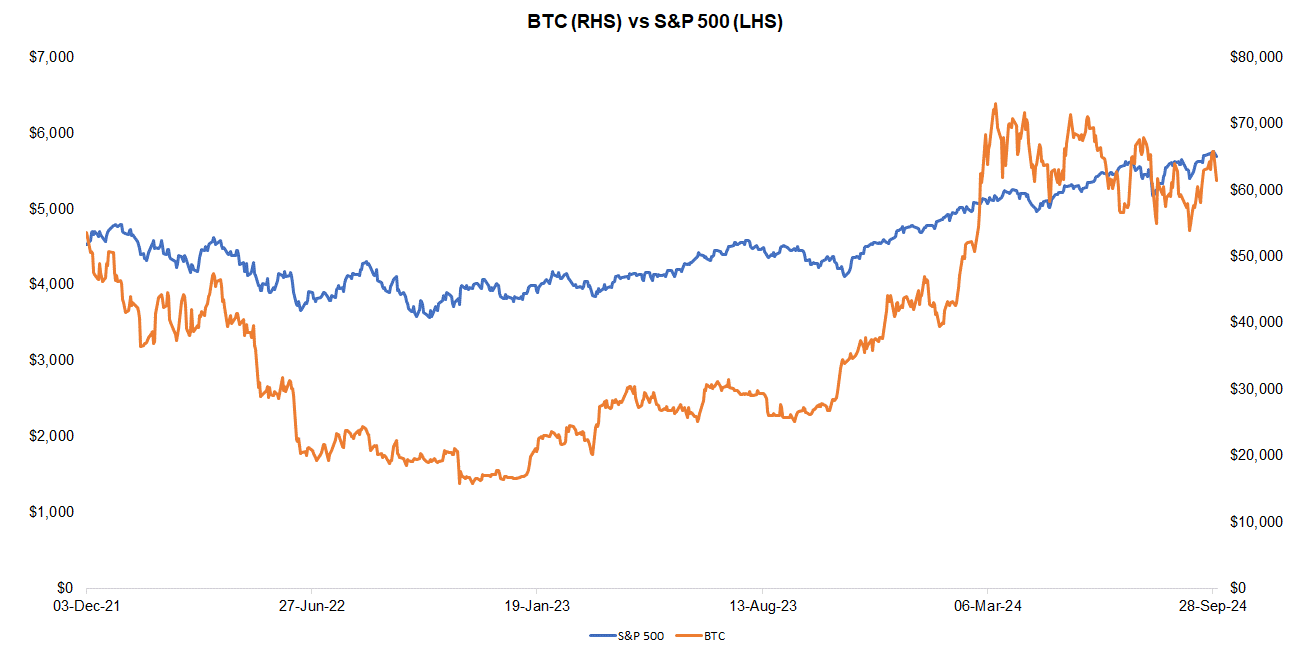
Last week, BTC was down 4.8%, while the S&P 500 was down 0.2%. The U.S. 10-year treasury yield was down 0.02 pp.
Source: FRC/ Yahoo Finance
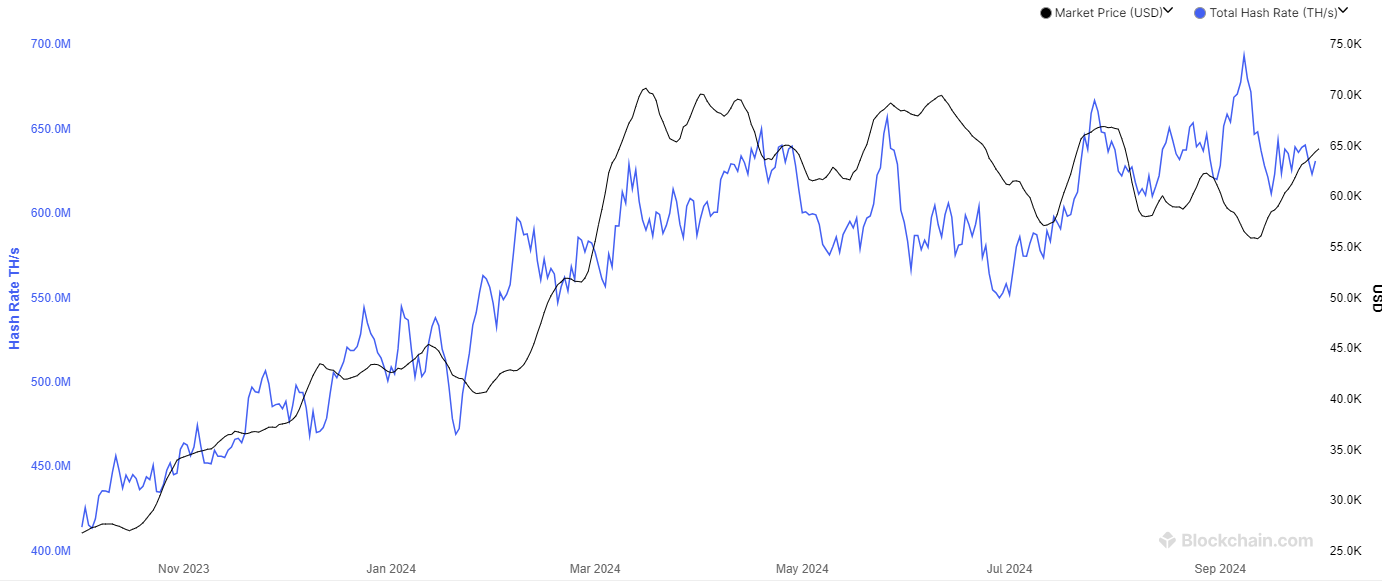
The global hash rate of BTC (defined as calculations performed per second/an indicator of network difficulty) is 631 exahashes per second (EH/s), down 0.8% WoW, but up 0.3% MoM. The decrease in hash rates is positive for miners as their efficiency rates (BTC production per EH/s) are inversely linked to global hash rates.
Total Hash Rate (BTC)
The Realized HODL ratio (RHODL), which gauges the activity of short-term holders relative to long-term holders, was up 1% WoW, and 346% YoY. We interpret the increase in RHODL as a sign of strengthening demand.

Source: FRC/ Various
The table below summarizes the changes in key statistically significant factors influencing BTC prices, including the factors mentioned above. With two positive signals and three negative (compared to four positive and one negative in the previous week), our outlook on near-term BTC prices has shifted from bullish to bearish.
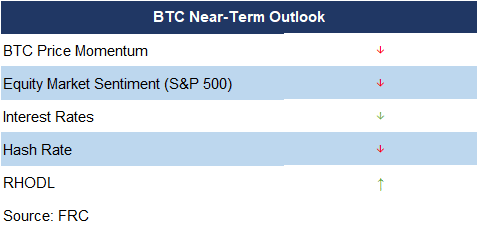
* “↑” and “↓” indicate whether a parameter has increased or decreased
* Red (green) denotes a negative (positive) signal for BTC prices; black implies neutral.
Source: FRC
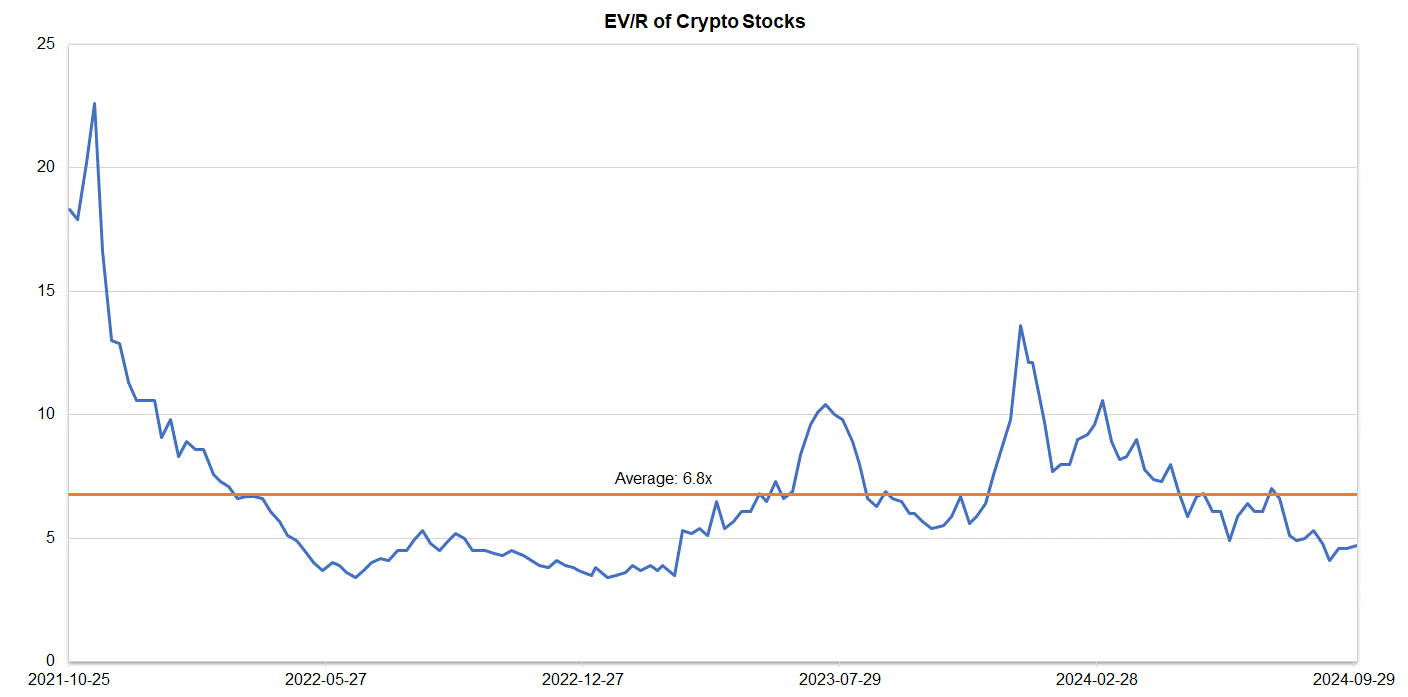
Companies operating in the crypto space are trading at an average EV/R of 4.7x (previously 4.6x).
Source: S&P Capital IQ/FRC
| October 1, 2024 |
|
| Crypto Stocks |
EV/Revenue |
| Argo Blockchain |
2.1 |
| BIGG Digital |
5.0 |
| Bitcoin Well |
0.7 |
| Canaan Inc. |
1.3 |
| CleanSpark Inc. |
6.6 |
| Coinbase Global |
9.2 |
| Galaxy Digital Holdings |
N/A |
| HIVE Digital |
3.0 |
| Hut 8 Mining Corp. |
8.2 |
| Marathon Digital Holdings |
8.6 |
| Riot Platforms |
5.8 |
| SATO Technologies |
1.4 |
| |
|
| Average |
4.7 |
| Median |
5.0 |
| Min |
0.7 |
| Max |
9.2 |
Source: S&P Capital IQ/FRC
Market Updates and Insights: Artificial Intelligence/AI
Major AI indices are up 0.6% WoW on average (up 0.5% in the previous week), and 21% YoY.
| October 1, 2024 |
|
|
| AI Indices |
WoW |
YoY |
| First Trust Nasdaq AI and Robotics ETF |
0.4% |
7% |
| Global X Robotics & AI ETF |
0.2% |
28% |
| Global X AI & Technology ETF |
0.3% |
37% |
| iShares Robotics and AI Multisector ETF |
1.3% |
-3% |
| Roundhill Generative AI & Technology ETF |
0.8% |
36% |
| Average |
0.6% |
21% |
| Min |
0.2% |
-3% |
| Max |
1.3% |
37% |
Source: FRC/Various
The following table highlights some of the most popular large-cap AI stocks. Shares of these companies are down 11% WoW on average (up 2% in the previous week), but up 79% YoY. Their average P/E is 33x (previously 34x) vs the NASDAQ-100 Index’s average of 32x (unchanged).
| AI Stocks |
WoW |
YoY |
P/E |
| Arista Networks |
-1% |
103% |
49.8 |
| Dell Technologies |
-3% |
68% |
21.8 |
| Microsoft Corporation |
-2% |
31% |
36.5 |
| NVIDIA Corp |
-4% |
161% |
51.2 |
| Micron Technology |
6% |
48% |
n/a |
| Palantir Technologies |
-1% |
130% |
n/a |
| Qualcomm |
0% |
49% |
21.7 |
| Super Micro Computer (SMCI) |
-91% |
40% |
20.7 |
| Taiwan Semiconductor Manufacturing |
-3% |
82% |
26.9 |
| Average |
-11% |
79% |
32.7 |
| Median |
-2% |
68% |
26.9 |
| Min |
-91% |
31% |
20.7 |
| Max |
6% |
161% |
51.2 |
Source: FRC/Various
Key Developments:
-
Last week, we mentioned Microsoft’s deal with Constellation Energy (NASDAQ: CEG) to acquire energy from Constellation's Three Mile Island nuclear plant in Pennsylvania to power its data centers in the state. MSFT is also partnering with BlackRock to launch a US$30B fund to invest in AI-focused data centers in the U.S. With the AI revolution and exponential growth in data centers and energy requirements, tech companies are scrambling to secure long-term, stable energy sources. We anticipate that sectors such as uranium will see a significant increase in appetite from investors.
- California-based AI chipmaker Cerebras Systems, aiming to rival Nvidia, is preparing for an initial public offering (IPO) that could raise up to US$1B at a valuation of US$7-US$8B. In 2023, Cerebras's revenue soared 216% to US$79M, implying the IPO values the company at 100x revenue! This really shows how hot AI stocks are with investors right now!


