Updates on Financials, Technology, Energy, and Special Situations Companies Under Coverage
Zepp Health Corportation/NYSE- ZEPP
PR Title: Announces 4:1 share consolidation to adress NYSE non-compliance
Analyst Opinion: Positive - Zepp has announced plans to implement a 4:1 share consolidation, effective this month. This decision comes in response to a non-compliance notice received earlier this year from the NYSE due to the company's shares trading below the US$1/share minimum price requirement. In our previous update, we predicted that the company would likely take such a step.
FRC Top Picks
The following table shows last month’s top five performers among our Top Picks. The top performer, Panoro Minerals, was up 82%. Panoro is advancing multiple copper projects in Peru, including a large copper-gold deposit. We anticipate an updated Preliminary Economic Assessment (PEA) this year.
| Top Five Monthly Performers |
MoM Returns |
| Panoro Minerals (PML.V) |
81.8% |
| Hemostemix Inc. (HEM.V) |
50.0% |
| Southern Silver Exploration Corp. (SSV.V) |
35.0% |
| Zepp Health Corporation (ZEPP) |
26.6% |
| Western Exploration Inc. (WEX.V) |
16.7% |
| * Past performance is not indicative of future performance (as of Sep 9, 2024) |
|
Source: FRC
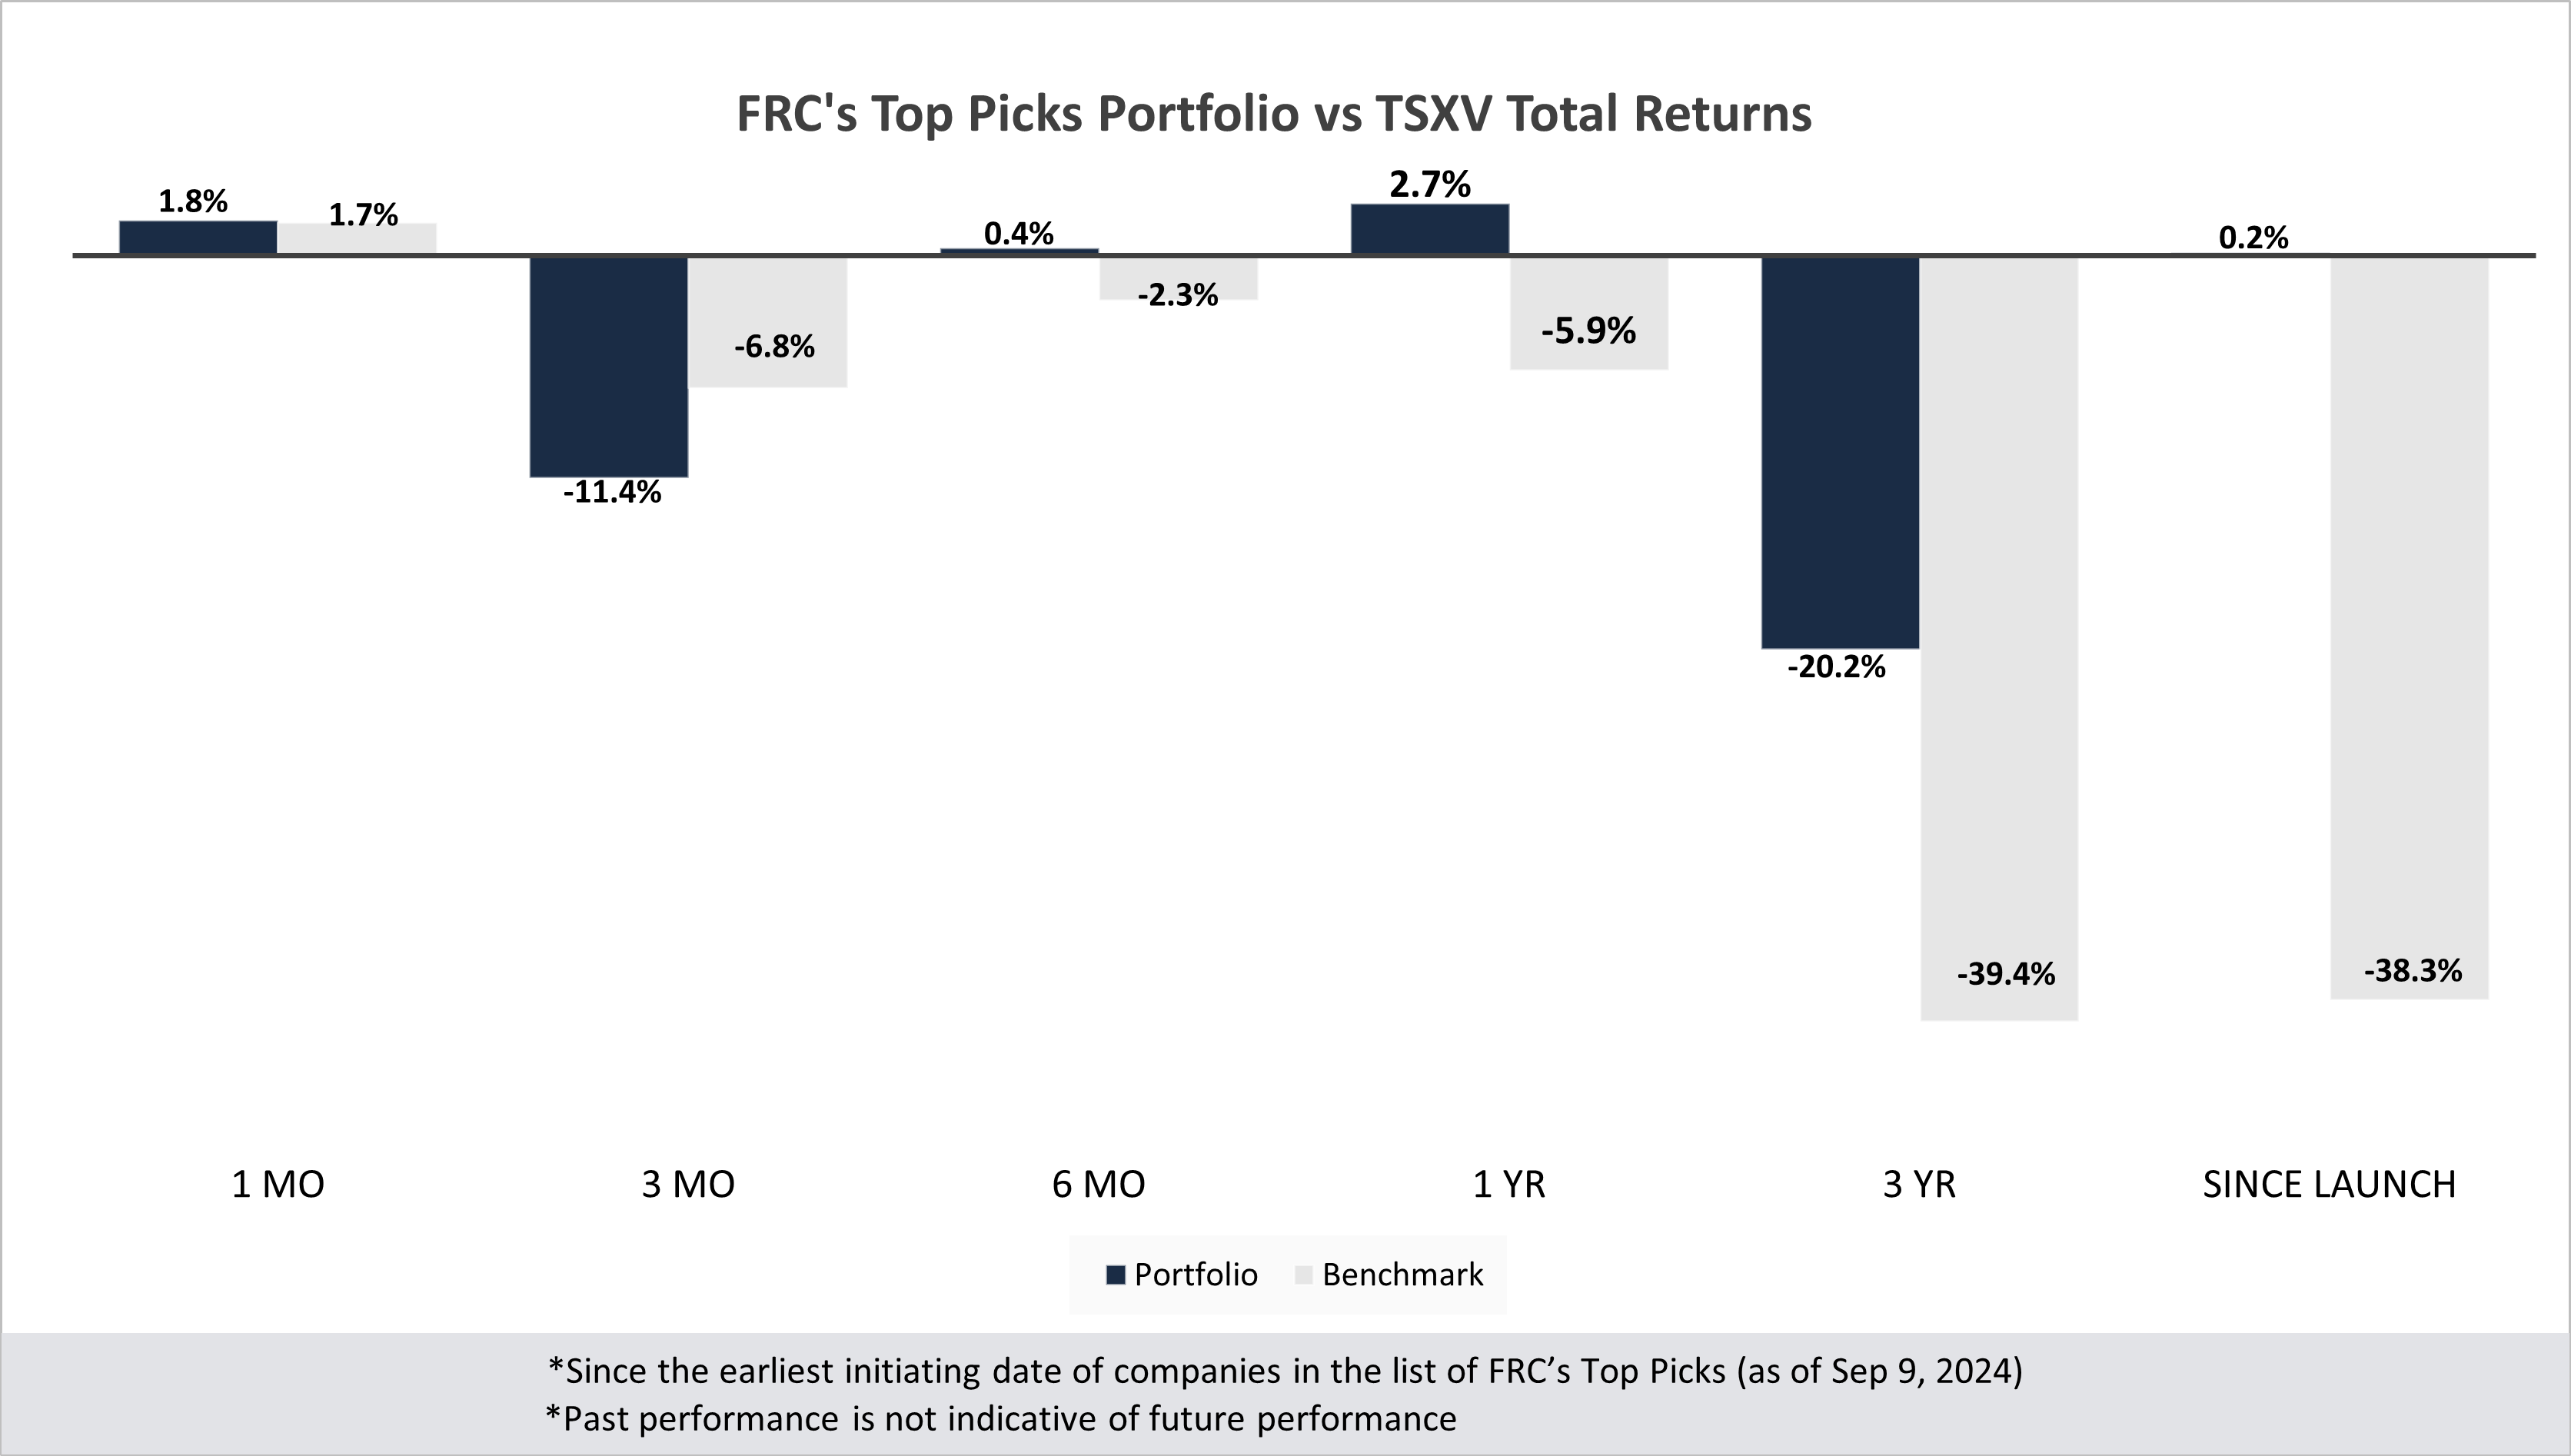
Our top picks have outperformed the benchmark (TSXV) in five out of six time periods listed below.
Performance by Sector
| Total Return |
1 mo |
3 mo |
6 mo |
1 yr |
3 yr |
Since launch |
| Mining |
-0.9% |
-16.7% |
-2.7% |
-7.1% |
-38.2% |
-8.7% |
| Cannabis |
N/A |
N/A |
N/A |
N/A |
-37.5% |
-23.6% |
| Tech |
-17.7% |
-36.0% |
16.7% |
-26.3% |
-36.9% |
-4.6% |
| Special Situations (MIC) |
13.5% |
10.1% |
21.6% |
48.3% |
-23.7% |
-2.2% |
| Private Companies |
N/A |
N/A |
N/A |
6.7% |
20.5% |
30.5% |
| Portfolio (Total) |
1.8% |
-11.4% |
0.4% |
2.7% |
-20.2% |
0.2% |
| Benchmark (Total) |
1.7% |
-6.8% |
-2.3% |
-5.9% |
-39.4% |
-38.3% |
| Portfolio (Annualized) |
- |
- |
- |
2.7% |
-7.3% |
0.0% |
| Benchmark (Annualized) |
- |
- |
- |
-5.9% |
-15.4% |
-4.4% |
| 1. Since the earliest initiating date of companies in the list of Top Picks (as of Sep 9, 2024) |
|
|
|
| 2. Green (blue) indicates FRC's picks outperformed (underperformed) the benchmark. |
|
|
|
| 3. Past performance is not indicative of future performance. |
|
|
|
|
|
Market Updates and Insights: Mining
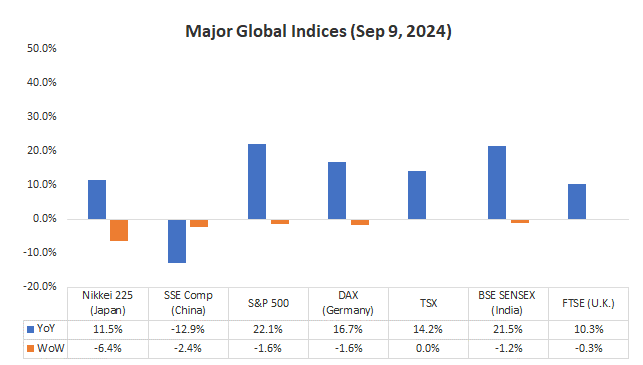
Last week, global equity markets were down 1.9% on average (down 0.2% in the previous week). The S&P 500 declined by 1.6% following weaker than expected jobs data. This week, all eyes are on the upcoming CPI/inflation data, where we anticipate signs of cooling. We expect continued market volatility in the coming weeks until there is more clarity on the frequency and magnitude of the Fed’s rate cuts.
Source: FRC / Various
Last week, metal prices were down 2.7% on average (up 1.4% in the previous week).
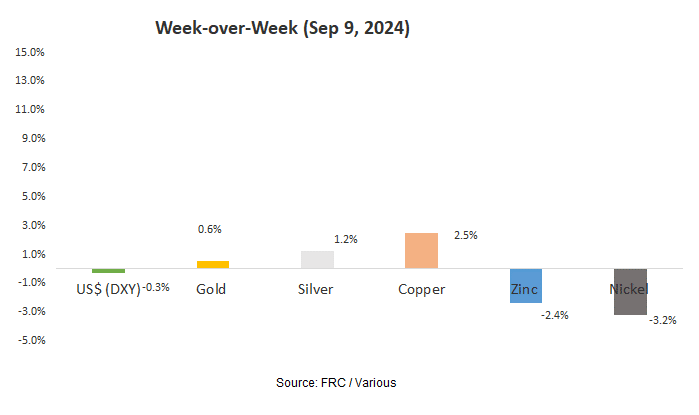
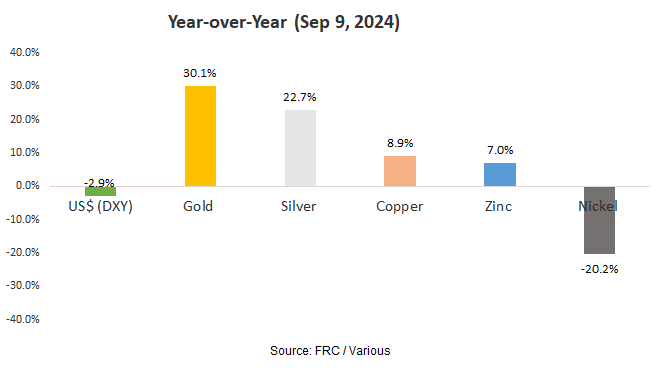
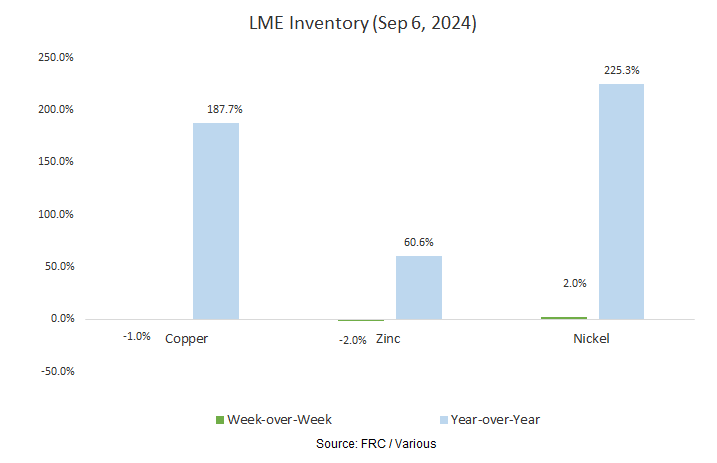
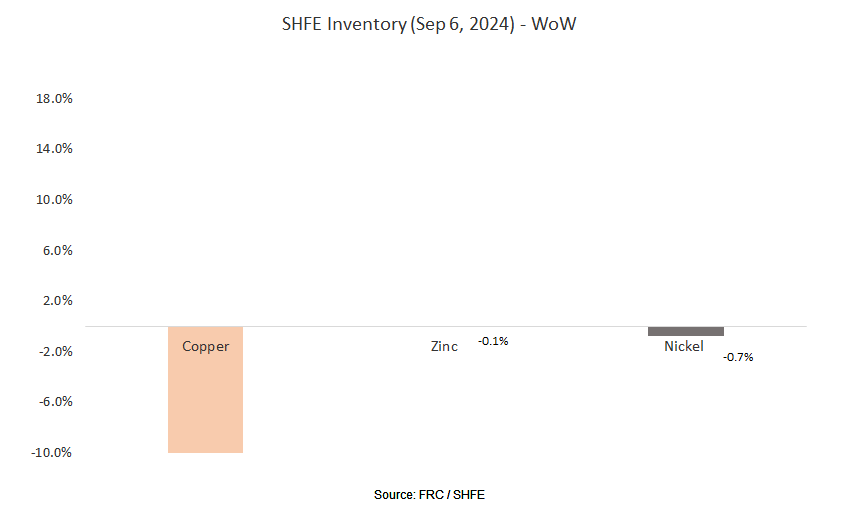
Gold producer valuations were down 6.2% last week (down 2.5% in the prior week); base metal producers were down 5.5% last week (down 3.4% in the prior week). On average, gold producer valuations are 17% lower (previously 11%) than the past three instances when gold surpassed US$2k/oz.
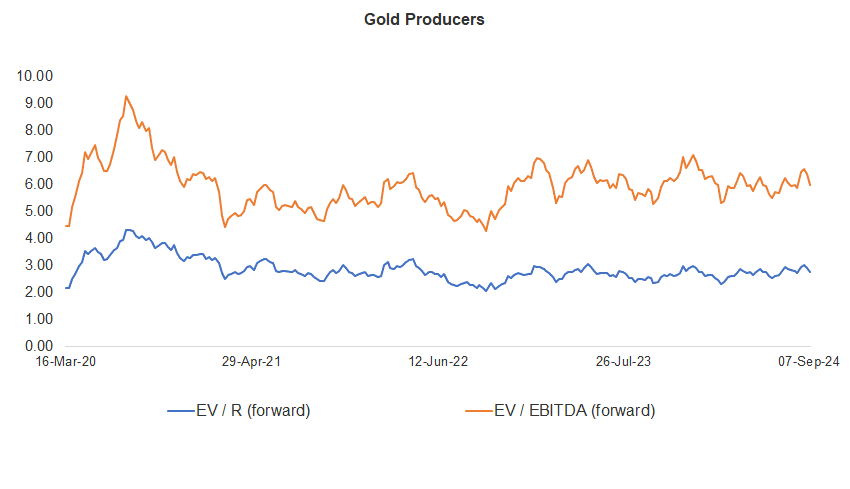
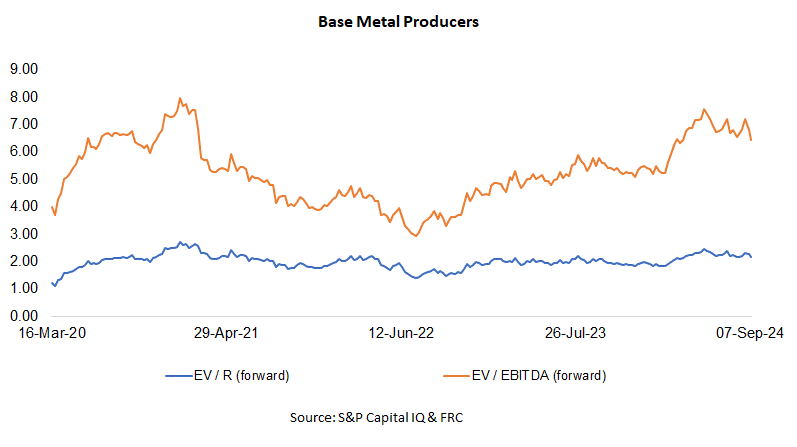
Source: S&P Capital IQ & FRC
| |
|
03-Sep-24 |
09-Sep-24 |
| |
Gold Producers |
EV / R (forward) |
EV / EBITDA (forward) |
EV / R (forward) |
EV / EBITDA (forward) |
| |
|
|
|
|
|
| 1 |
Barrick |
3.36 |
6.88 |
3.22 |
6.56 |
| 2 |
Newmont |
3.76 |
8.47 |
3.56 |
7.95 |
| 3 |
Agnico Eagle |
5.17 |
9.32 |
4.89 |
8.89 |
| 4 |
AngloGold |
2.45 |
5.49 |
2.36 |
5.30 |
| 5 |
Kinross Gold |
2.65 |
5.56 |
2.46 |
5.17 |
| 6 |
Gold Fields |
2.77 |
5.48 |
2.71 |
5.37 |
| 7 |
Sibanye |
0.56 |
3.43 |
0.54 |
3.35 |
| 8 |
Hecla Mining |
4.70 |
13.64 |
4.37 |
12.68 |
| 9 |
B2Gold |
1.75 |
3.59 |
1.65 |
3.38 |
| 10 |
Alamos |
5.79 |
10.96 |
5.53 |
10.32 |
| 11 |
Harmony |
1.65 |
5.47 |
1.40 |
4.13 |
| 12 |
Eldorado Gold |
2.72 |
5.27 |
2.50 |
4.85 |
| |
Average (excl outliers) |
2.92 |
6.40 |
2.75 |
5.97 |
| |
Min |
0.56 |
3.43 |
0.54 |
3.35 |
| |
Max |
5.79 |
13.64 |
5.53 |
12.68 |
| |
|
|
|
|
|
| |
Base Metal Producers |
EV / R (forward) |
EV / EBITDA (forward) |
EV / R (forward) |
EV / EBITDA (forward) |
| |
|
|
|
|
|
| 1 |
BHP Group |
2.78 |
5.10 |
2.70 |
4.93 |
| 2 |
Rio Tinto |
2.02 |
4.45 |
2.00 |
4.41 |
| 3 |
South32 |
1.51 |
5.03 |
1.38 |
4.77 |
| 4 |
Glencore |
0.37 |
5.31 |
0.36 |
5.15 |
| 5 |
Anglo American |
1.78 |
5.33 |
1.73 |
5.19 |
| 6 |
Teck Resources |
3.54 |
8.62 |
3.34 |
8.16 |
| 7 |
First Quantum |
3.98 |
13.73 |
3.58 |
12.37 |
| |
Average (excl outliers) |
2.28 |
6.80 |
2.16 |
6.43 |
| |
Min |
0.37 |
4.45 |
0.36 |
4.41 |
| |
Max |
3.98 |
13.73 |
3.58 |
12.37 |
We are maintaining our metal price forecasts.

Market Updates and Insights: Cryptos
Prices of mainstream/popular cryptos were down 1% on average last week (down 7% in the previous week).
| September 9, 2024 |
|
|
| Cryptos |
WoW |
YoY |
| Bitcoin |
-3% |
117% |
| Binance Coin |
2% |
141% |
| Cardano |
6% |
35% |
| Ethereum |
-5% |
43% |
| Polkadot |
3% |
1% |
| XRP |
-5% |
6% |
| Polygon |
-6% |
-29% |
| Solana |
0% |
585% |
| Average |
-1% |
112% |
| Min |
-6% |
-29% |
| Max |
6% |
585% |
| |
|
|
| Indices |
| Canadian |
WoW |
YoY |
| BTCC |
-4% |
119% |
| BTCX |
-4% |
124% |
| EBIT |
-4% |
123% |
| FBTC |
-4% |
21% |
| |
|
|
| U.S. |
WoW |
YoY |
| BITO |
-4% |
34% |
| BTF |
-6% |
58% |
| IBLC |
-9% |
46% |
Source: FRC/Yahoo Finance
The global MCAP of cryptos is US$2T, down 11% MoM, but up 83%YoY.
Total Crypto Market Cap Chart

Source: CoinGecko
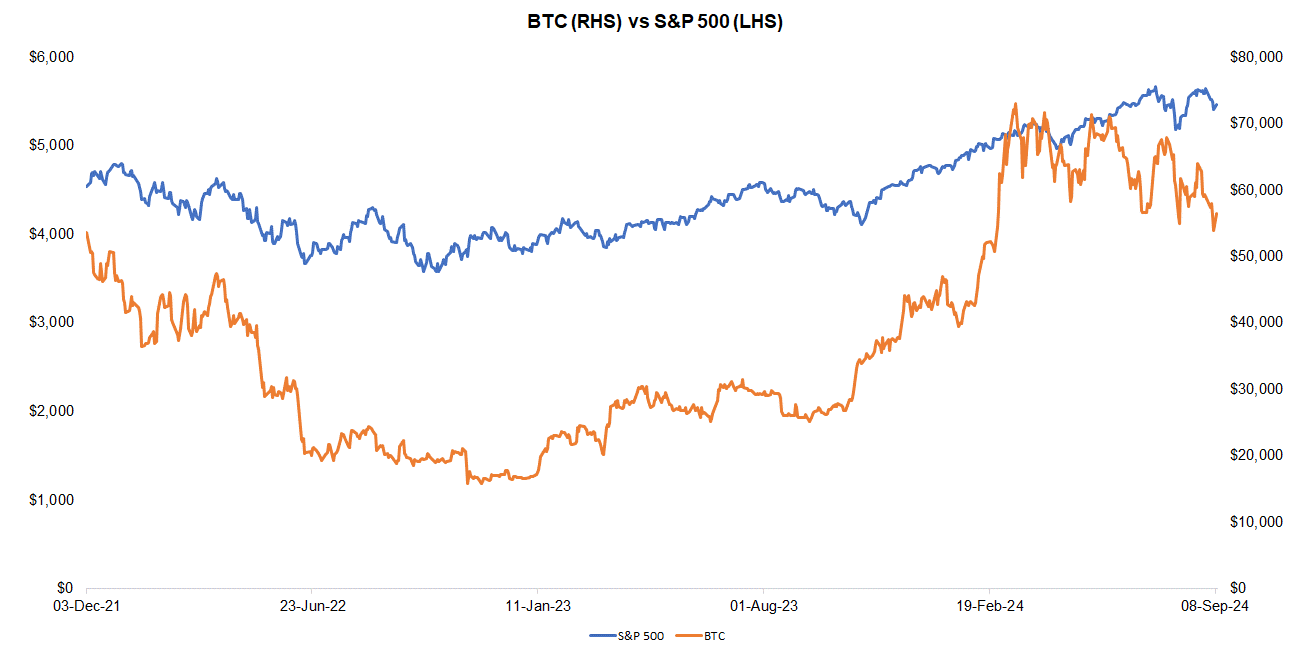
Last week, BTC was down 2.6%, while the S&P 500 was down 1.6%. The U.S. 10-year treasury yield was down 0.15 pp.
Source: FRC/ Yahoo Finance
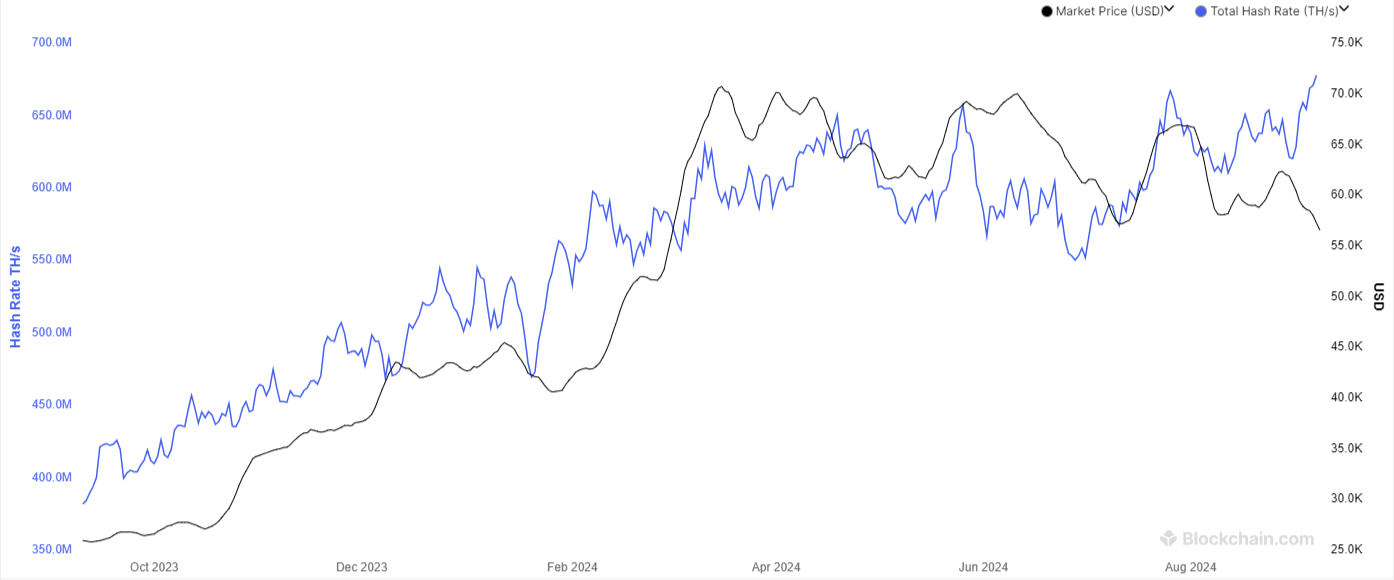
The global hash rate of BTC (defined as calculations performed per second/an indicator of network difficulty) is 678 exahashes per second (EH/s), up 8% WoW, and 11% MoM. The increase in hash rates is negative for miners as their efficiency rates (BTC production per EH/s) are inversely linked to global hash rates.
Total Hash Rate (BTC)
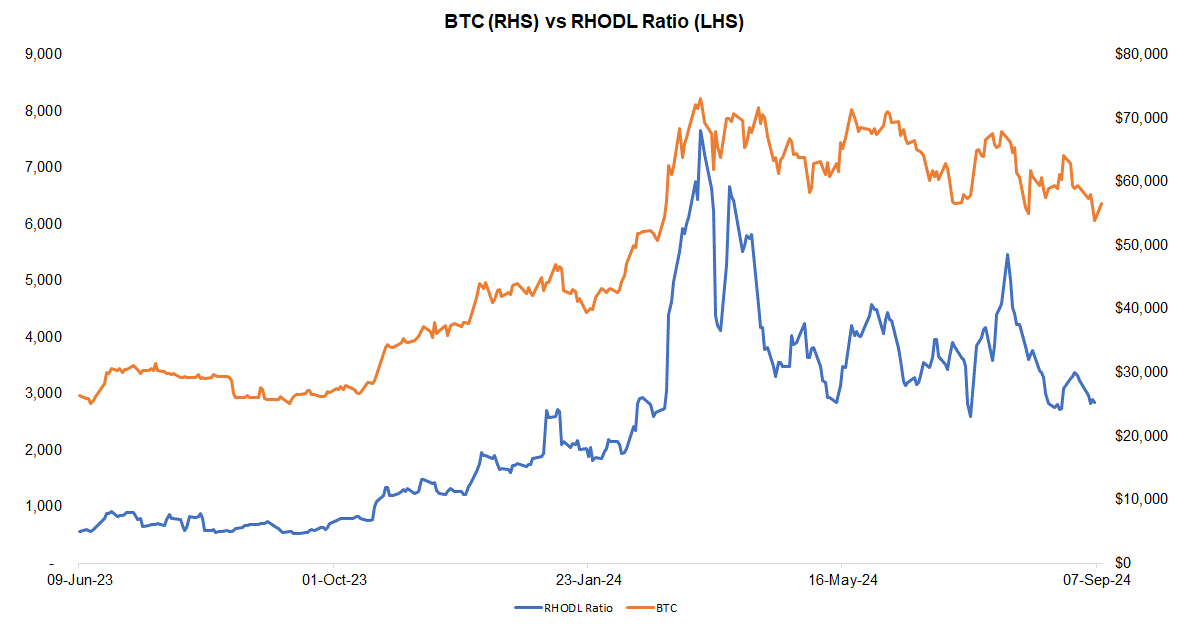
The Realized HODL ratio (RHODL), which gauges the activity of short-term holders relative to long-term holders, was down 14% WoW, but up 358% YoY. We interpret the decrease in RHODL as a sign of weakening demand.
Source: FRC/ Various
The table below summarizes the changes in key statistically significant factors influencing BTC prices, including the factors previously mentioned above. With three negative signals and two positive (compared to four negative and one positive in the previous week), our near-term outlook for BTC prices remains weak. Our model accurately predicted last week’s decline in prices.
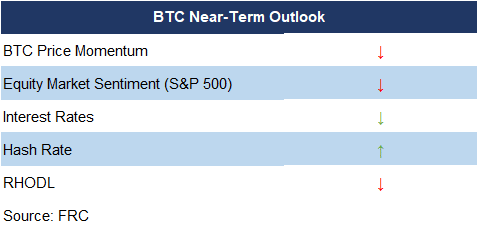 * “↑” and “↓” indicate whether a parameter has increased or decreased
* Red (green) denotes a negative (positive) signal for BTC prices; black implies neutral.
Source: FRC
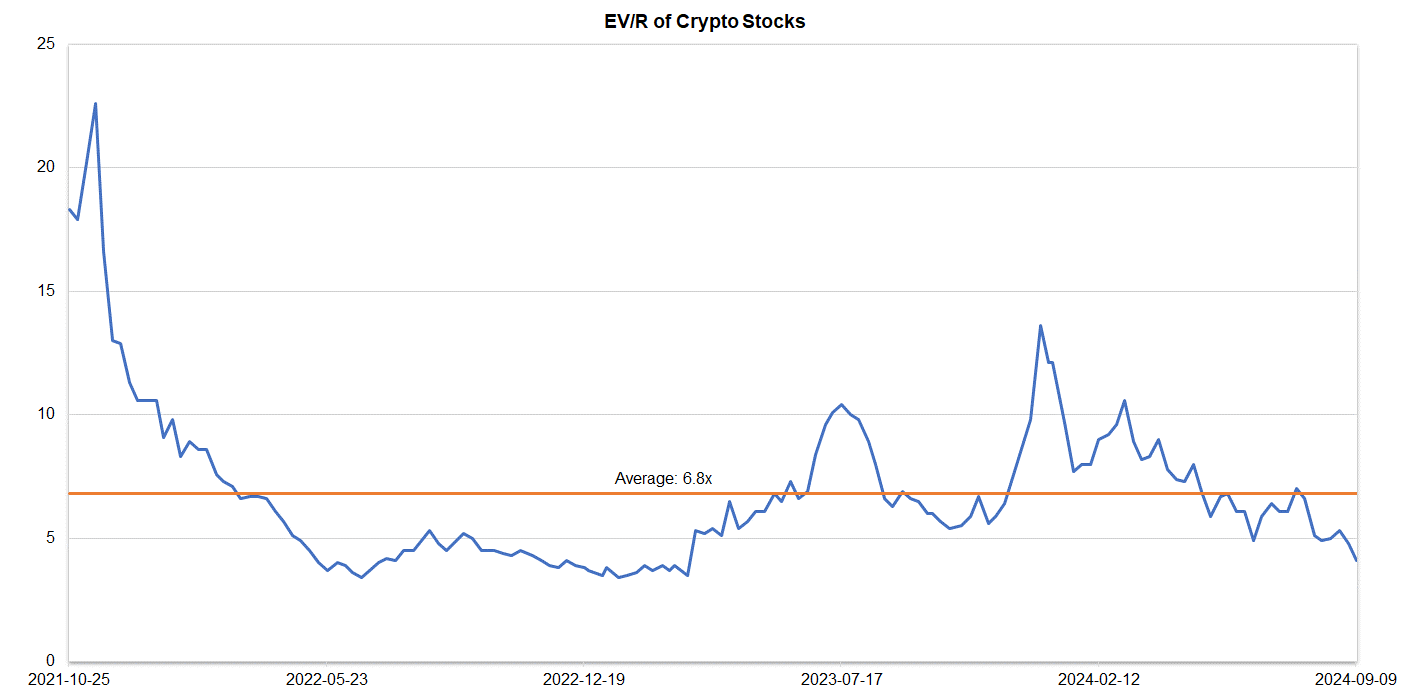
Companies operating in the crypto space are trading at an average EV/R of 4.1x (previously 4.8x).
Source: S&P Capital IQ/FRC
| September 9, 2024 |
|
| Crypto Stocks |
EV/Revenue |
| Argo Blockchain |
2.1 |
| BIGG Digital |
3.9 |
| Bitcoin Well |
0.7 |
| Canaan Inc. |
1.0 |
| CleanSpark Inc. |
5.6 |
| Coinbase Global |
7.5 |
| Galaxy Digital Holdings |
N/A |
| HIVE Digital |
2.4 |
| Hut 8 Mining Corp. |
8.2 |
| Marathon Digital Holdings |
7.1 |
| Riot Platforms |
4.7 |
| SATO Technologies |
1.4 |
| |
|
| Average |
4.1 |
| Median |
3.9 |
| Min |
0.7 |
| Max |
8.2 |
Source: S&P Capital IQ/FRC
Market Updates and Insights: Artificial Intelligence/AI
Major AI indices are down 4% WoW on average (down 3% in the previous week), but up 8% YoY.
| September 9, 2024 |
|
|
| AI Indices |
WoW |
YoY |
| First Trust Nasdaq AI and Robotics ETF |
-5% |
-5% |
| Global X Robotics & AI ETF |
-5% |
13% |
| Global X AI & Technology ETF |
-5% |
19% |
| iShares Robotics and AI Multisector ETF |
1% |
-3% |
| Roundhill Generative AI & Technology ETF |
-5% |
16% |
| Average |
-4% |
8% |
| Min |
-5% |
-5% |
| Max |
1% |
19% |
Source: FRC/Various
The following table highlights some of the most popular large-cap AI stocks. Shares of these companies are down 3% WoW on average (down 5% in the previous week), but up 63% YoY. Their average P/E is 29.6x (previously 35.5x) vs the NASDAQ-100 Index’s average of 30x (previously 31x).
| AI Stocks |
WoW |
YoY |
P/E |
| Arista Networks |
-8% |
67% |
40.8 |
| Dell Technologies |
-8% |
47% |
18.8 |
| Microsoft Corporation |
-3% |
19% |
34.0 |
| NVIDIA Corp |
-9% |
133% |
48.2 |
| Micron Technology |
-8% |
23% |
n/a |
| Palantir Technologies |
10% |
118% |
n/a |
| Qualcomm |
7% |
45% |
20.2 |
| Super Micro Computer (SMCI) |
-5% |
47% |
19.2 |
| Taiwan Semiconductor Manufacturing |
-5% |
68% |
25.8 |
| Average |
-3% |
63% |
29.6 |
| Median |
-5% |
47% |
25.8 |
| Min |
-9% |
19% |
18.8 |
| Max |
10% |
133% |
48.2 |
Source: FRC/Various
Key Developments:
- Safe Superintelligence (SSI), a new AI startup founded by an OpenAI co-founder has raised US$1B in just three months after its launch. SSI is focused on developing safe and smart technologies that can potentially surpass human intelligence. The latest financing, led by venture capital firms Sequoia and Andreessen Horowitz, values the company at around US$5B. We believe this significant funding underscores the growing interest and investment in AI technologies.


