NVIDIA Sell-Off / Intensifying Trade Tensions / Lithium's Looming Revival
Published: 9/3/2024
Author: FRC Analysts

Key Highlights
-
Last week, metals prices and the S&P 500 retreated amid a stronger US$. We expect continued market volatility in the coming weeks.
- Equity markets were also impacted by a sell-off in NVIDIA (NASDAQ: NVDA) following a U.S. Department of Justice subpoena for potential antitrust violations.
- Shares of a gold junior under coverage were up 15% last week
- The lithium sector faced two major setbacks last week.
- Trade tensions between China and the West intensified, with Canada imposing a 100% tariff on electric vehicles, and a 25% tariff on steel and aluminum.
North Peak Resources Ltd. (BTLLF, NPR.V)
PR Title: Additional results from a 27-hole surface drilling program on the Prospect Mountain Property in Eureka, Nevada
Analyst Opinion: Positive – Drilling continues to return high grades over long intervals, including 18.3 m of 3.92 g/t Au, and 18.3 m of 1.3 g/t. Prospect Mountain is a historic gold-silver-lead producer, directly bordering i-80 Gold’s (TSX: IAU) Ruby Hill project, which hosts a large gold-silver resource.
Equity Metals Corporation (EQMEF, EQTY.V)
PR Title: Intersects bonanza silver and gold on the Camp deposit and the George Lake target at the Silver Queen project, B.C.
Analyst Opinion: Positive – Drilling intersected exceptionally high grades of up to 7,532 AgEq (Camp), and 4,512 g/t (George Lake), confirming resource expansion potential of the Silver Queen project. The property features high-grade epithermal veins, with four of the 20 known veins hosting 85 Moz at 6.2 g/t AgEq.
NV Gold Corporation (NVGLF, NVX.V)
PR Title: Identifies drill targets at the Oasis gold-copper project (Nevada)
Analyst Opinion: Positive – A review of historic drill holes outlined an exploration target spanning 2.3 km in length and 0.5 km in width, with potential to host 17-19 Mt, grading 0.25-0.425 g/t, containing 130-260 Koz gold. Management intends to undertake infill and step-out drilling ahead of completing a maiden resource estimate. Should the company confirm this resource, we estimate the project could be valued at $6M, using the sector average EV/oz of $32. NVX’s current MCAP is just $2.4M.
FRC Top Picks
The following table shows last week’s top five performers among our Top Picks. The top performer, Starcore International Mines, was up 15%. Starcore owns a gold mine in Mexico, and exploration projects in West Africa and B.C.
| Top Five Weekly Performers | WoW Returns |
| Starcore International Mines Ltd. (SAM.TO) | 15.0% |
| Transition Metals Corp.(XTM.V) | 14.3% |
| Panoro Minerals (PML.V) | 12.5% |
| Enterprise Group, Inc. (E.TO) | 8.4% |
| Lake Resources NL (LKE.AX) | 8.1% |
| * Past performance is not indicative of future performance (as of Sep 3, 2024) |
Source: FRC
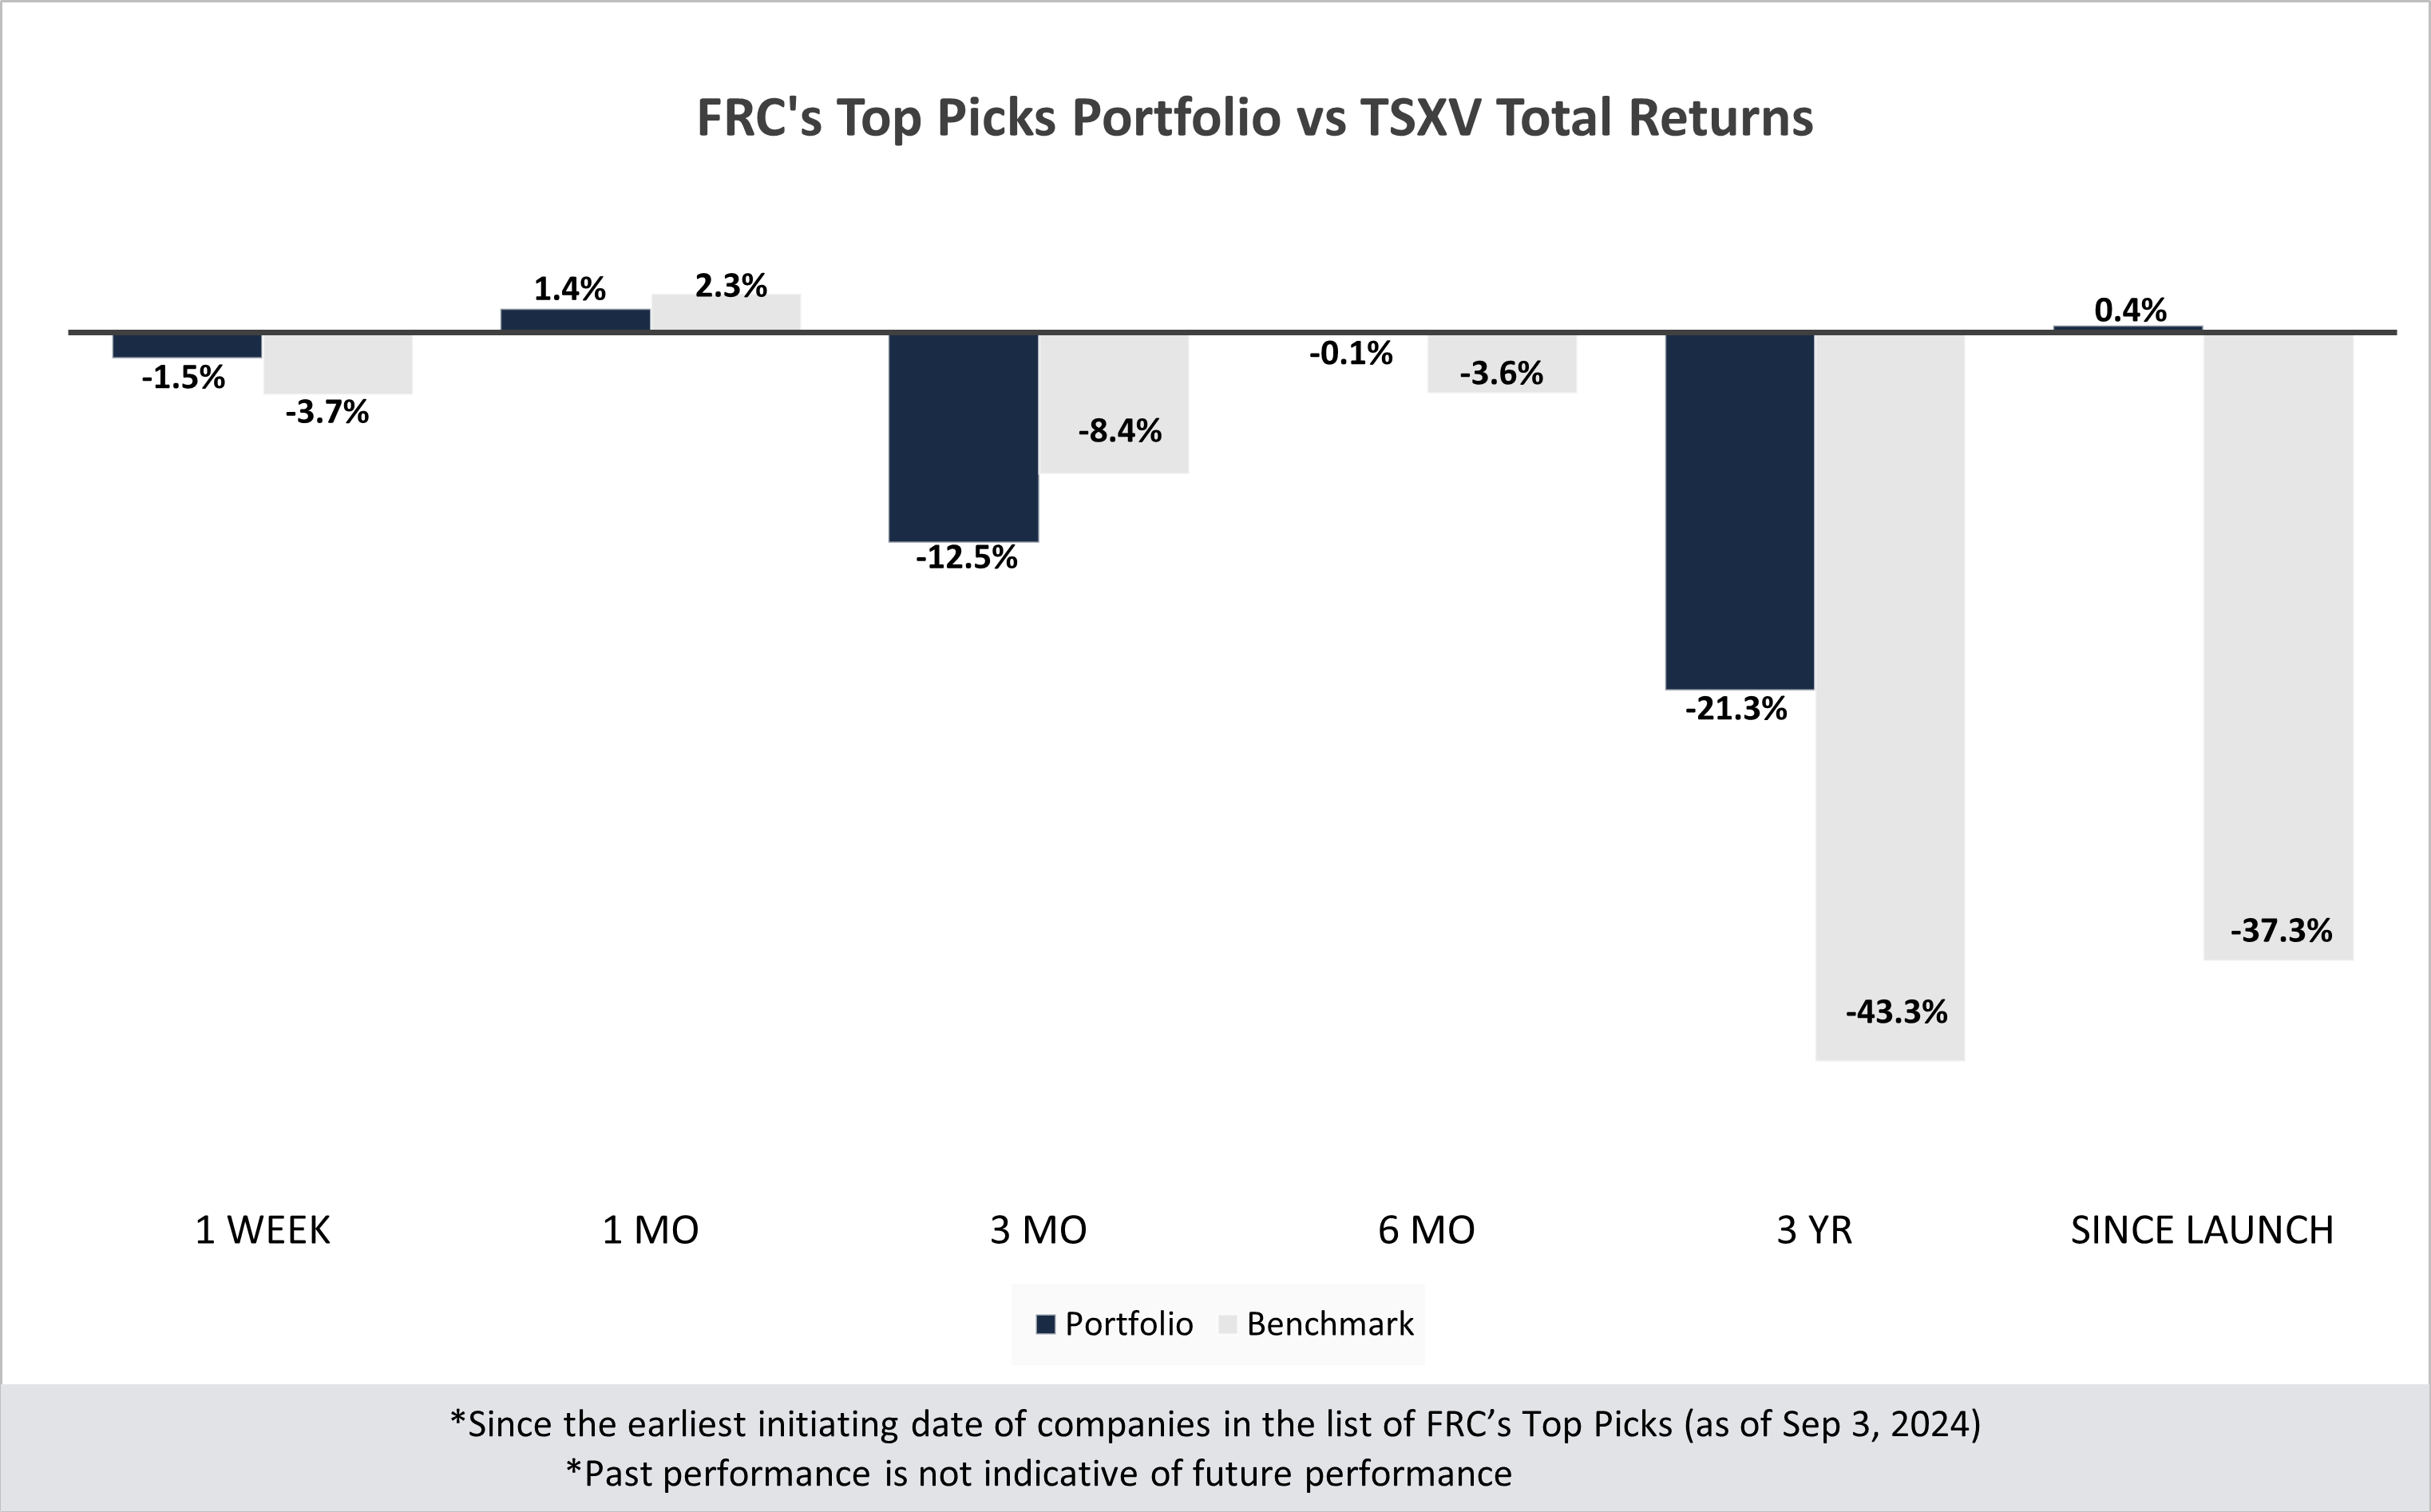
Last week, companies on our Top Picks list were down 1.5% on average vs -3.7% for the benchmark (TSXV).
Performance by Sector
| Total Return | 1 Week | 1 mo | 3 mo | 6 mo | 3 yr | Since launch |
| Mining | -3.4% | -2.6% | -17.6% | -1.0% | -39.4% | -8.0% |
| Cannabis | N/A | N/A | N/A | N/A | -39.4% | -23.6% |
| Tech | -6.9% | -15.6% | -44.0% | -15.6% | -39.6% | -4.6% |
| Special Situations (MIC) | 7.4% | 14.6% | 11.8% | 16.2% | -24.2% | -2.6% |
| Private Companies | N/A | N/A | N/A | N/A | 20.5% | 30.5% |
| Portfolio (Total) | -1.5% | 1.4% | -12.5% | -0.1% | -21.3% | 0.4% |
| Benchmark (Total) | -3.7% | 2.3% | -8.4% | -3.6% | -43.3% | -37.3% |
| Portfolio (Annualized) | - | - | - | - | -7.7% | 0.0% |
| Benchmark (Annualized) | - | - | - | - | -17.2% | -4.3% |
| 1. Since the earliest initiating date of companies in the list of Top Picks (as of Sep 3, 2024) | ||||||
| 2. Green (blue) indicates FRC's picks outperformed (underperformed) the benchmark. | ||||||
|
3. Past performance is not indicative of future performance. 4. Our complete list of top picks (updated weekly) can be viewed here: Top Picks List. |
||||||
Market Updates and Insights: Mining
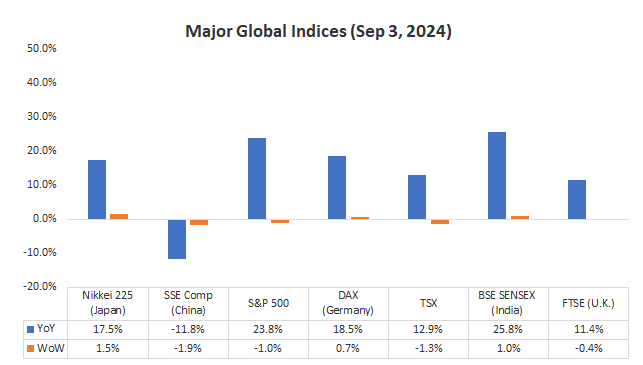
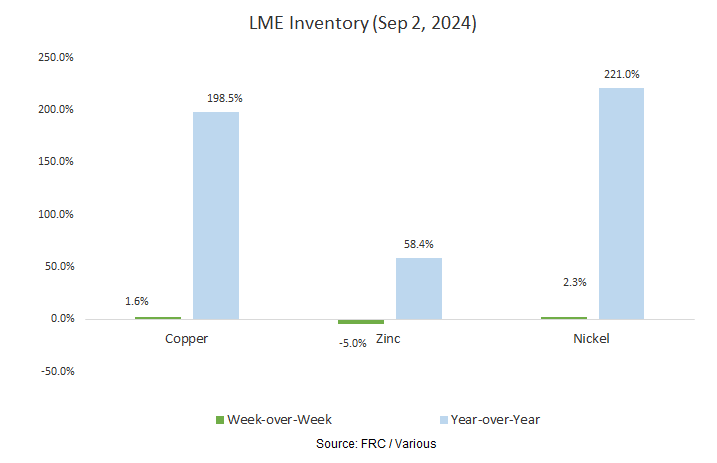
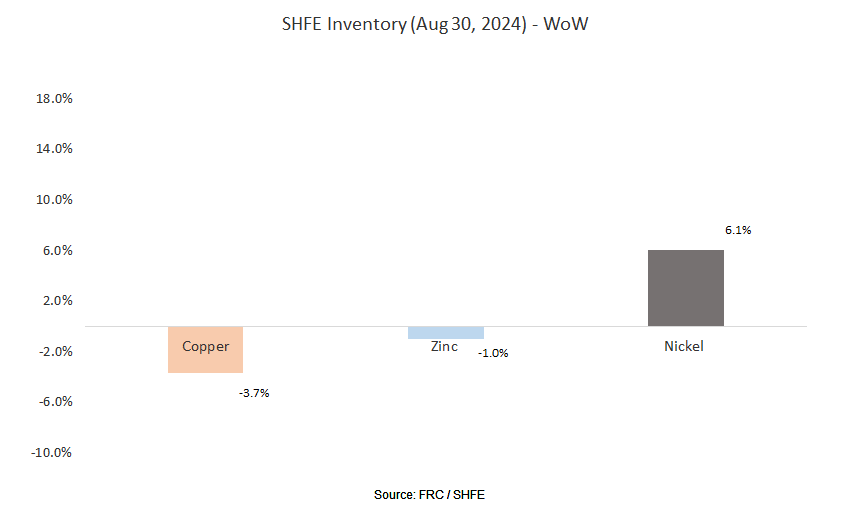
Last week, global equity markets were down 0.2% on average (up 0.6% in the previous week). The S&P 500 declined 1%, and metal prices retreated amid a stronger US$. We expect continued market volatility in the coming weeks until there is more clarity on the frequency and magnitude of the Fed’s rate cuts. We remain confident that the Fed will begin cutting rates in Q4.
Source: FRC / Various
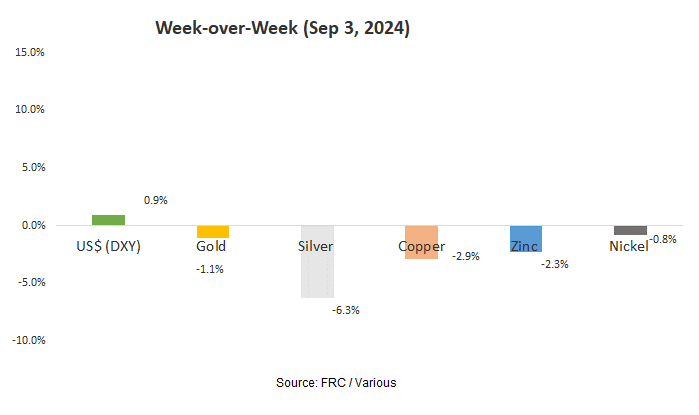
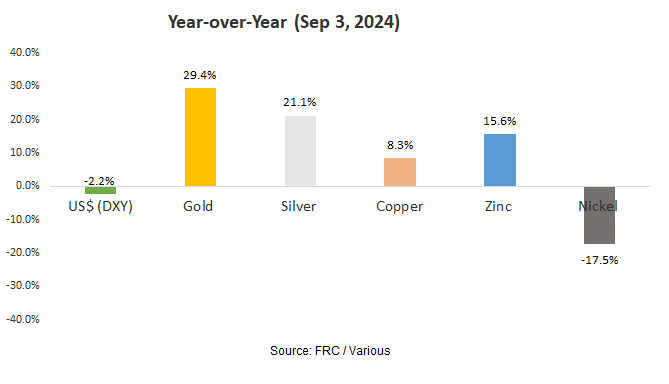
Last week, metal prices were down 2.7% on average (up 1.4% in the previous week).
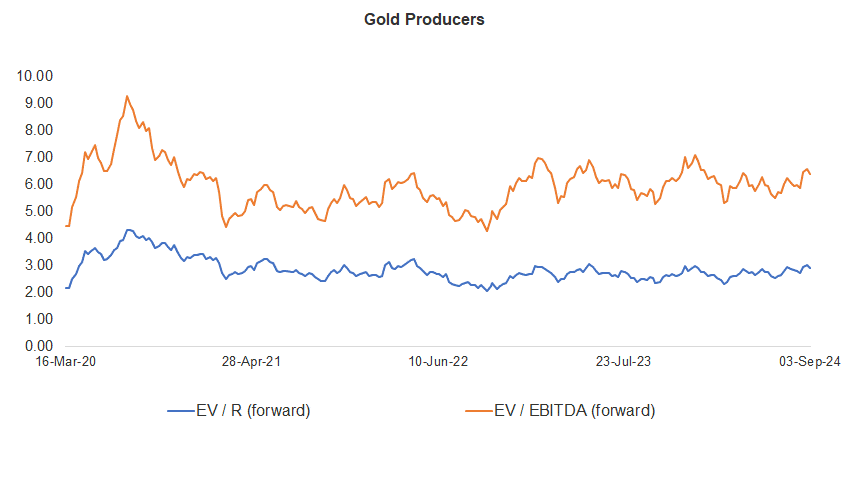
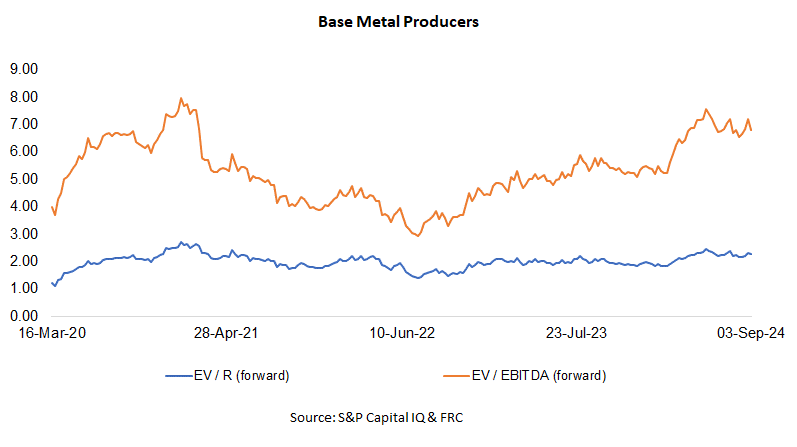
Gold producer valuations were down 2.5% last week (up 1.4% in the prior week); base metal producers were down 3.4% last week (up 4.8% in the prior week). On average, gold producer valuations are 11% lower (previously 9%) than the past three instances when gold surpassed US$2k/oz.
Source: S&P Capital IQ & FRC
| 26-Aug-24 | 03-Sep-24 | ||||
| Gold Producers | EV / R (forward) | EV / EBITDA (forward) | EV / R (forward) | EV / EBITDA (forward) | |
| 1 | Barrick | 3.43 | 7.03 | 3.36 | 6.88 |
| 2 | Newmont | 3.68 | 8.28 | 3.76 | 8.47 |
| 3 | Agnico Eagle | 5.25 | 9.45 | 5.17 | 9.32 |
| 4 | AngloGold | 2.55 | 5.67 | 2.45 | 5.49 |
| 5 | Kinross Gold | 2.69 | 5.66 | 2.65 | 5.56 |
| 6 | Gold Fields | 2.81 | 5.13 | 2.77 | 5.48 |
| 7 | Sibanye | 0.64 | 3.91 | 0.56 | 3.43 |
| 8 | Hecla Mining | 4.88 | 14.16 | 4.70 | 13.64 |
| 9 | B2Gold | 1.80 | 3.69 | 1.75 | 3.59 |
| 10 | Alamos | 5.99 | 11.25 | 5.79 | 10.96 |
| 11 | Harmony | 1.84 | 6.01 | 1.65 | 5.47 |
| 12 | Eldorado Gold | 2.81 | 5.45 | 2.72 | 5.27 |
| Average (excl outliers) | 2.99 | 6.55 | 2.92 | 6.40 | |
| Min | 0.64 | 3.69 | 0.56 | 3.43 | |
| Max | 5.99 | 14.16 | 5.79 | 13.64 | |
| Base Metal Producers | EV / R (forward) | EV / EBITDA (forward) | EV / R (forward) | EV / EBITDA (forward) | |
| 1 | BHP Group | 2.82 | 5.41 | 2.78 | 5.10 |
| 2 | Rio Tinto | 2.09 | 4.62 | 2.02 | 4.45 |
| 3 | South32 | 1.37 | 6.38 | 1.51 | 5.03 |
| 4 | Glencore | 0.39 | 5.62 | 0.37 | 5.31 |
| 5 | Anglo American | 1.87 | 5.62 | 1.78 | 5.33 |
| 6 | Teck Resources | 3.60 | 8.76 | 3.54 | 8.62 |
| 7 | First Quantum | 4.04 | 13.95 | 3.98 | 13.73 |
| Average (excl outliers) | 2.31 | 7.19 | 2.28 | 6.80 | |
| Min | 0.39 | 4.62 | 0.37 | 4.45 | |
| Max | 4.04 | 13.95 | 3.98 | 13.73 | |
We are maintaining our metal price forecasts.
Key Developments:
- Last week, Canada followed the U.S. and the EU by announcing a 100% tariff on electric vehicles, and a 25% tariff on steel and aluminum. As trade tensions between China and the West intensify, we believe North American juniors will benefit from increased demand for domestically sourced metals, particularly those primarily controlled by China, like EV metals and rare earth elements.
- The lithium sector faced two major setbacks last week. Ganfeng Lithium (SZSE: 002460) announced delays for projects they believe lack significant near-term returns. In addition, General Motors (NYSE: GM) is deferring its previously announced US$330M investment in Lithium Americas (TSX: LAC). Lithium carbonate prices are down 63% YoY, driven by excess supply and slower-than-expected EV demand. On a positive note, lithium prices were up 1.3% last week, marking the first increase in five months. Metal prices go through cycles, and we believe the lithium market, which has been in a downturn for nearly two years, is poised for a revival. We believe current lithium prices are unsustainable for most large-scale development projects. Lake Resources and Noram Lithium are on our list of top picks.
Market Updates and Insights: Cryptos
Prices of mainstream/popular cryptos were down 7% on average last week (up 4% in the previous week).
| September 3, 2024 | ||
| Cryptos | WoW | YoY |
| Bitcoin | -2% | 124% |
| Binance Coin | -2% | 145% |
| Cardano | -9% | 27% |
| Ethereum | -3% | 50% |
| Polkadot | -10% | -4% |
| XRP | 0% | 12% |
| Polygon | -18% | -26% |
| Solana | -15% | 574% |
| Average | -7% | 113% |
| Min | -18% | -26% |
| Max | 0% | 574% |
| Indices | ||
| Canadian | WoW | YoY |
| BTCC | -7% | 120% |
| BTCX | -6% | 123% |
| EBIT | -6% | 121% |
| FBTC | -7% | 24% |
| U.S. | WoW | YoY |
| BITO | -13% | 33% |
| BTF | -6% | 60% |
| IBLC | -14% | 42% |
Source: FRC/Yahoo Finance
The global MCAP of cryptos is US$2.16T, down 4% MoM, but up 98%YoY.
Total Crypto Market Cap Chart

Source: CoinGecko
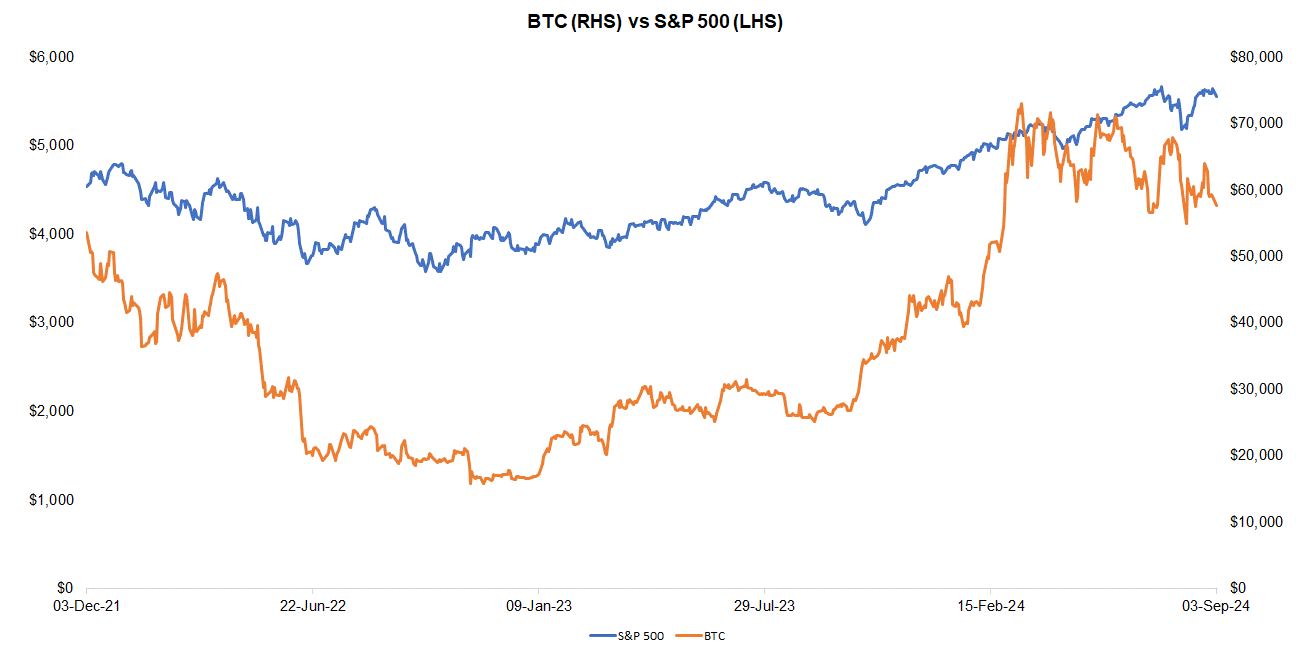
Last week, BTC was down 2.2%, while the S&P 500 was down 1.0%. The U.S. 10-year treasury yield was up slightly by 0.03 pp.
Source: FRC/ Yahoo Finance
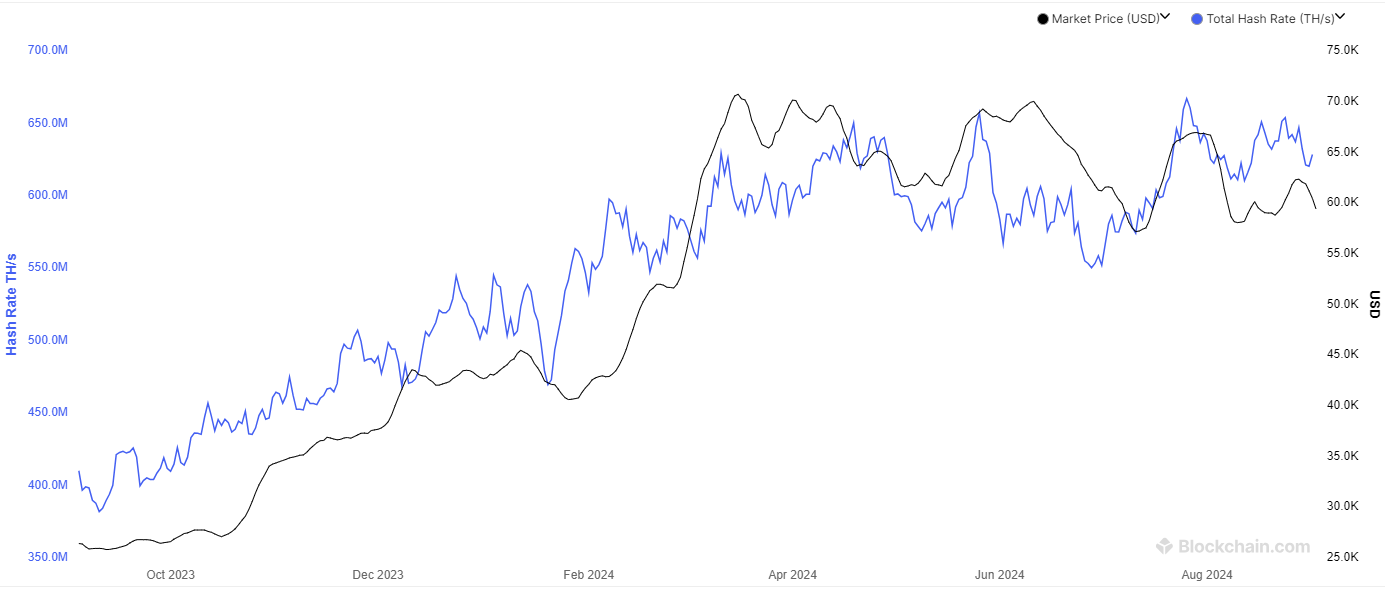
The global hash rate of BTC (defined as calculations performed per second/an indicator of network difficulty) is 629 exahashes per second (EH/s), down 4% WoW, but up 1% MoM. The decrease in hash rates is positive for miners as their efficiency rates (BTC production per EH/s) are inversely linked to global hash rates.
Total Hash Rate (BTC)
The Realized HODL ratio (RHODL), which gauges the activity of short-term holders relative to long-term holders, was up 1% WoW, and 419% YoY. We interpret the increase in RHODL as a sign of strengthening demand, suggesting potential for an uptick in near-term prices. Historically, BTC prices have moved in tandem with this ratio. By tracking RHODL, we believe we can identify potential turning points in BTC prices.

Source: FRC/ Various
The table below highlights key statistically significant factors influencing BTC prices. With four negative signals and one positive (compared to five positive and nil negative in the previous week), the near-term outlook for BTC prices has weakened.
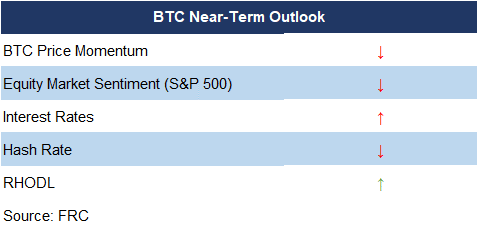 * “↑” and “↓” indicate whether a parameter has increased or decreased
* Red (green) denotes a negative (positive) signal for BTC prices; black implies neutral.
Source: FRC
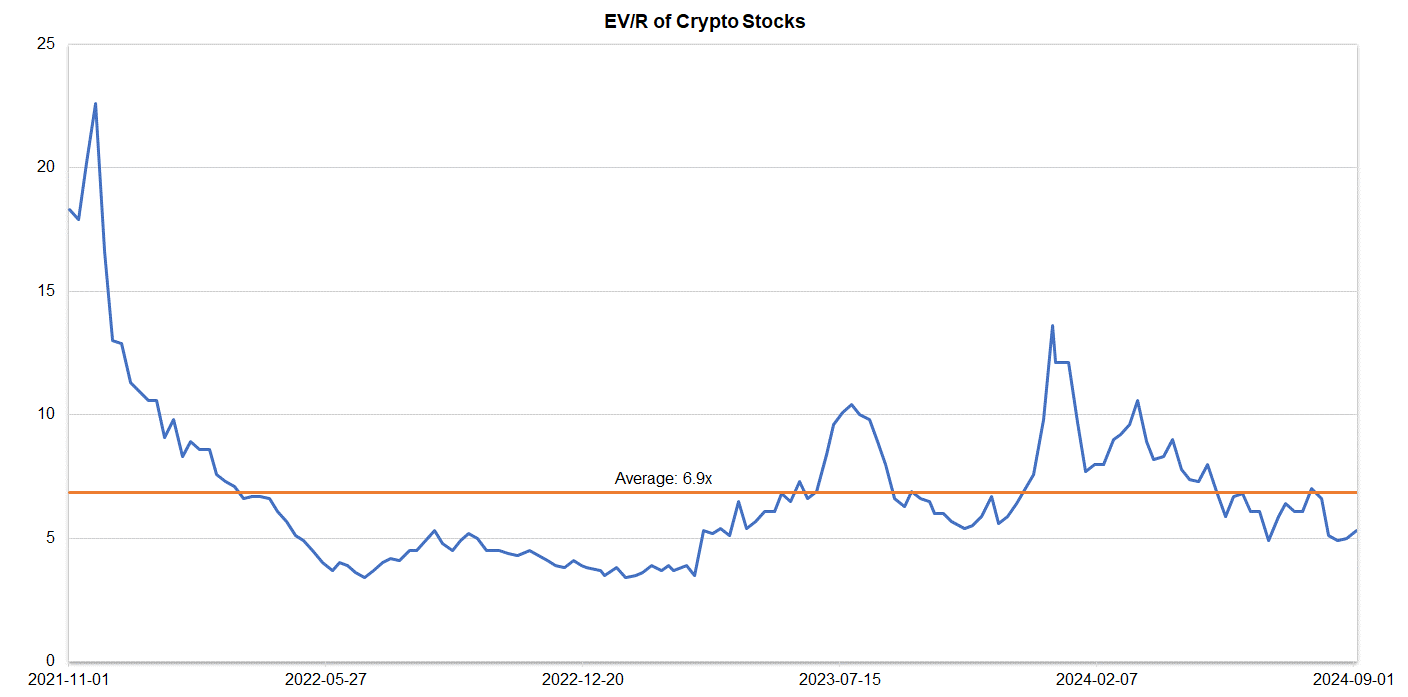
Companies operating in the crypto space are trading at an average EV/R of 4.8x (previously 5.3x).
Source: S&P Capital IQ/FRC
| September 3, 2024 | |
| Crypto Stocks | EV/Revenue |
| Argo Blockchain | 2.2 |
| BIGG Digital | 4.3 |
| Bitcoin Well | 0.7 |
| Canaan Inc. | 1.1 |
| CleanSpark Inc. | 7.5 |
| Coinbase Global | 9.5 |
| Galaxy Digital Holdings | N/A |
| HIVE Digital | 2.9 |
| Hut 8 Mining Corp. | 8.2 |
| Marathon Digital Holdings | 8.9 |
| Riot Platforms | 6.0 |
| SATO Technologies | 1.5 |
| Average | 4.8 |
| Median | 4.3 |
| Min | 0.7 |
| Max | 9.5 |
Source: S&P Capital IQ/FRC
Market Updates and Insights: Artificial Intelligence/AI
Major AI indices are down 2.6% WoW on average (up 0.1% in the previous week), but up 8% YoY.
| September 3, 2024 | ||
| AI Indices | WoW | YoY |
| First Trust Nasdaq AI and Robotics ETF | -3% | -4% |
| Global X Robotics & AI ETF | -4% | 13% |
| Global X AI & Technology ETF | -3% | 19% |
| iShares Robotics and AI Multisector ETF | 1% | -3% |
| Roundhill Generative AI & Technology ETF | -4% | 16% |
| Average | -3% | 8% |
| Min | -4% | -4% |
| Max | 1% | 19% |
Source: FRC/Various
The following table highlights some of the most popular large-cap AI stocks. Shares of these companies are down 5% WoW on average (down 4% in the previous week), but up 58% YoY. Their average P/E is 35.5x (previously 36.0x) vs the NASDAQ-100 Index’s average of 31x (previously 32x).
| AI Stocks | WoW | YoY | P/E |
| Arista Networks | -4% | 65% | n/a |
| Dell Technologies | 0% | 22% | 22.9 |
| Microsoft Corporation | -1% | 22% | 35.3 |
| NVIDIA Corp | -14% | 121% | 75.6 |
| Micron Technology | -9% | 26% | n/a |
| Palantir Technologies | -1% | 99% | n/a |
| Qualcomm | -4% | 40% | 22.2 |
| Super Micro Computer (SMCI) | -15% | 58% | 30.5 |
| Taiwan Semiconductor Manufacturing | -1% | 69% | 26.7 |
| Average | -5% | 58% | 35.5 |
| Median | -4% | 58% | 28.6 |
| Min | -15% | 22% | 22.2 |
| Max | 0% | 121% | 75.6 |
Source: FRC/Various
Key Developments:
- NVIDIA shares were down 10% today (14% in the past week) after the company received a U.S. Department of Justice subpoena for potential antitrust violations. We believe the investigation could lead to increased regulatory scrutiny, and potential legal actions, creating uncertainty for investors.
- Although AI is being actively explored across various sectors, we believe one of the most impactful areas will be healthcare. A recent report by Value Market Research projects that the global AI in Drug Discovery market will grow from US$0.7B in 2023, to US$12B by 2032, representing a CAGR of 38%. We expect this rapid growth will lead to a significant increase in startups within this sector.


