Additional Updates on Coverage:
We are terminating coverage on Verde AgriTech Ltd as our coverage period has concluded. Our rating and fair value estimate are no longer effective.
FRC Top Picks
The following table shows last month’s top five performers among our Top Picks, including five junior resource companies. The top performer, World Copper Ltd., was up 24%. WCU is advancing two large, advanced-stage copper projects in the Americas.
| Top Five Weekly Performers |
WoW Returns |
| World Copper Ltd. (WCU.V) |
23.8% |
| Verde Agritech Plc. (NPK.TO) |
12.7% |
| Millennial Potash Corp. (MLP.V) |
12.2% |
| Sirios Resources Inc. (SOI.V) |
11.0% |
| Contango Ore Inc. (CTGO) |
9.5% |
| * Past performance is not indicative of future performance (as of July 22, 2024) |
|
Source: FRC
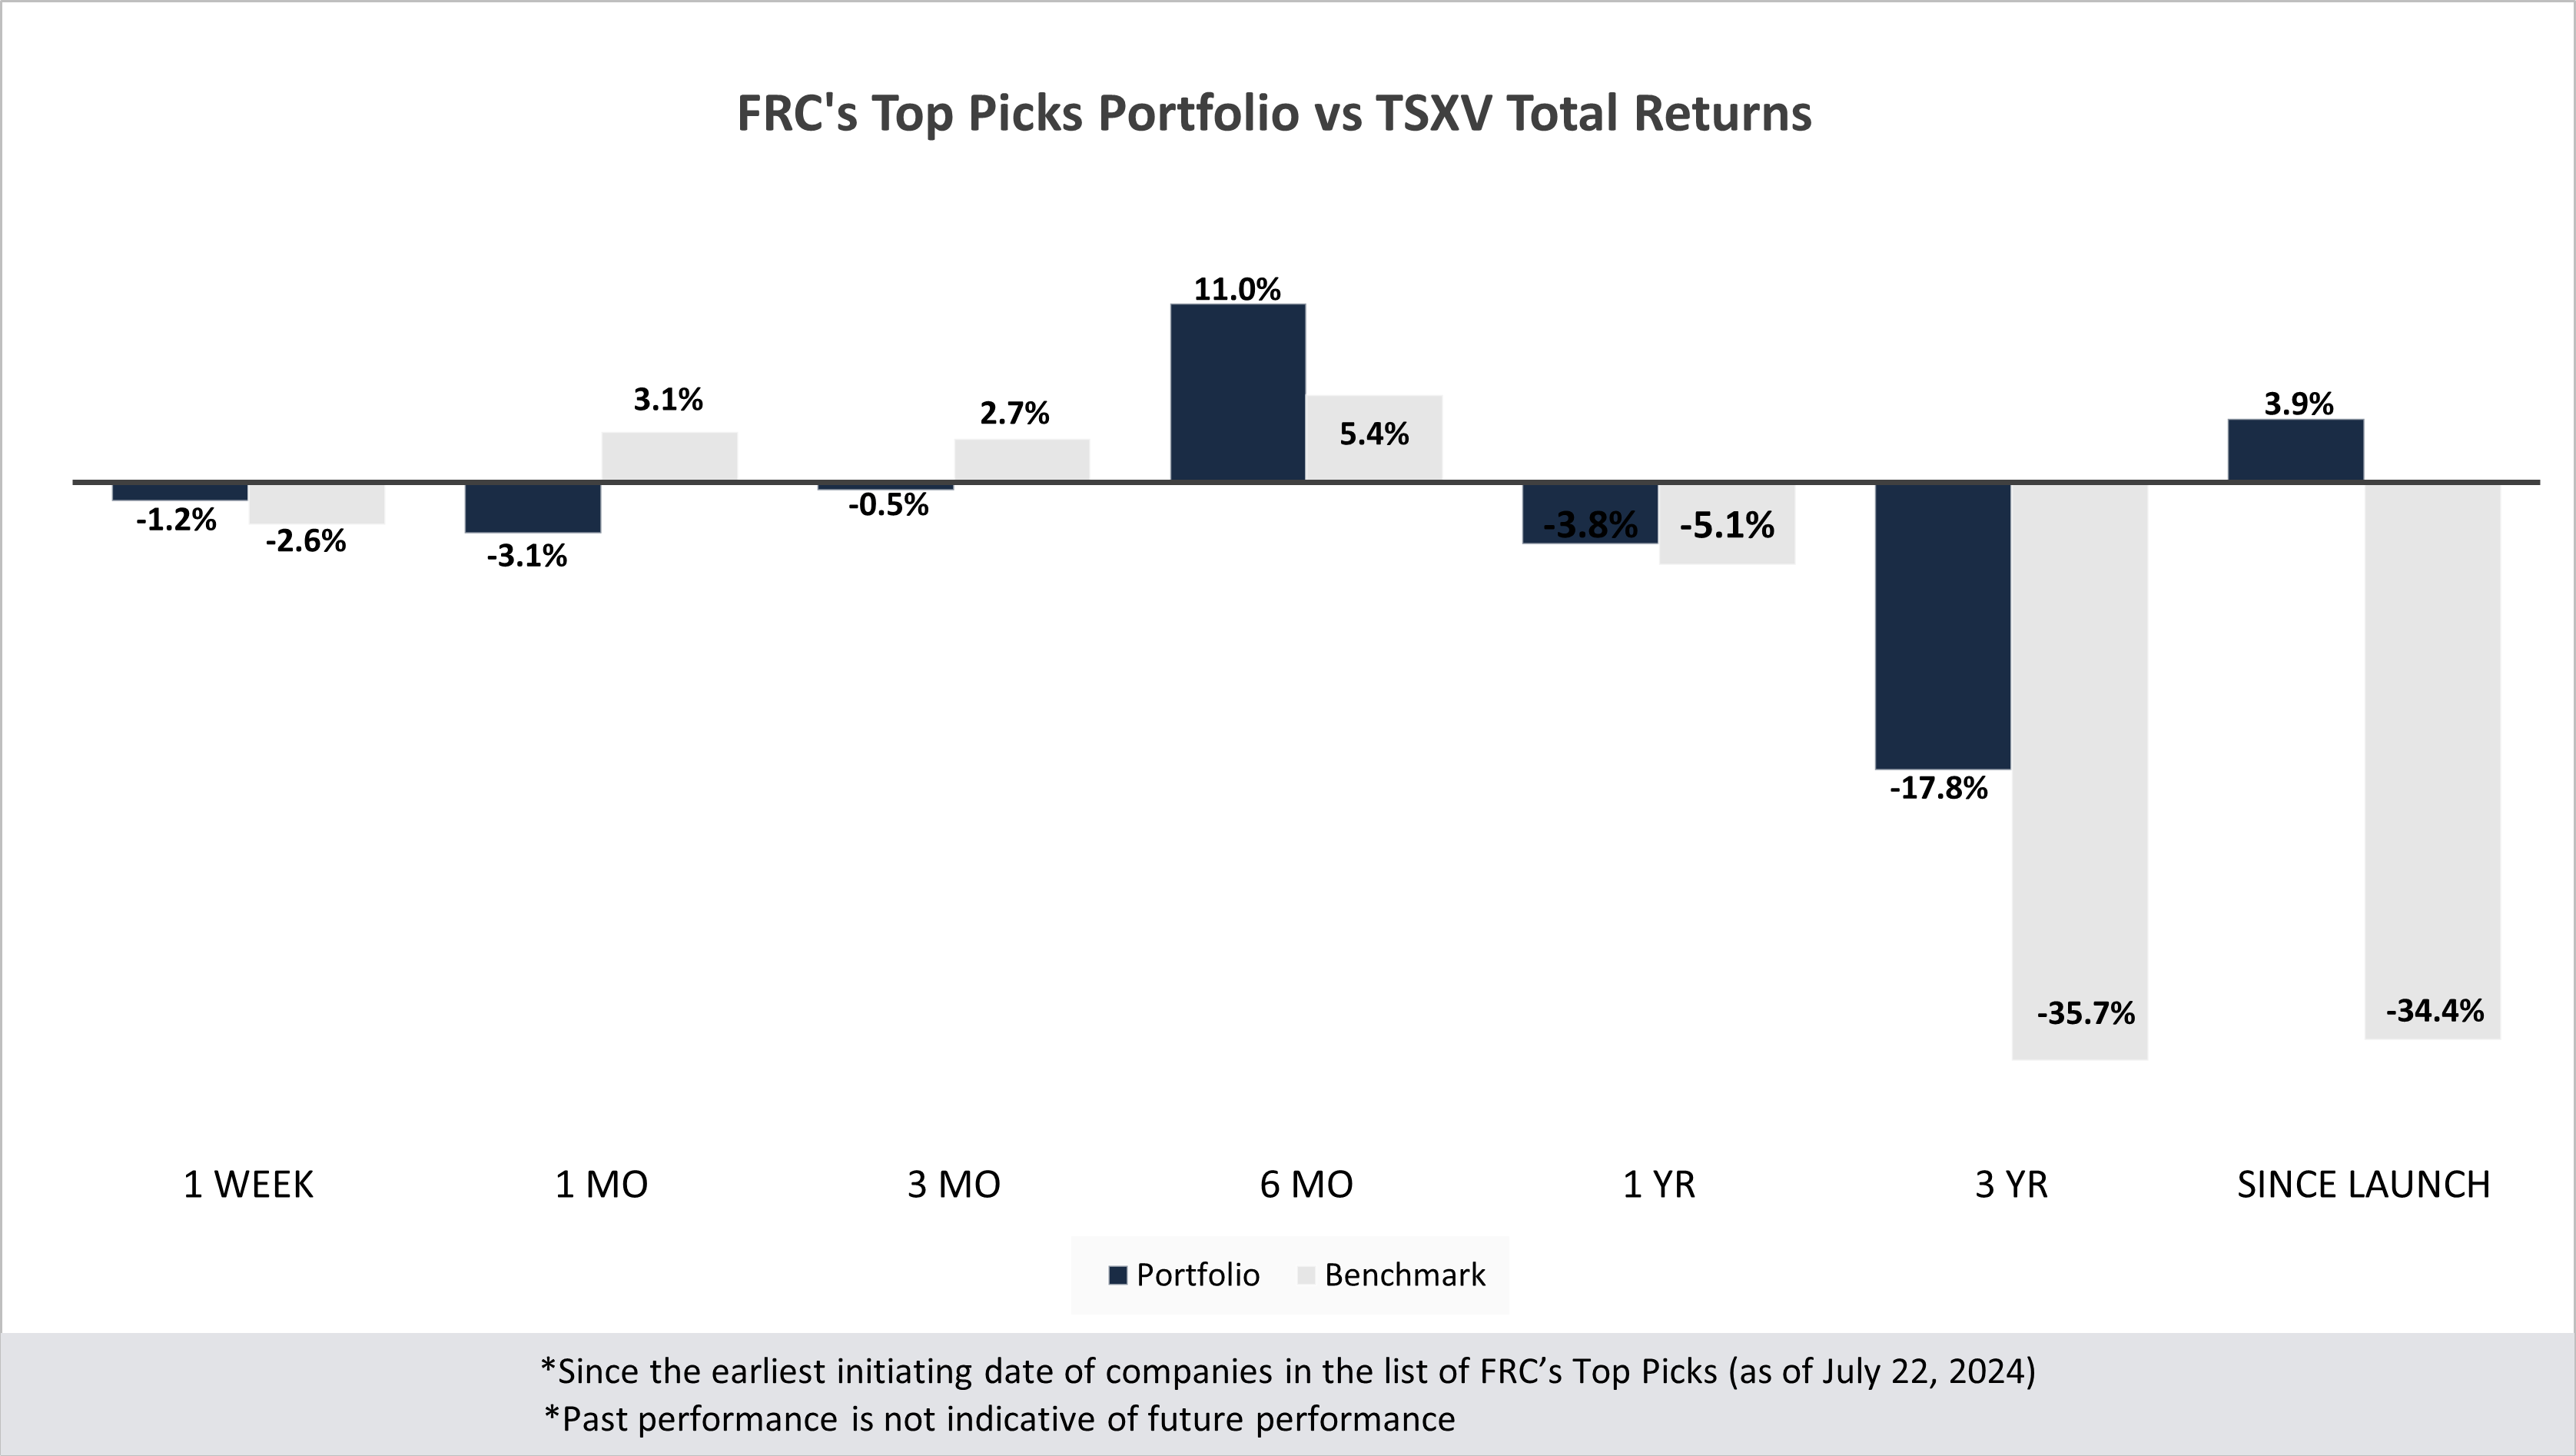
Our top picks have outperformed the benchmark (TSXV) in five out of seven time periods listed below.
Performance by Sector
| Total Return |
1 Week |
1 mo |
3 mo |
6 mo |
1 yr |
3 yr |
Since launch |
| Mining |
-0.6% |
-4.8% |
2.5% |
17.8% |
-11.4% |
-34.9% |
5.6% |
| Cannabis |
N/A |
N/A |
N/A |
N/A |
N/A |
-46.6% |
-23.6% |
| Tech |
-3.1% |
-3.1% |
-33.0% |
-13.9% |
-42.6% |
-30.8% |
-4.5% |
| Special Situations (MIC) |
-1.7% |
5.4% |
-0.1% |
6.8% |
28.5% |
-13.9% |
-10.6% |
| Private Companies |
N/A |
N/A |
N/A |
N/A |
6.7% |
20.5% |
30.5% |
| Portfolio (Total) |
-1.2% |
-3.1% |
-0.5% |
11.0% |
-3.8% |
-17.8% |
3.9% |
| Benchmark (Total) |
-2.6% |
3.1% |
2.7% |
5.4% |
-5.1% |
-35.7% |
-34.4% |
| Portfolio (Annualized) |
- |
- |
- |
- |
-3.8% |
-6.3% |
0.4% |
| Benchmark (Annualized) |
- |
- |
- |
- |
-5.1% |
-13.7% |
-3.9% |
1. Since the earliest initiating date of companies in the list of Top Picks (as of July 22, 2024) 2. Green (blue) indicates FRC's picks outperformed (underperformed) the benchmark. 3. Past performance is not indicative of future performance. 4. Our complete list of top picks (updated weekly) can be viewed here: Top Picks List
Market Updates and Insights: Mining
Last week, global equity markets were down 0.9% on average (up 1.2% in the previous week), primarily driven by a sell off in tech and AI stocks. This week, market attention will be centered on the release of U.S. GDP and core PCE inflation figures. We continue to believe that the Fed will cut rates in Q4-2024.

Source: FRC / Various
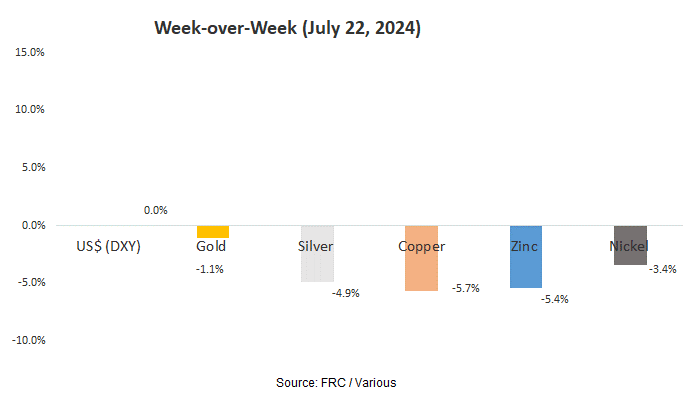
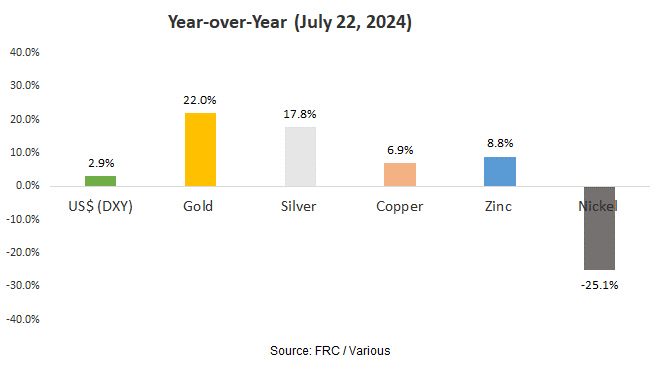
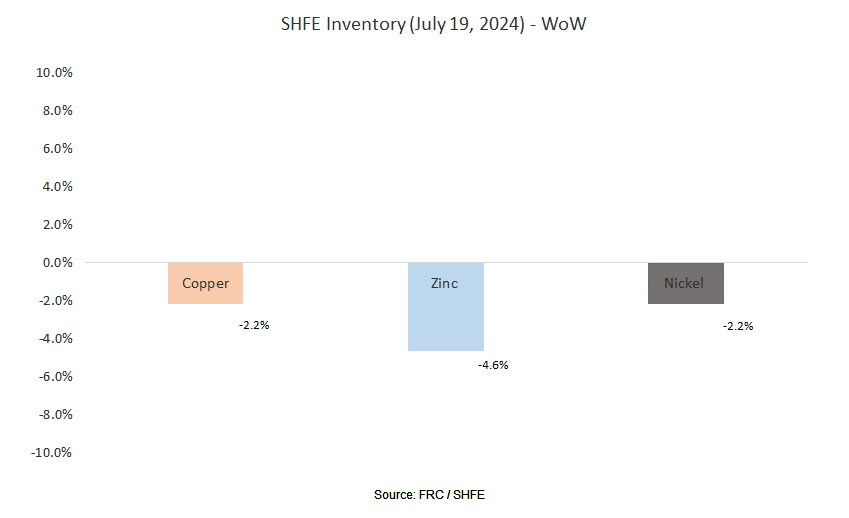
Last week, metal prices were down 4.1% on average (down 1.1% in the previous week).
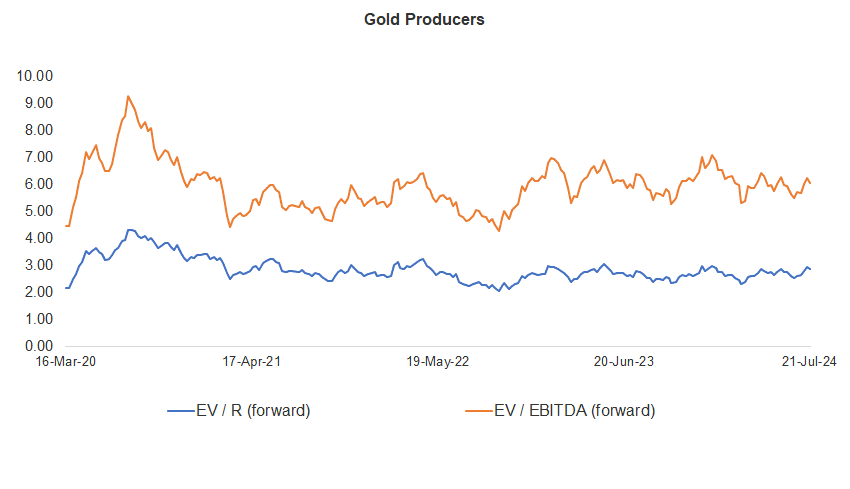
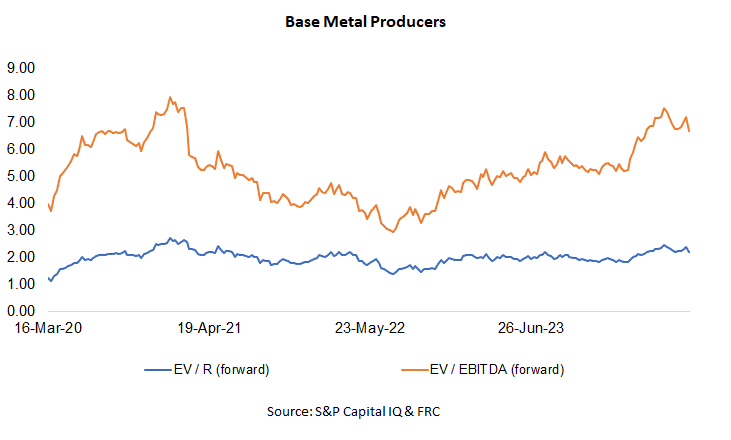
Gold producer valuations were down 2.8% last week (up 5.0% in the prior week); base metal producers were down 7.4% last week (up 3.0% in the prior week). On average, gold producer valuations are 15% lower (previously 12%) than the past three instances when gold surpassed US$2k/oz.
| |
|
15-Jul-24 |
22-Jul-24 |
| |
Gold Producers |
EV / R (forward) |
EV / EBITDA (forward) |
EV / R (forward) |
EV / EBITDA (forward) |
| |
|
|
|
|
|
| 1 |
Barrick |
3.20 |
6.54 |
3.13 |
6.46 |
| 2 |
Newmont |
3.45 |
7.81 |
3.43 |
7.77 |
| 3 |
Agnico Eagle |
4.93 |
9.04 |
4.83 |
8.80 |
| 4 |
AngloGold |
2.53 |
5.84 |
2.46 |
5.66 |
| 5 |
Kinross Gold |
2.77 |
5.92 |
2.67 |
5.63 |
| 6 |
Gold Fields |
2.91 |
5.54 |
2.92 |
5.55 |
| 7 |
Sibanye |
0.70 |
3.82 |
0.66 |
3.66 |
| 8 |
Hecla Mining |
5.10 |
14.79 |
5.08 |
13.69 |
| 9 |
B2Gold |
1.80 |
3.49 |
1.74 |
3.28 |
| 10 |
Alamos |
5.53 |
10.00 |
5.27 |
9.49 |
| 11 |
Harmony |
1.78 |
5.42 |
1.67 |
5.09 |
| 12 |
Eldorado Gold |
2.63 |
5.31 |
2.62 |
5.20 |
| |
Average (excl outliers) |
2.93 |
6.25 |
2.85 |
6.05 |
| |
Min |
0.70 |
3.49 |
0.66 |
3.28 |
| |
Max |
5.53 |
14.79 |
5.27 |
13.69 |
| |
|
|
|
|
|
| |
Base Metal Producers |
EV / R (forward) |
EV / EBITDA (forward) |
EV / R (forward) |
EV / EBITDA (forward) |
| |
|
|
|
|
|
| 1 |
BHP Group |
3.02 |
5.76 |
2.81 |
5.38 |
| 2 |
Rio Tinto |
2.24 |
4.78 |
2.13 |
4.63 |
| 3 |
South32 |
1.59 |
7.17 |
1.30 |
5.94 |
| 4 |
Glencore |
0.46 |
5.96 |
0.43 |
5.66 |
| 5 |
Anglo American |
1.90 |
5.56 |
1.82 |
5.36 |
| 6 |
Teck Resources |
3.56 |
8.18 |
3.34 |
7.80 |
| 7 |
First Quantum |
3.96 |
13.05 |
3.60 |
12.11 |
| |
Average (excl outliers) |
2.39 |
7.21 |
2.20 |
6.70 |
| |
Min |
0.46 |
4.78 |
0.43 |
4.63 |
| |
Max |
3.96 |
13.05 |
3.60 |
12.11 |
Source: S&P Capital IQ & FRC
We are maintaining our metal price forecasts.

Key Developments:
- Saudi Arabia's mining minister is visiting Brazil and Chile over the next two weeks as the oil-rich nation expands its global mining footprint. We believe this development is positive for junior resource companies operating in the region. South Star Battery Metals, focused on graphite in Brazil, and Lithium Chile, which targets lithium in Chile and Argentina, are two promising juniors under our coverage.
Market Updates and Insights: Cryptos
Prices of mainstream/popular cryptos were up 3% on average last week (up 12% in the previous week).
| July 22, 2024 |
|
|
| Cryptos |
WoW |
YoY |
| Bitcoin |
6% |
128% |
| Binance Coin |
4% |
146% |
| Cardano |
-2% |
38% |
| Ethereum |
3% |
87% |
| Polkadot |
-3% |
16% |
| XRP |
-1% |
-16% |
| Polygon |
0% |
-29% |
| Solana |
17% |
622% |
| Average |
3% |
124% |
| Min |
-3% |
-29% |
| Max |
17% |
622% |
| |
|
|
| Indices |
| Canadian |
WoW |
YoY |
| BTCC |
6% |
127% |
| BTCX |
6% |
141% |
| EBIT |
6% |
139% |
| FBTC |
6% |
45% |
| |
|
|
| U.S. |
WoW |
YoY |
| BITO |
6% |
53% |
| BTF |
4% |
82% |
| IBLC |
-4% |
63% |
Source: FRC/Yahoo Finance
The global MCAP of cryptos is US$2.60T, up 5% MoM, and 110%YoY.
Total Crypto Market Cap Chart

Source: CoinGecko
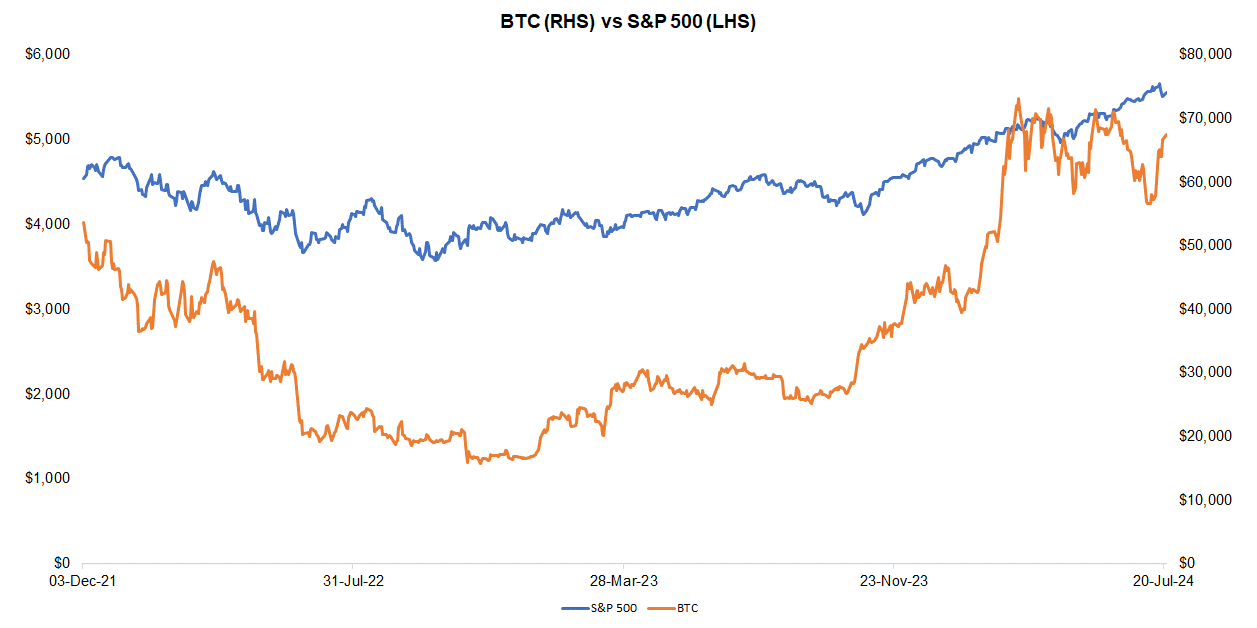
Last week, BTC was up 5.8%, while the S&P 500 was down 1.3%. The U.S. 10-year treasury yield was up 0.03 pp.
Source: FRC/ Yahoo Finance
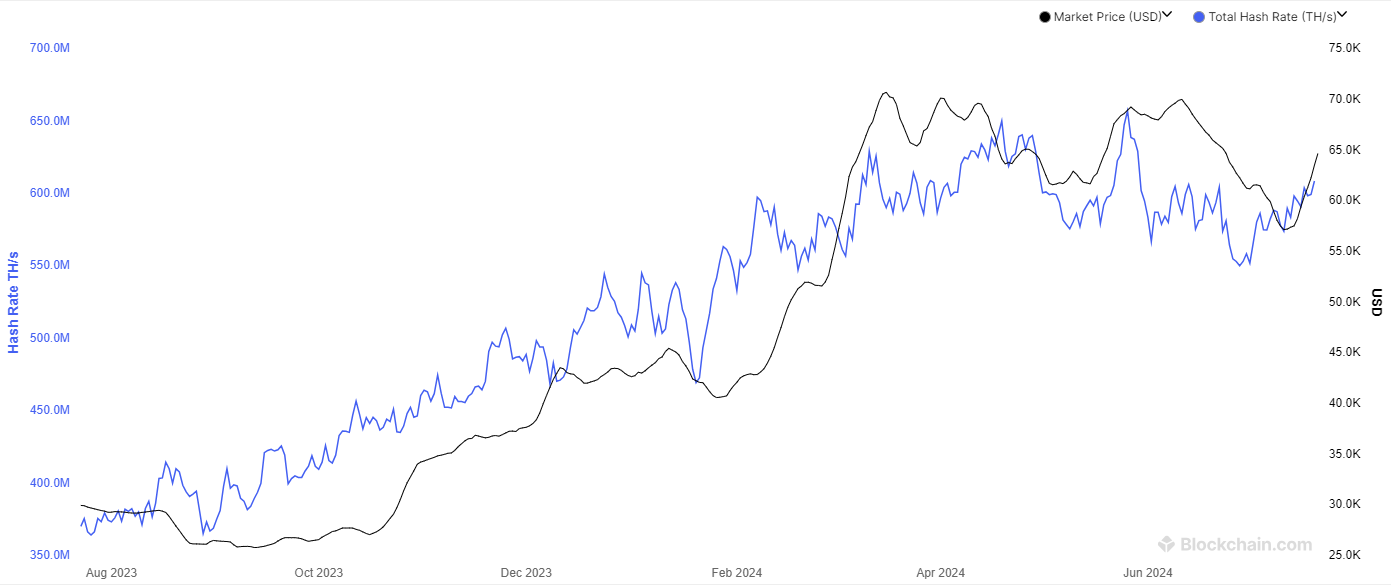
The global hash rate of BTC (defined as calculations performed per second/an indicator of network difficulty) is 609 exahashes per second (EH/s), up 4% WoW, and 1% MoM. The increase in hash rates is negative for miners as their efficiency rates (BTC production per EH/s) are inversely linked to global hash rates.
Total Hash Rate (BTC)
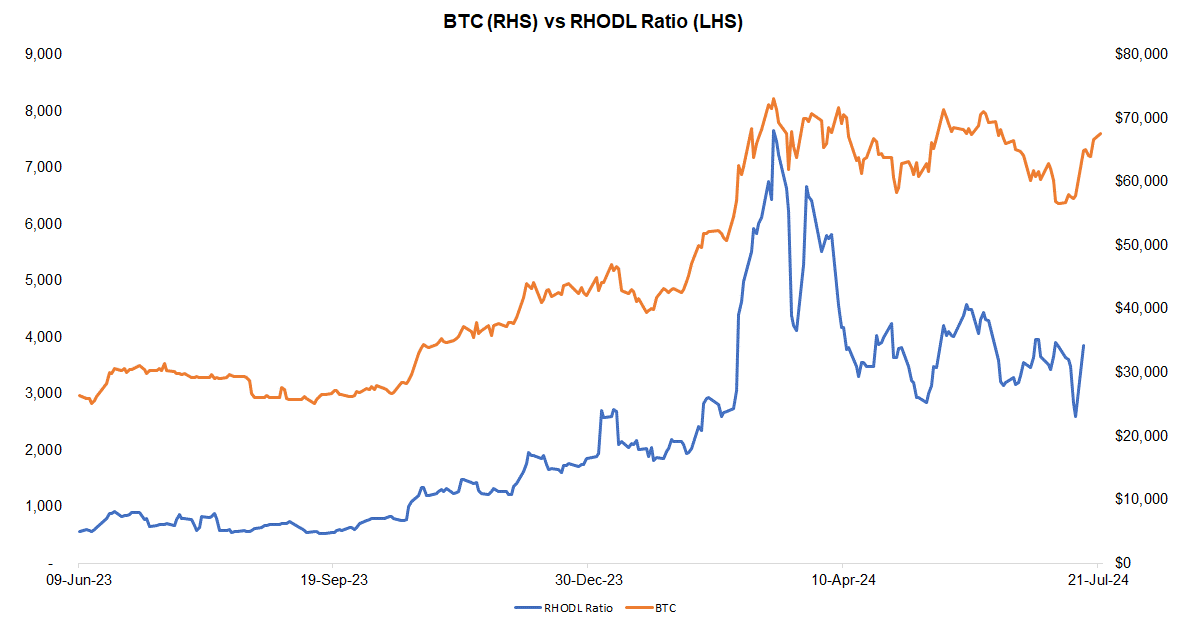
The Realized HODL ratio (RHODL), which gauges the activity of short-term holders relative to long-term holders, was up 4% WoW, and 417% YoY. We interpret the increase in RHODL as a sign of strengthening demand, suggesting potential for an uptick in near-term prices. Historically, BTC prices have moved in tandem with this ratio. By tracking RHODL, we believe we can identify potential turning points in BTC prices.
Source: FRC/ Various
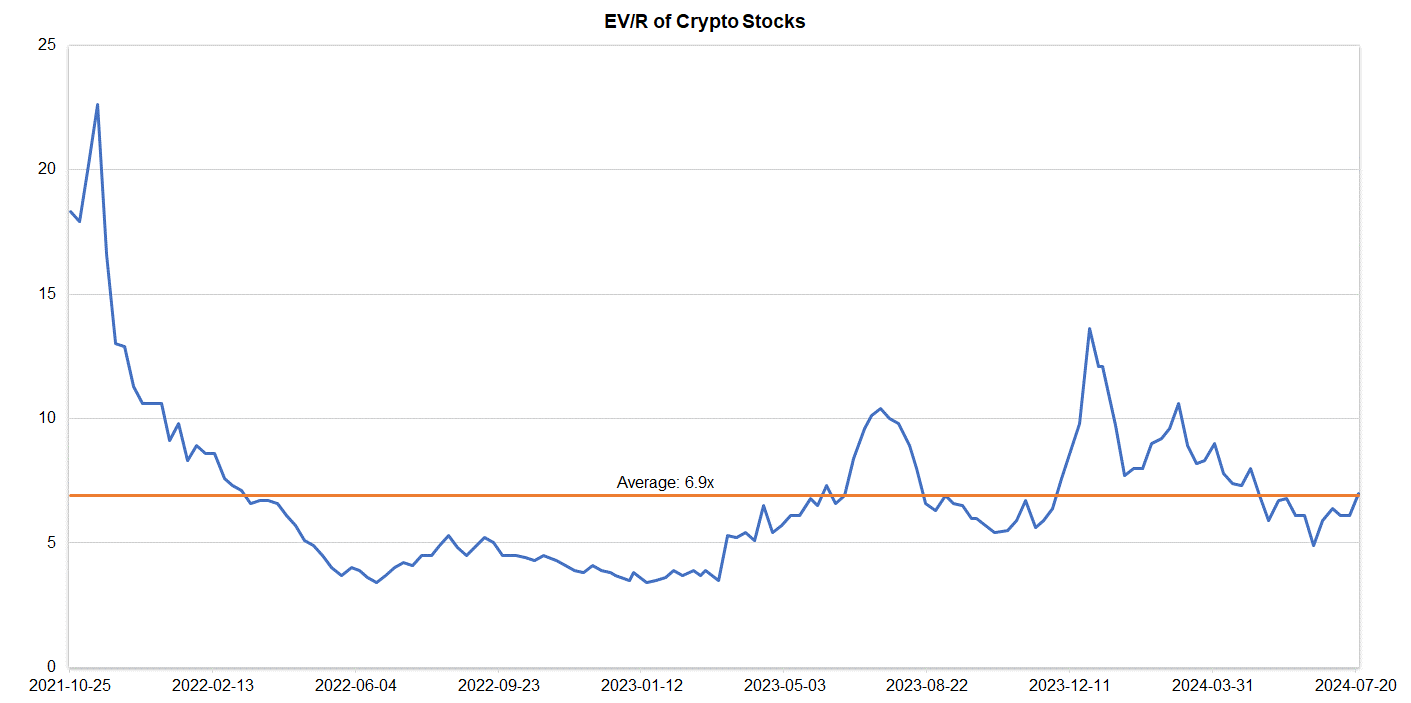
Companies operating in the crypto space are trading at an average EV/R of 7.0x (previously 6.1x).
Source: S&P Capital IQ/FRC
| July 22, 2024 |
|
| Crypto Stocks |
EV/Revenue |
| Argo Blockchain |
2.1 |
| BIGG Digital |
5.6 |
| Bitcoin Well |
0.9 |
| Canaan Inc. |
1.5 |
| CleanSpark Inc. |
13.5 |
| Coinbase Global |
16.2 |
| Galaxy Digital Holdings |
N/A |
| HIVE Digital |
4.4 |
| Hut 8 Mining Corp. |
8.2 |
| Marathon Digital Holdings |
13.5 |
| Riot Platforms |
9.8 |
| SATO Technologies |
1.6 |
| |
|
| Average |
7.0 |
| Median |
5.6 |
| Min |
0.9 |
| Max |
16.2 |
Source: S&P Capital IQ/FRC
Market Updates and Insights: Artificial Intelligence/AI
Major AI indices are down 2% WoW on average (up 1% in the previous week), but up 10% YoY.
| July 22, 2024 |
|
|
| AI Indices |
WoW |
YoY |
| First Trust Nasdaq AI and Robotics ETF |
-2% |
-6% |
| Global X Robotics & AI ETF |
-3% |
9% |
| Global X AI & Technology ETF |
-3% |
25% |
| iShares Robotics and AI Multisector ETF |
1% |
-1% |
| Roundhill Generative AI & Technology ETF |
-5% |
25% |
| Average |
-2% |
10% |
| Min |
-5% |
-6% |
| Max |
1% |
25% |
Source: FRC/Various
The following table highlights some of the most popular large-cap AI stocks. Shares of these companies are down 6% WoW on average (down 1% in the previous week), but up 97% YoY. Their average P/E is 39.3x (previously 43.2x) vs the NASDAQ-100 Index’s average of 31.9x (previously 32.7x)
| AI Stocks |
WoW |
YoY |
P/E |
| Arista Networks |
-5% |
99% |
46.0 |
| Dell Technologies |
-7% |
139% |
25.7 |
| Microsoft Corporation |
-2% |
29% |
37.9 |
| NVIDIA Corp |
-4% |
178% |
68.9 |
| Micron Technology |
-12% |
76% |
n/a |
| Palantir Technologies |
1% |
75% |
n/a |
| Qualcomm |
-7% |
57% |
24.8 |
| Super Micro Computer (SMCI) |
-13% |
154% |
44.3 |
| Taiwan Semiconductor Manufacturing |
-10% |
68% |
27.2 |
| Average |
-6% |
97% |
39.3 |
| Median |
-7% |
76% |
37.9 |
| Min |
-13% |
29% |
24.8 |
| Max |
1% |
178% |
68.9 |
Source: FRC/Various
Key Developments:
-
Canadian AI startup Cohere Inc. has secured US$500M in funding, valuing the company at US$5.5B, or approximately 157 times its annualized revenue of US$35M. We believe this investment highlights the strong demand for AI technologies. We anticipate the sector to witness a surge in M&A activity in the coming year.


