FRC Top Picks
The following table shows last week’s top five performers among our Top Picks, including five junior resource companies. The top performer, South Star Battery Metals, was up 13%, following the approval of its mining licenses.
| Top Five Weekly Performers |
WoW Returns |
| South Star Battery Metals Corp. (STS.V) |
13.2% |
| Noram Lithium Corp. (NRM.V) |
10.2% |
| Steppe Gold (STGO.TO) |
10.2% |
| Kootenay Silver Inc. (KTN.V) |
9.6% |
| Panoro Minerals (PML.V) |
7.7% |
| * Past performance is not indicative of future performance (as of June 24, 2024) |
|
Source: FRC
Our top picks have outperformed the benchmark (TSXV) in five out of seven time periods listed below.
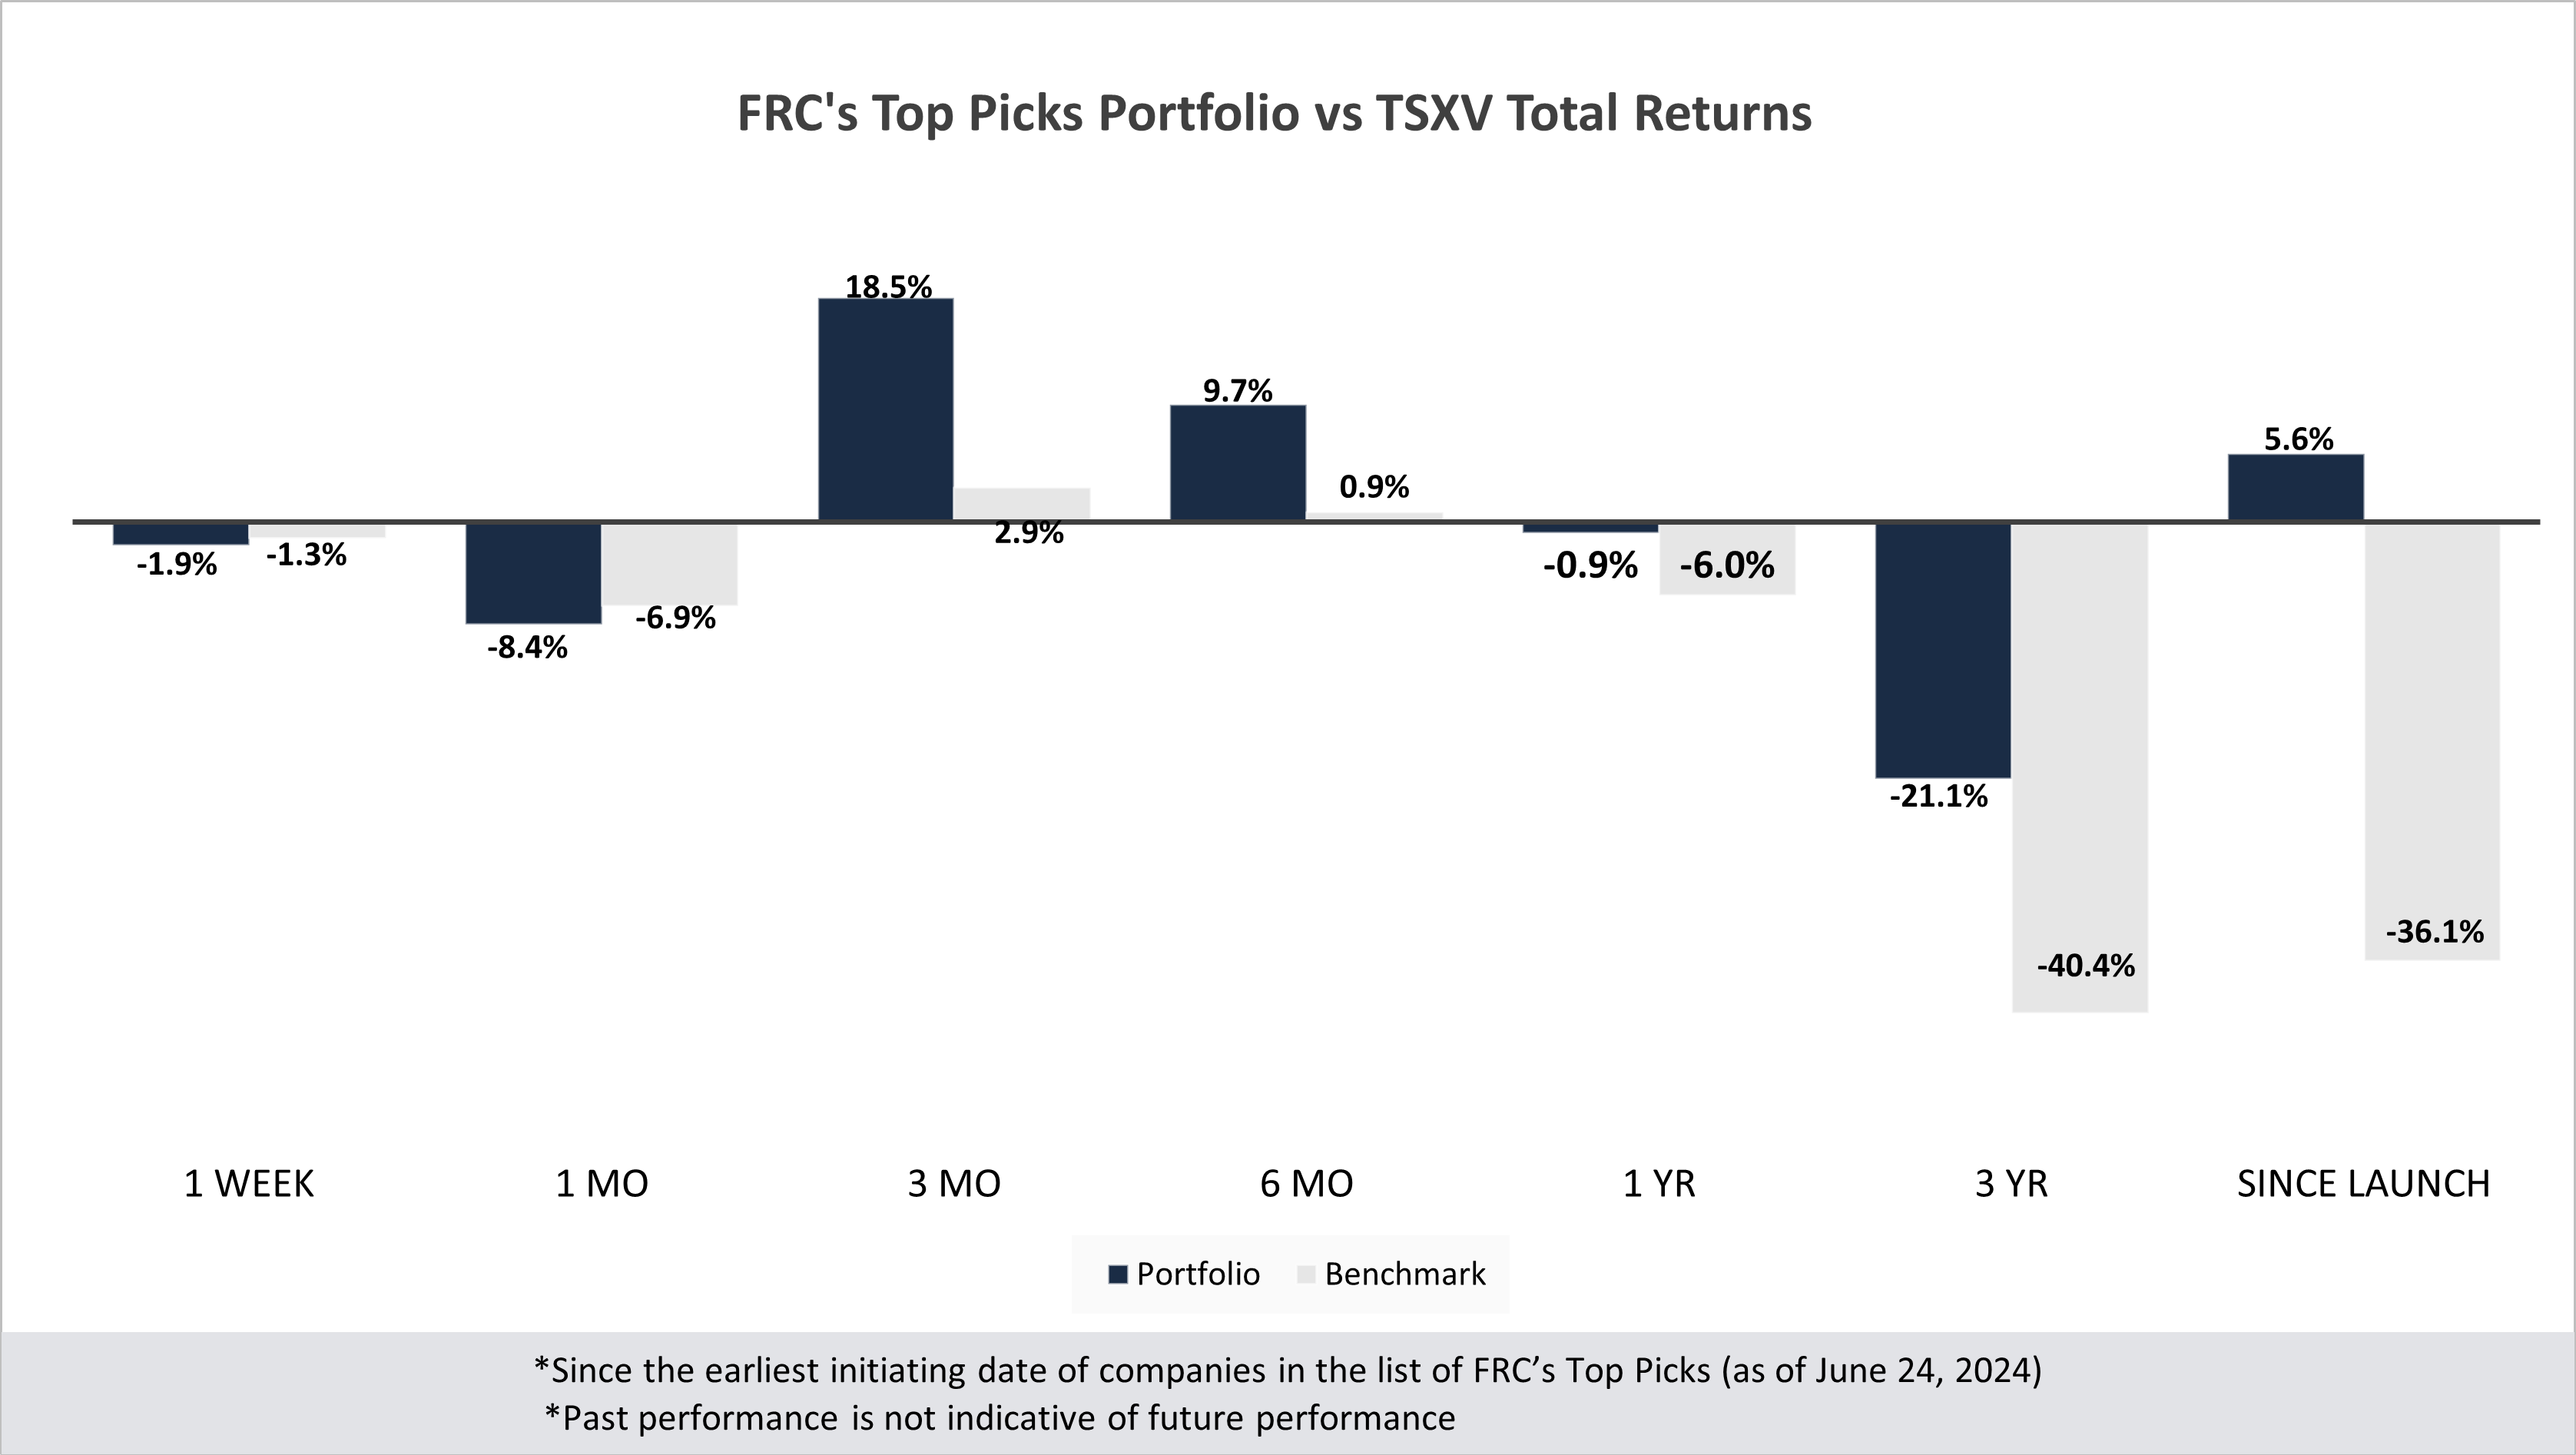
Performance by Sector
| Total Return |
1 Week |
1 mo |
3 mo |
6 mo |
1 yr |
3 yr |
Since launch |
| Mining |
-1.2% |
-10.3% |
27.1% |
13.6% |
-6.9% |
-39.6% |
9.1% |
| Cannabis |
N/A |
N/A |
N/A |
N/A |
N/A |
-43.1% |
-23.6% |
| Tech |
-13.9% |
-8.8% |
-13.9% |
19.2% |
-35.4% |
-34.9% |
-4.5% |
| Special Situations (MIC) |
-0.9% |
2.3% |
0.4% |
7.9% |
26.0% |
-18.5% |
-10.6% |
| Private Companies |
N/A |
N/A |
N/A |
N/A |
6.7% |
20.5% |
30.5% |
| Portfolio (Total) |
-1.9% |
-8.4% |
18.5% |
9.7% |
-0.9% |
-21.1% |
5.6% |
| Benchmark (Total) |
-1.3% |
-6.9% |
2.9% |
0.9% |
-6.0% |
-40.4% |
-36.1% |
| Portfolio (Annualized) |
- |
- |
- |
- |
-0.9% |
-7.6% |
0.5% |
| Benchmark (Annualized) |
- |
- |
- |
- |
-6.0% |
-15.8% |
-4.2% |
1. Since the earliest initiating date of companies in the list of Top Picks (as of June 24, 2024) 2. Green (blue) indicates FRC's picks outperformed (underperformed) the benchmark. 3. Past performance is not indicative of future performance. 4. Our complete list of top picks (updated weekly) can be viewed here: Top Picks List
Market Updates and Insights: Mining
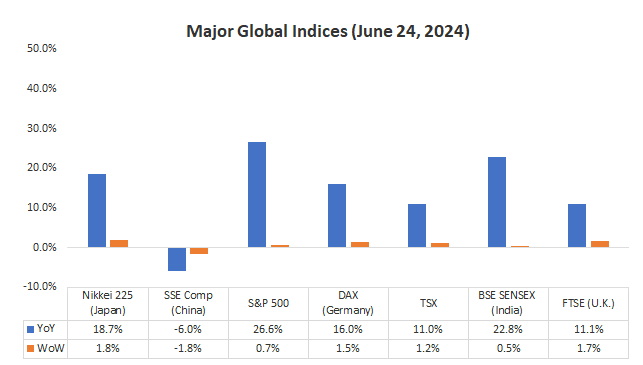
Last week, global equity markets were up 0.8% on average (down 1.0% in the previous week). Last week, the Swiss National Bank became the first major central bank to implement a second rate cut this year, reducing rates by 25 bp. In contrast, the Bank of England (BoE) and the Reserve Bank of Australia opted to maintain their rates as expected. The BoE's dovish comments suggest a possible rate cut in August. This week, all eyes are focused on U.S. GDP and core inflation data.
Source: FRC / Various
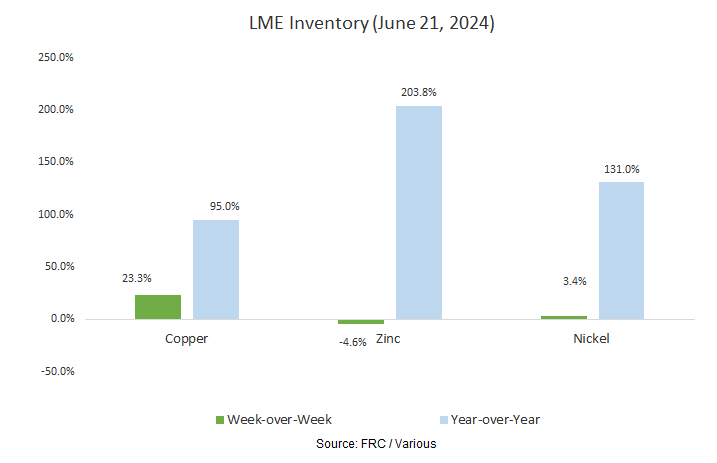
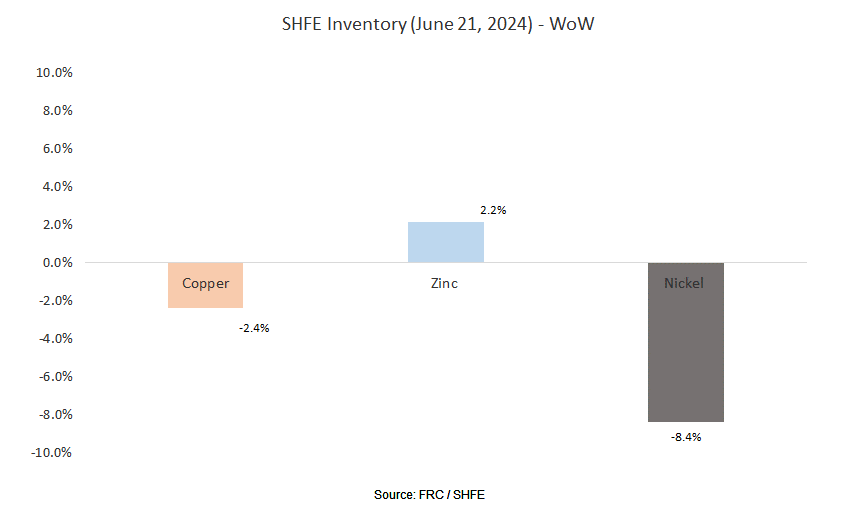
Last week, metal prices were up 0.1% on average (down 1.5% in the previous week).
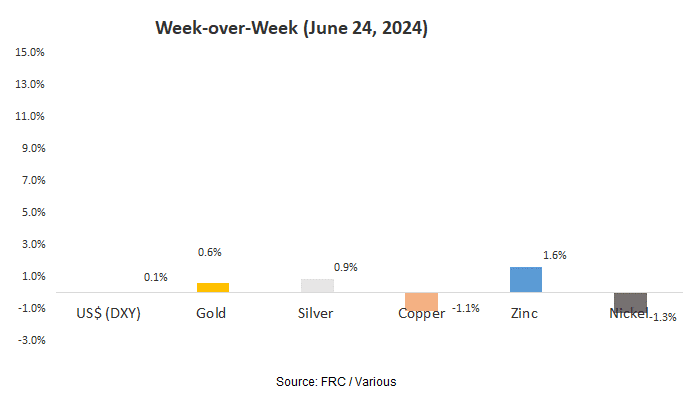
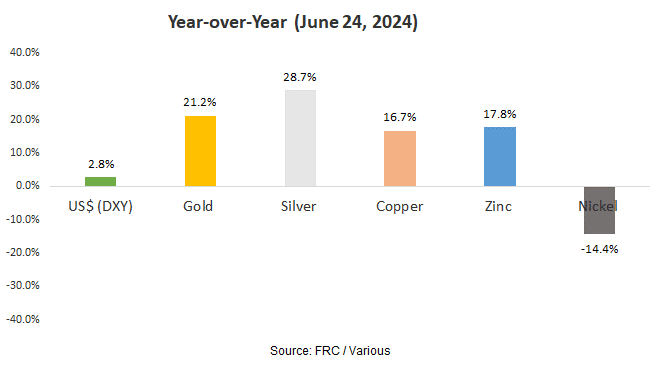
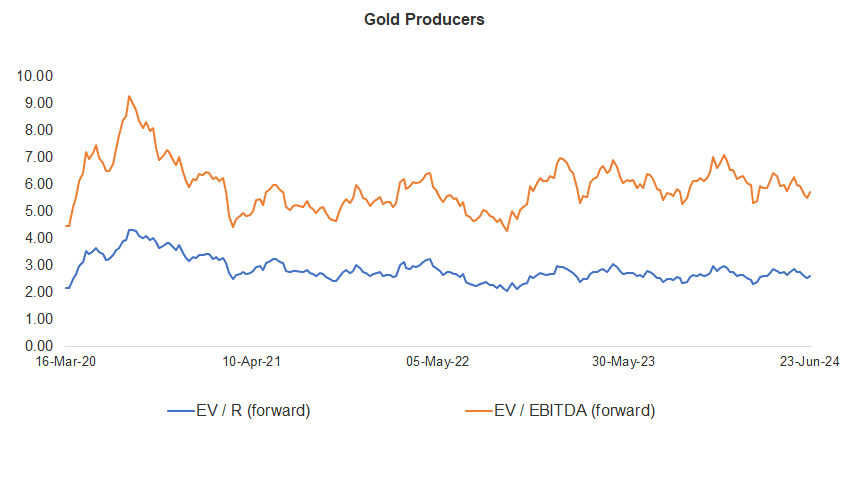
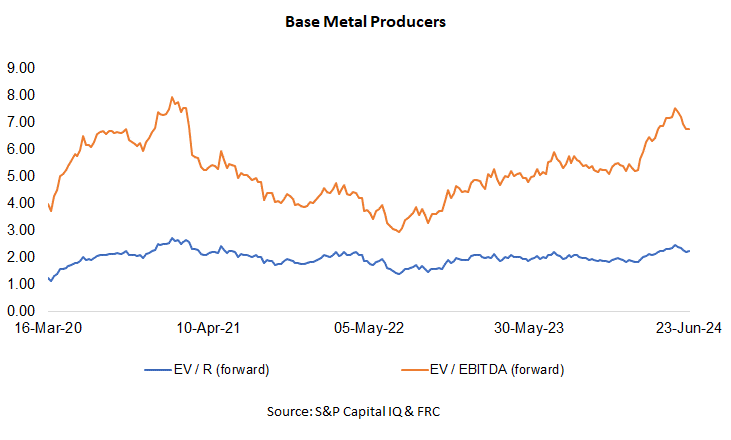
Gold producer valuations were up 3.6% last week (down 2.4% in the prior week); base metal producers were up 0.6% last week (down 2.9% in the prior week). On average, gold producer valuations are 21% lower (previously 23%) than the past three instances when gold surpassed US$2k/oz.
| |
|
17-Jun-24 |
24-Jun-24 |
| |
Gold Producers |
EV / R (forward) |
EV / EBITDA (forward) |
EV / R (forward) |
EV / EBITDA (forward) |
| |
|
|
|
|
|
| |
|
|
|
|
|
| 1 |
Barrick |
2.91 |
6.12 |
2.99 |
6.28 |
| 2 |
Newmont |
3.11 |
7.18 |
3.18 |
7.29 |
| 3 |
Agnico Eagle |
4.31 |
8.09 |
4.38 |
8.20 |
| 4 |
AngloGold |
2.09 |
4.78 |
2.14 |
4.83 |
| 5 |
Kinross Gold |
2.35 |
5.24 |
2.41 |
5.38 |
| 6 |
Gold Fields |
2.40 |
4.30 |
2.69 |
4.98 |
| 7 |
Sibanye |
0.67 |
3.58 |
0.70 |
3.74 |
| 8 |
Hecla Mining |
4.53 |
14.03 |
4.50 |
13.97 |
| 9 |
B2Gold |
1.55 |
3.06 |
1.59 |
3.11 |
| 10 |
Alamos |
4.52 |
8.63 |
4.67 |
8.94 |
| 11 |
Harmony |
1.57 |
4.79 |
1.67 |
5.08 |
| 12 |
Eldorado Gold |
2.34 |
4.82 |
2.39 |
4.92 |
| |
Average (excl outliers) |
2.53 |
5.51 |
2.62 |
5.70 |
| |
Min |
0.67 |
3.06 |
0.70 |
3.11 |
| |
Max |
4.53 |
14.03 |
4.67 |
13.97 |
| |
Industry (three year average) |
110.70 |
116.70 |
110.70 |
116.70 |
| |
|
|
|
|
|
| |
Base Metal Producers |
EV / R (forward) |
EV / EBITDA (forward) |
EV / R (forward) |
EV / EBITDA (forward) |
| |
|
|
|
|
|
| |
|
|
|
|
|
| 1 |
BHP Group |
2.88 |
5.56 |
2.90 |
5.59 |
| 2 |
Rio Tinto |
2.18 |
4.62 |
2.20 |
4.68 |
| 3 |
South32 |
1.57 |
7.28 |
1.58 |
7.31 |
| 4 |
Glencore |
0.44 |
5.77 |
0.45 |
5.80 |
| 5 |
Anglo American |
1.86 |
5.49 |
1.92 |
5.67 |
| 6 |
Teck Resources |
2.90 |
6.69 |
2.86 |
6.60 |
| 7 |
First Quantum |
3.64 |
11.85 |
3.68 |
11.82 |
| |
Average (excl outliers) |
2.21 |
6.75 |
2.23 |
6.78 |
| |
Min |
0.44 |
4.62 |
0.45 |
4.68 |
| |
Max |
3.64 |
11.85 |
3.68 |
11.82 |
Source: S&P Capital IQ & FRC
We are maintaining our metal price forecasts.

Key Developments:
Paladin Energy (MCAP: $3.6B) is acquiring Fission Uranium for $1.1B, or $1.30/share, reflecting a 30% premium over FCU’s last closing price. This acquisition is consistent with our earlier prediction that majors would pursue M&A to secure long-term supply. Given that Russia contributes to 35% of global enriched uranium production, we believe the uranium supply chain remains highly vulnerable.
FCU is advancing a high-grade uranium project in the Athabasca Basin, hosting 130 Mlbs in resources. A recent feasibility study revealed an AT-NPV8% of $1.6B, using US$75/lbs uranium. PDN is paying 60% of the AT-NPV8%, or $7.4/lb, in line with the sector average.
Market Updates and Insights: Cryptos
Prices of mainstream/popular cryptos were down 8% on average last week (down 3% in the previous week).
| June 24, 2024 |
|
|
| Cryptos |
WoW |
YoY |
| Bitcoin |
-9% |
94% |
| Binance Coin |
-7% |
138% |
| Cardano |
-3% |
28% |
| Ethereum |
-7% |
76% |
| Polkadot |
-10% |
12% |
| XRP |
-6% |
-4% |
| Polygon |
-7% |
-17% |
| Solana |
-12% |
661% |
| Average |
-8% |
124% |
| Min |
-12% |
-17% |
| Max |
-3% |
661% |
| |
|
|
| Indices |
| Canadian |
WoW |
YoY |
| BTCC |
-9% |
89% |
| BTCX |
-9% |
99% |
| EBIT |
-9% |
99% |
| FBTC |
-10% |
27% |
| |
|
|
| U.S. |
WoW |
YoY |
| BITO |
-10% |
31% |
| BTF |
-9% |
57% |
| IBLC |
-4% |
72% |
Source: FRC/Yahoo Finance
The global MCAP of cryptos is US$2.36T, down 13% MoM, but up 92%YoY.
Total Crypto Market Cap Chart

Source: CoinGecko
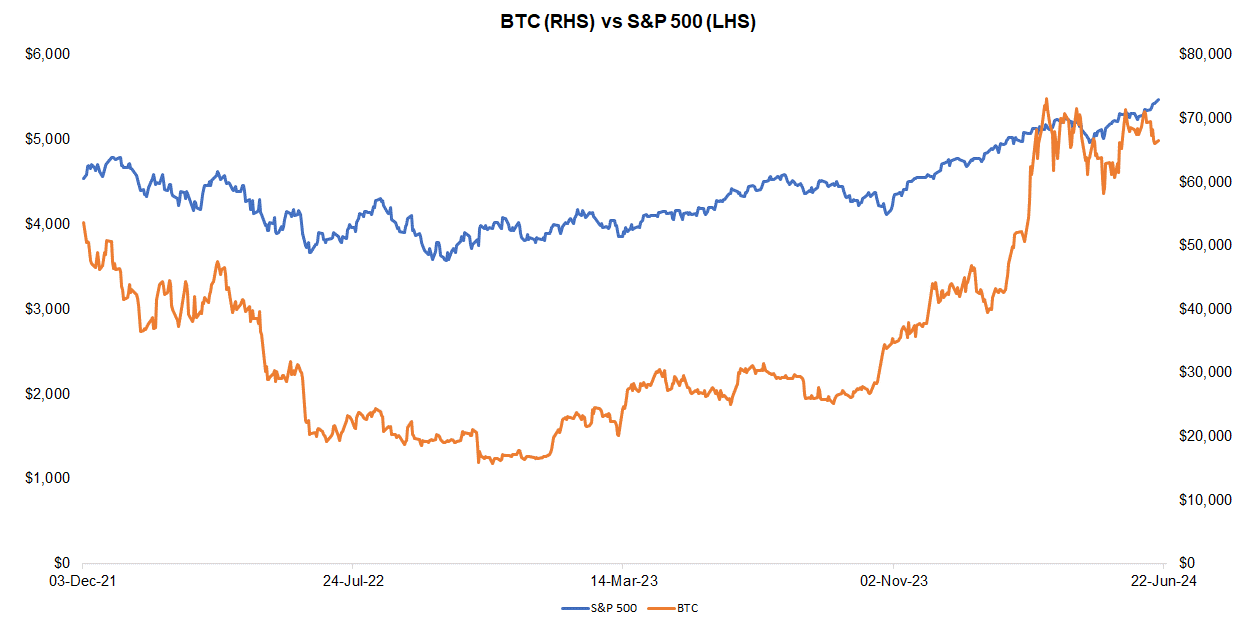
Last week, BTC was down 8.7%, while the S&P 500 was up 0.7%. The U.S. 10-year treasury yield was down 0.2%.
Source: FRC/ Yahoo Finance
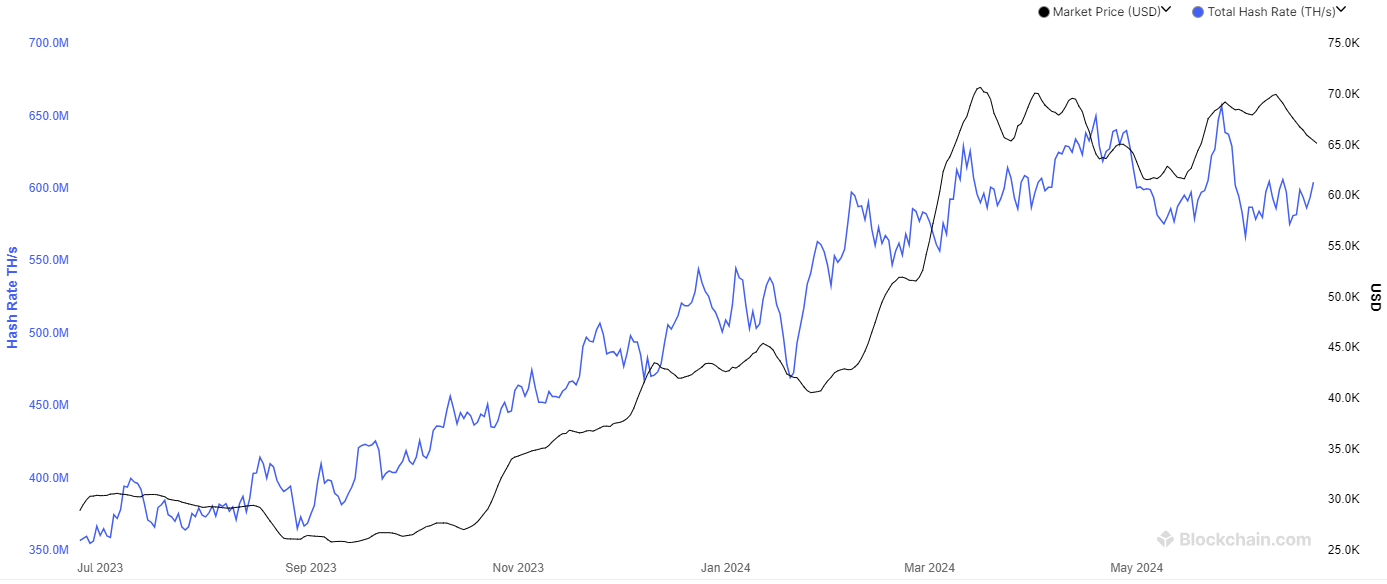
The global hash rate of BTC (defined as calculations performed per second/an indicator of network difficulty) is 605 exahashes per second (EH/s), down 7% WoW, and 4% MoM. The decrease in hash rates is positive for miners as their efficiency rates (BTC production per EH/s) are inversely linked to global hash rates.
Total Hash Rate (BTC)
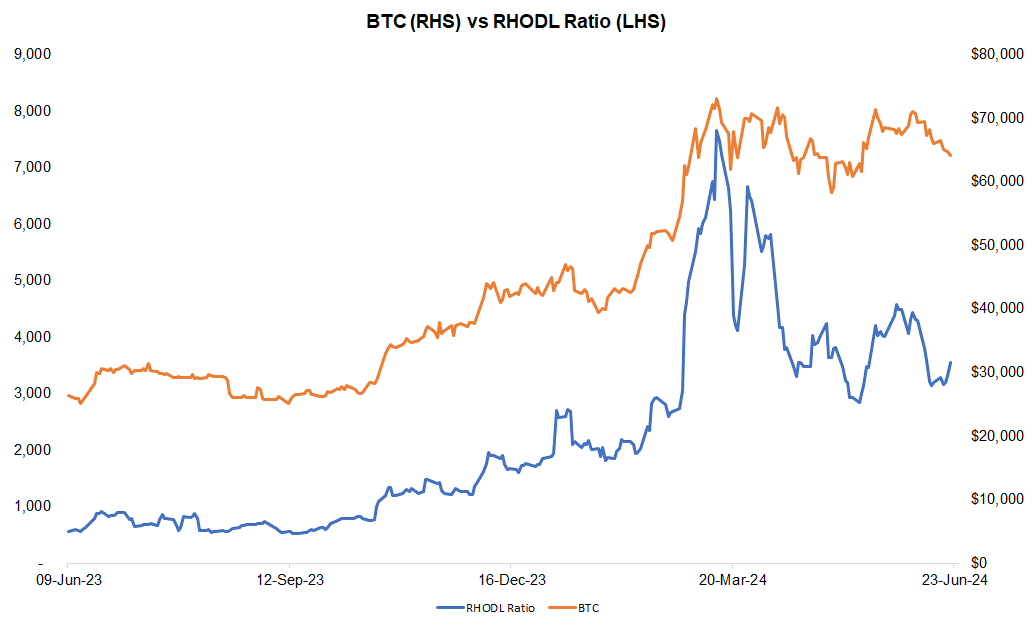
The Realized HODL ratio (RHODL), which gauges the activity of short-term holders relative to long-term holders, was up 11% WoW, and 303% YoY. We interpret the increase in RHODL as a sign of strengthening demand, suggesting potential for an uptick in near-term prices. Historically, BTC prices have moved in tandem with this ratio. By tracking RHODL, we believe we can identify potential turning points in BTC prices.
Source: FRC/ Various
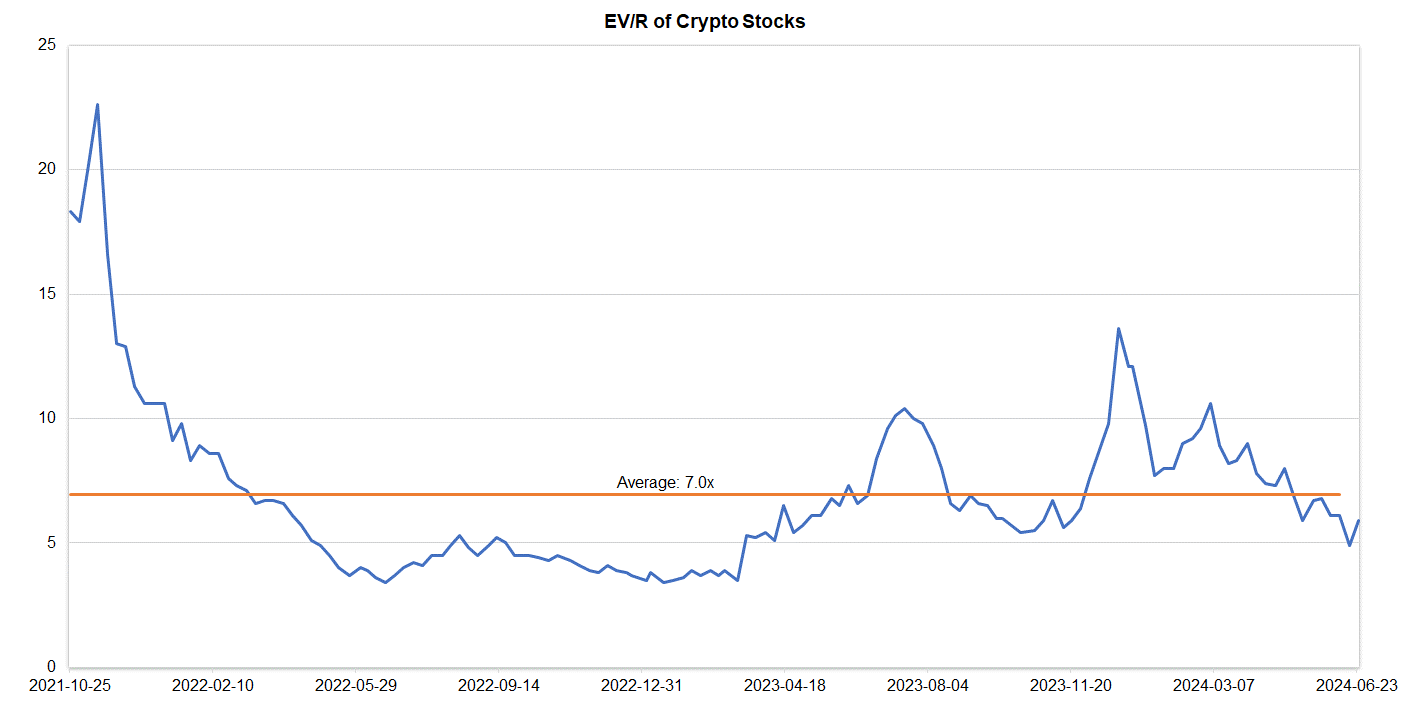
Companies operating in the crypto space are trading at an average EV/R of 5.9x (previously 4.9x).
Source: S&P Capital IQ/FRC
| June 24, 2024 |
|
| Crypto Stocks |
EV/Revenue |
| Argo Blockchain |
1.8 |
| BIGG Digital |
5.4 |
| Bitcoin Well |
0.8 |
| Canaan Inc. |
1.4 |
| CleanSpark Inc. |
12.8 |
| Coinbase Global |
14.1 |
| Galaxy Digital Holdings |
N/A |
| HIVE Digital |
3.7 |
| Hut 8 Mining Corp. |
8.2 |
| Marathon Digital Holdings |
10.5 |
| Riot Platforms |
5.0 |
| SATO Technologies |
1.6 |
| |
|
| Average |
5.9 |
| Median |
5.0 |
| Min |
0.8 |
| Max |
14.1 |
Source: S&P Capital IQ/FRC
Market Updates and Insights: Artificial Intelligence/AI
Last week, NVIDIA (NASDAQ: NVDA) momentarily claimed the title of the world's most valuable company by MCAP, surpassing both Microsoft (NASDAQ: MSFT) and Apple (NASDAQ: AAPL), thanks to the ongoing surge in AI technology. However, the chipmaker has since returned to third place.
Major AI indices are down 1% WoW on average (up 2% in the previous week), but up 14% YoY.
| June 24, 2024 |
|
|
| AI Indices |
WoW |
YoY |
| First Trust Nasdaq AI and Robotics ETF |
0.1% |
-4% |
| Global X Robotics & AI ETF |
-2.2% |
10% |
| Global X AI & Technology ETF |
-0.7% |
29% |
| iShares Robotics and AI Multisector ETF |
-1.3% |
4% |
| Roundhill Generative AI & Technology ETF |
-1.7% |
30% |
| Average |
-1.1% |
14% |
| Min |
-2.2% |
-4% |
| Max |
0.1% |
30% |
Source: FRC/Various
The following table highlights some of the most popular large-cap AI stocks. Shares of these companies are down 1.6% WoW on average, but up 124% YoY. Their average P/E is 36.6x vs the NASDAQ-100 Index’s average of 31.9x.
| AI Stocks |
WoW |
YoY |
P/E |
| Arista Networks |
-1.1% |
118% |
46.9 |
| Dell Technologies |
0.4% |
169% |
29.7 |
| Microsoft Corporation |
1.3% |
36% |
39.0 |
| NVIDIA Corp |
-11.2% |
191% |
73.9 |
| Micron Technology |
4.5% |
112% |
n/a |
| Palantir Technologies |
2.9% |
73% |
n/a |
| Qualcomm |
-7.3% |
72% |
28.3 |
| Super Micro Computer (SMCI) |
-3.4% |
282% |
50.3 |
| Taiwan Semiconductor Manufacturing |
-0.4% |
64% |
29.3 |
| Average |
-1.6% |
124% |
42.5 |
| Median |
-0.4% |
112% |
39.0 |
| Min |
-11.2% |
36% |
28.3 |
| Max |
4.5% |
282% |
73.9 |
Source: FRC/Various


