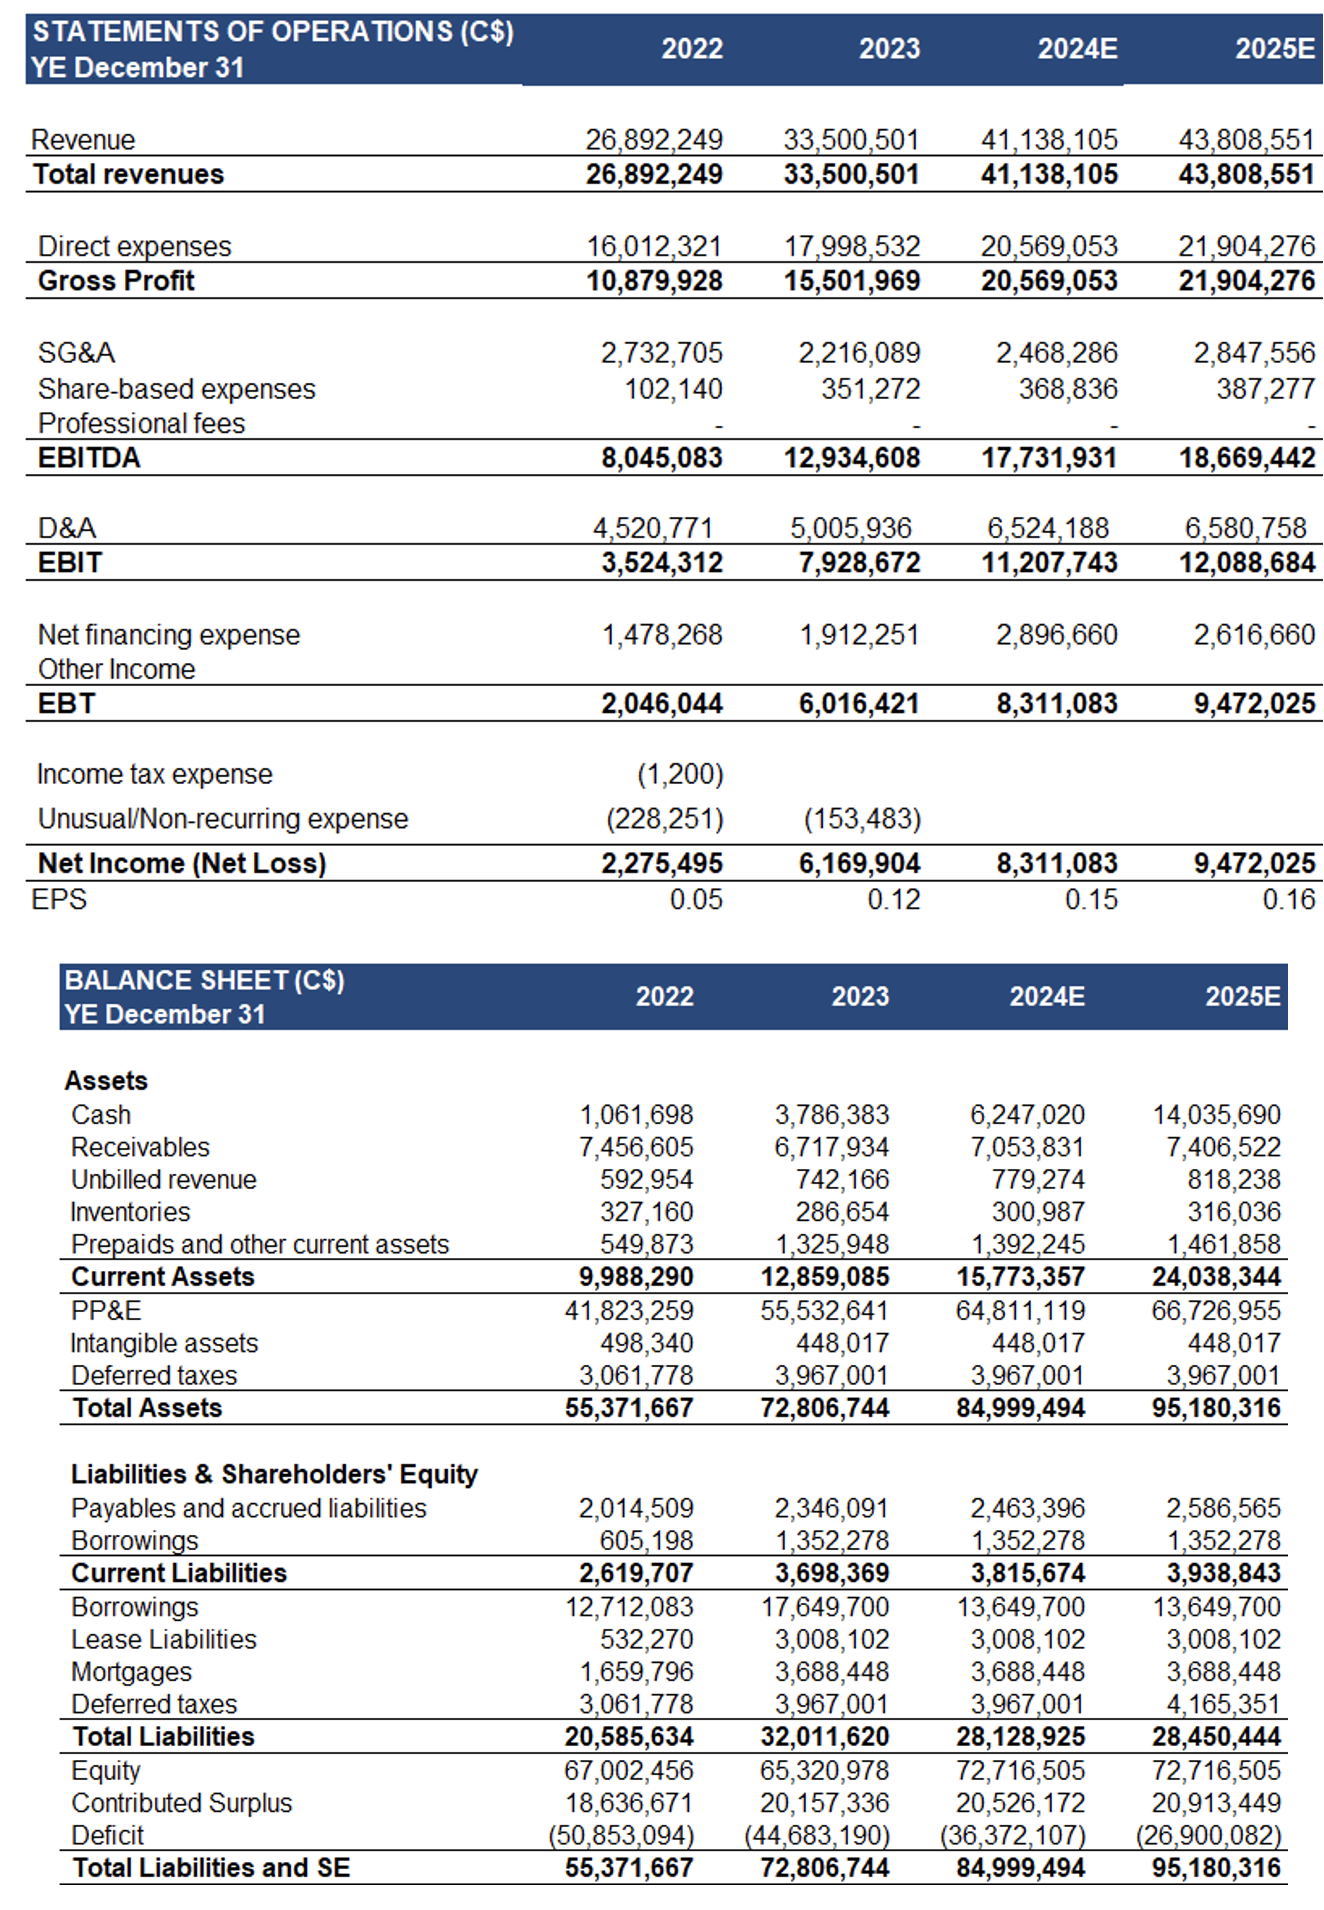
- EPS turned positive, beating our estimate by 25%, driven by higher than expected revenue and gross margins.
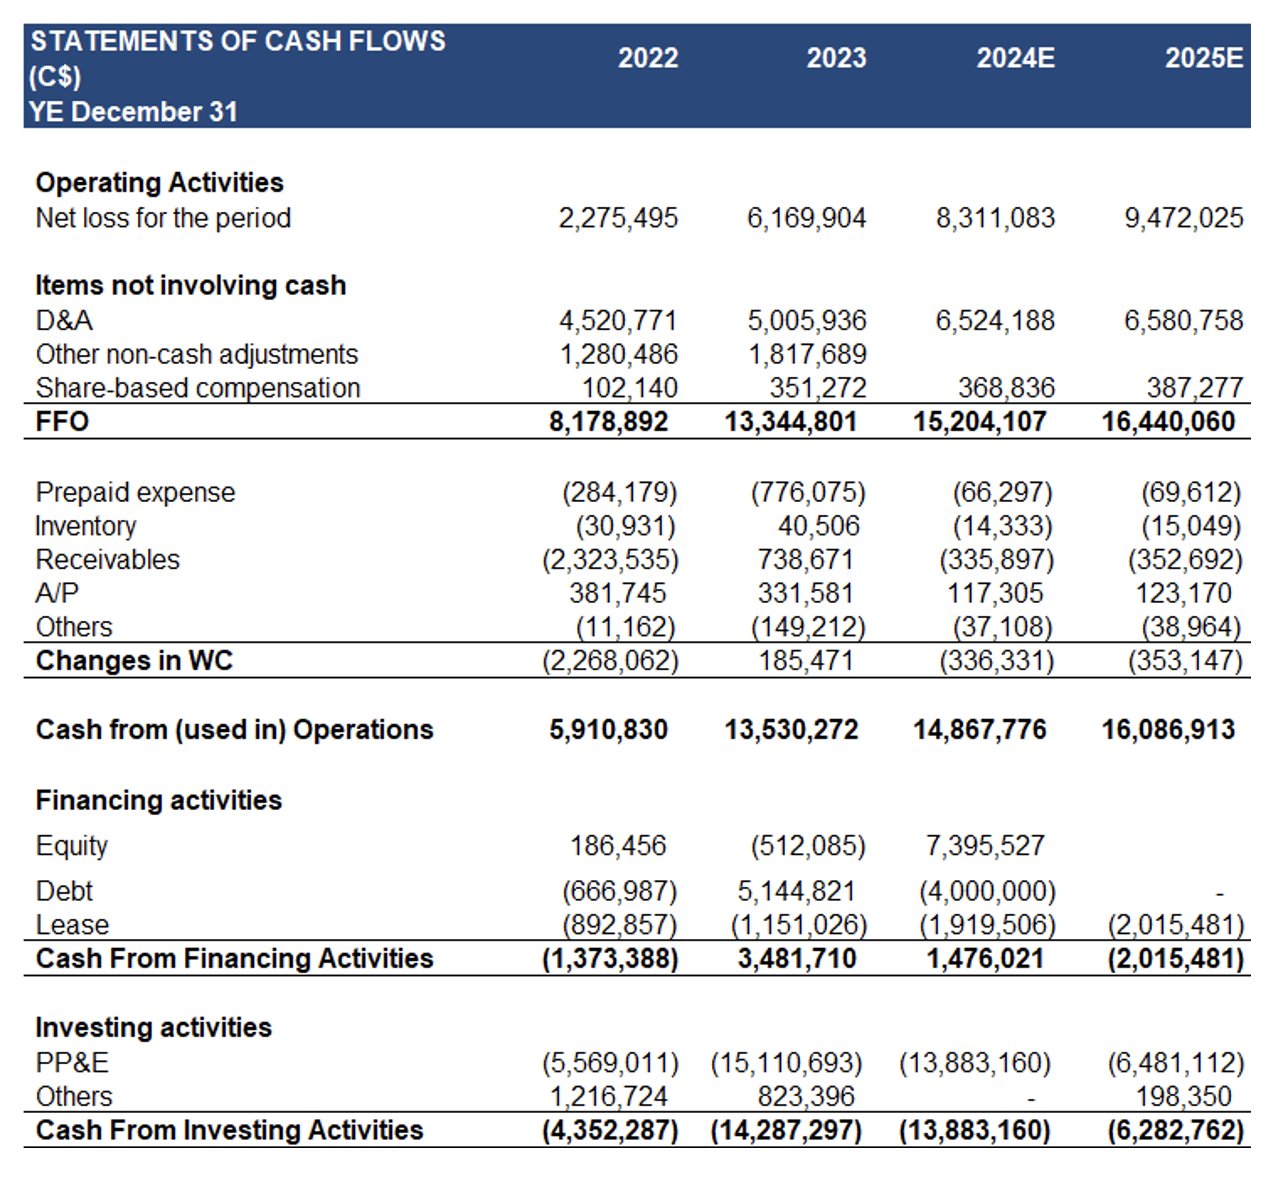
- In H1-2024, CAPEX increased 56% YoY to $10M, driven by heightened client demand necessitating new equipment purchases. The company is building a new facility in Fort St. John, B.C., for equipment storage and maintenance, as part of its expansion efforts in the province.
- Per consensus estimates, growth in North American oil and gas CAPEX will ease to 2.2% in 2024, down from 19% in 2023, driven by slower GDP growth, and higher lending rates. We believe the company's expanded rental equipment fleet will help mitigate the sector-wide slowdown. We anticipate 23% revenue growth in 2024 (previously 13%) vs 25% in 2023.
- As Q2 was stronger than expected, we are raising our fair value estimate, driven by higher near-term revenue/EPS estimates.

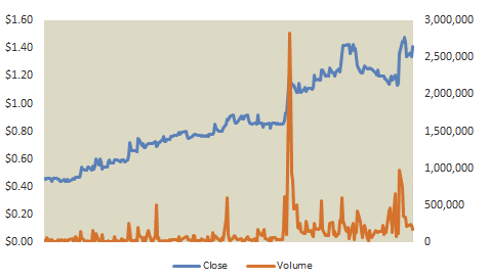
Price and Volume (1-year)
| |
YTD |
12M |
| E |
87% |
216% |
| TSX |
6% |
10% |
Enterprise vs Larger Players
E is up 216% YoY, and is the best performing stock on our list of oilfield services companies. Gross margins are higher than the sector average, while debt/capital is lower
Financials
In 2024, we anticipate E’s revenue will grow by 23%, outpacing sector growth by 8 pp
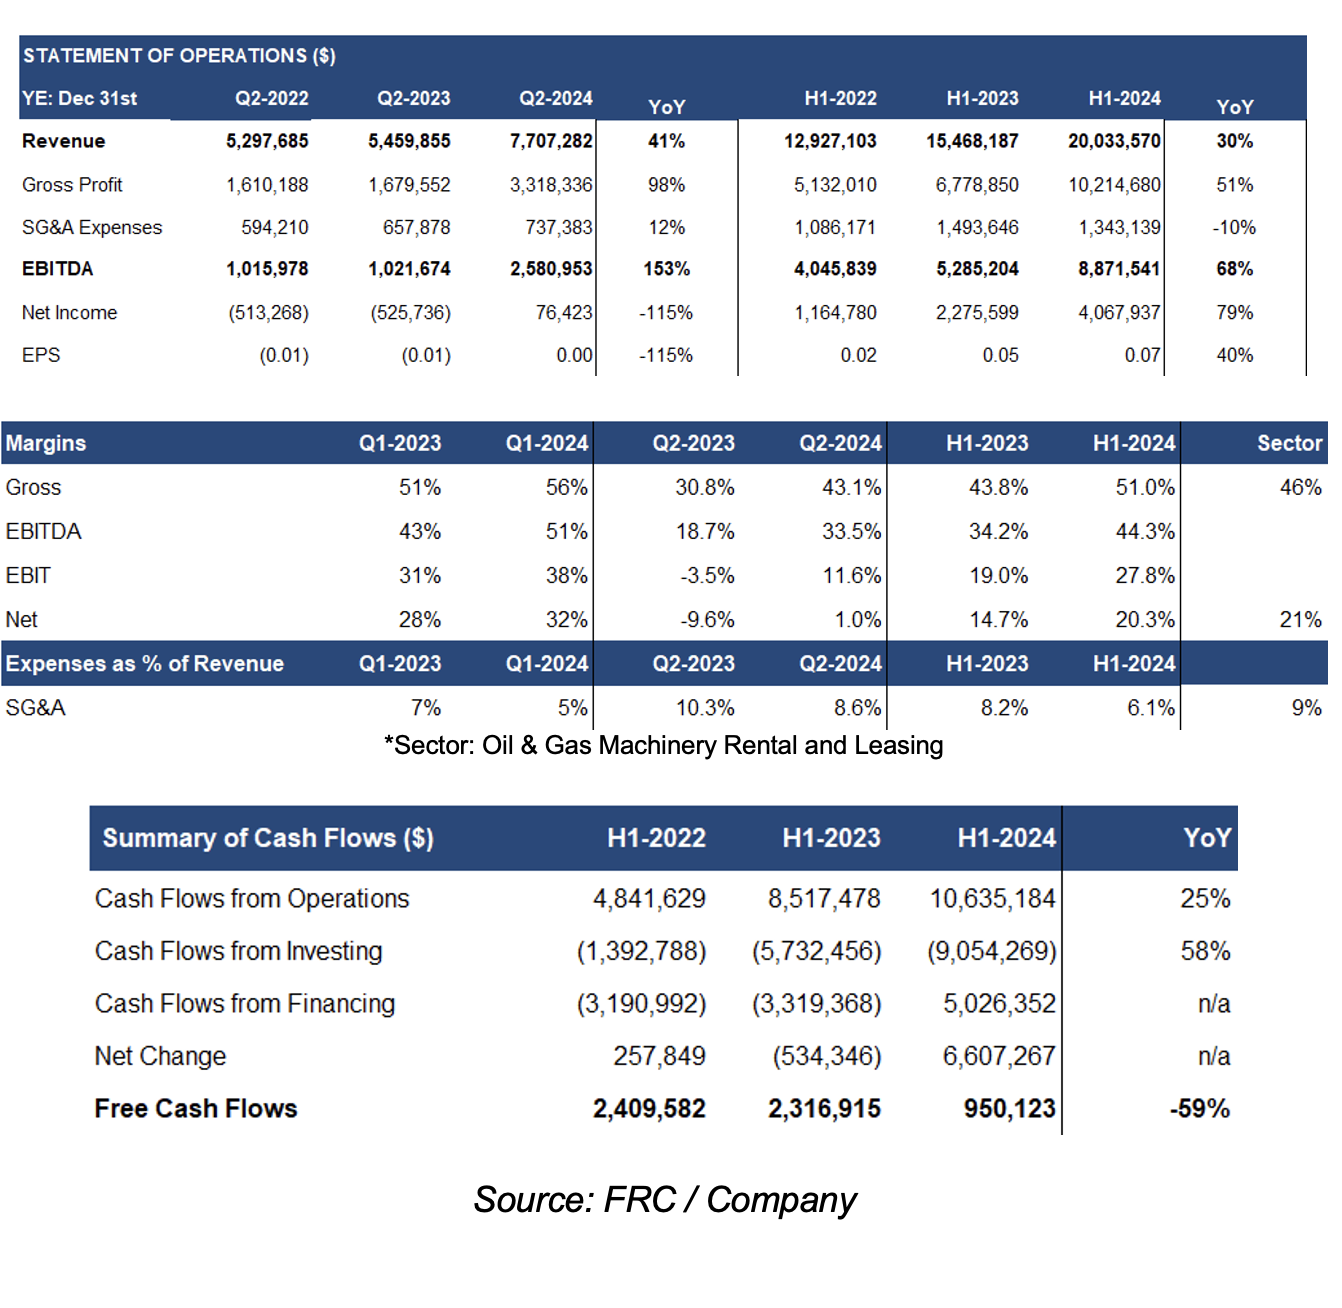
Q2-2024 revenue was up 41% YoY (Q1-2024: 23% YoY), beating our estimate by 9%. Gross margins improved by 12 pp YoY, and were 3 pp higher than our estimate
G&A expenses were up 12% YoY, and 9% higher than our estimate, primarily driven by new hires supporting expansion and business growth
EPS turned positive, beating our estimate by 25%
In H1-2024, CAPEX increased 56% YoY to $10M, driven by heightened client demand necessitating new equipment purchases
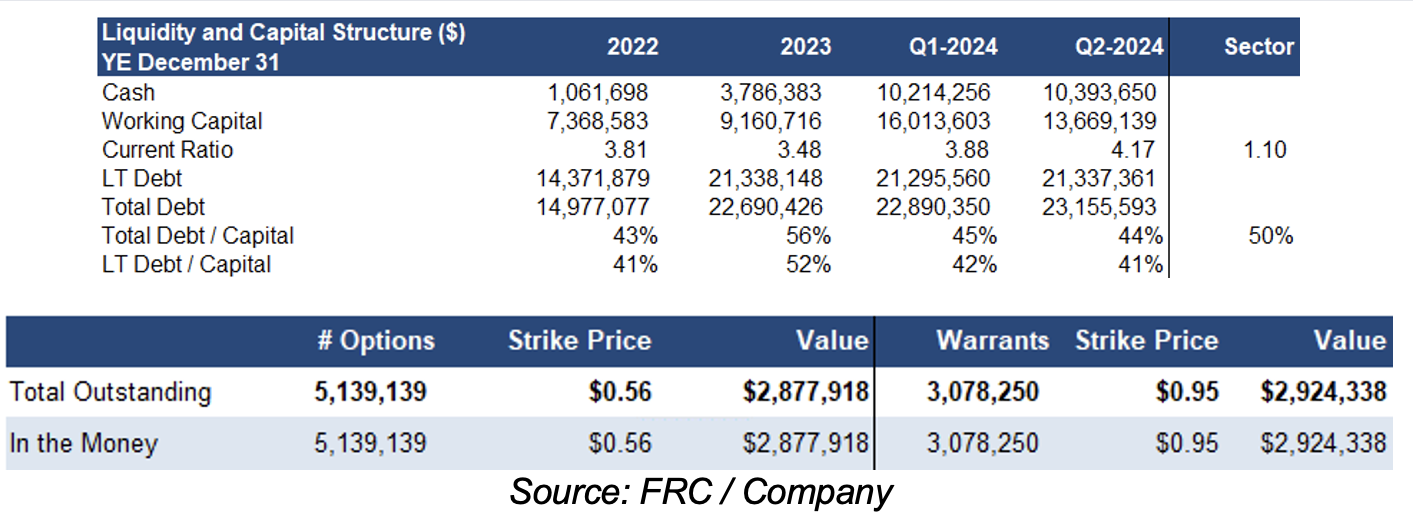
Debt/capital remained relatively flat QoQ. Can raise up to $6M from in-the-money options and
Oil & Gas Price Outlook
Consensus oil price forecasts (near and long-term) are well above historic averages, implying a positive outlook for the oilfield services sector
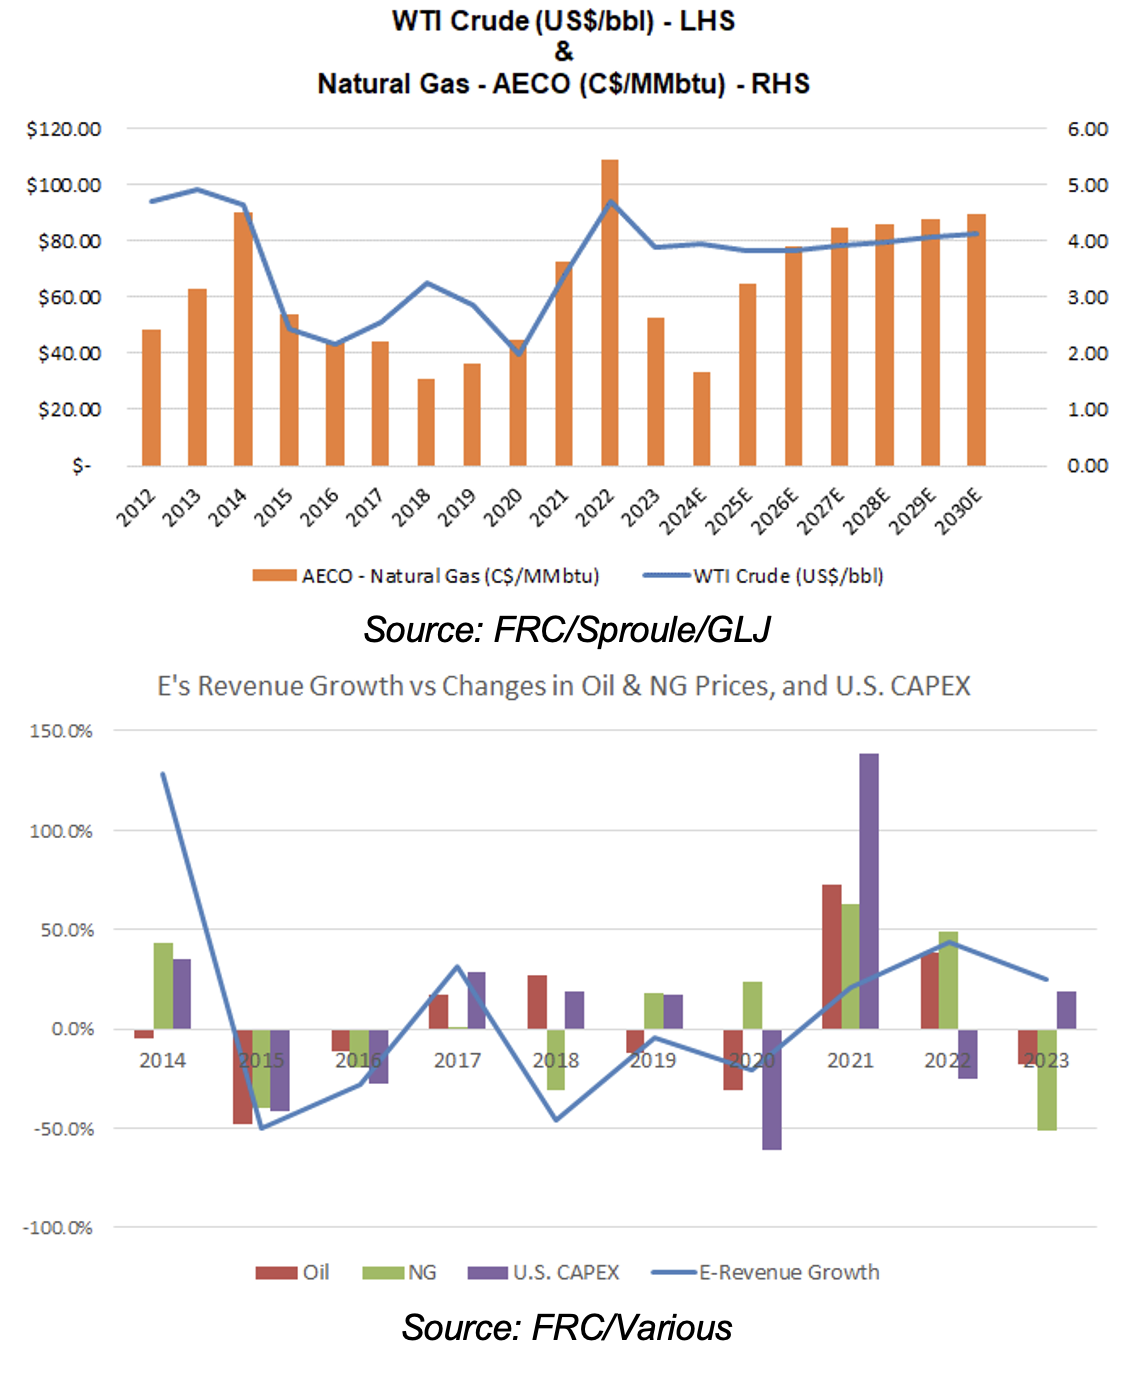
E's revenue generally tracks changes in oil and gas prices, and sector CAPEX spending. Historically, a 1% increase in oil and gas prices, and CAPEX spending, has led to a 2.4% increase in E's revenue
Conversely, a 1% decrease in these factors has resulted in a 1.2% decline in E’s revenue
FRC Projections and Valuation
As Q2 revenue and gross margins were higher than expected, we are raising our 2024 and 2025 estimates
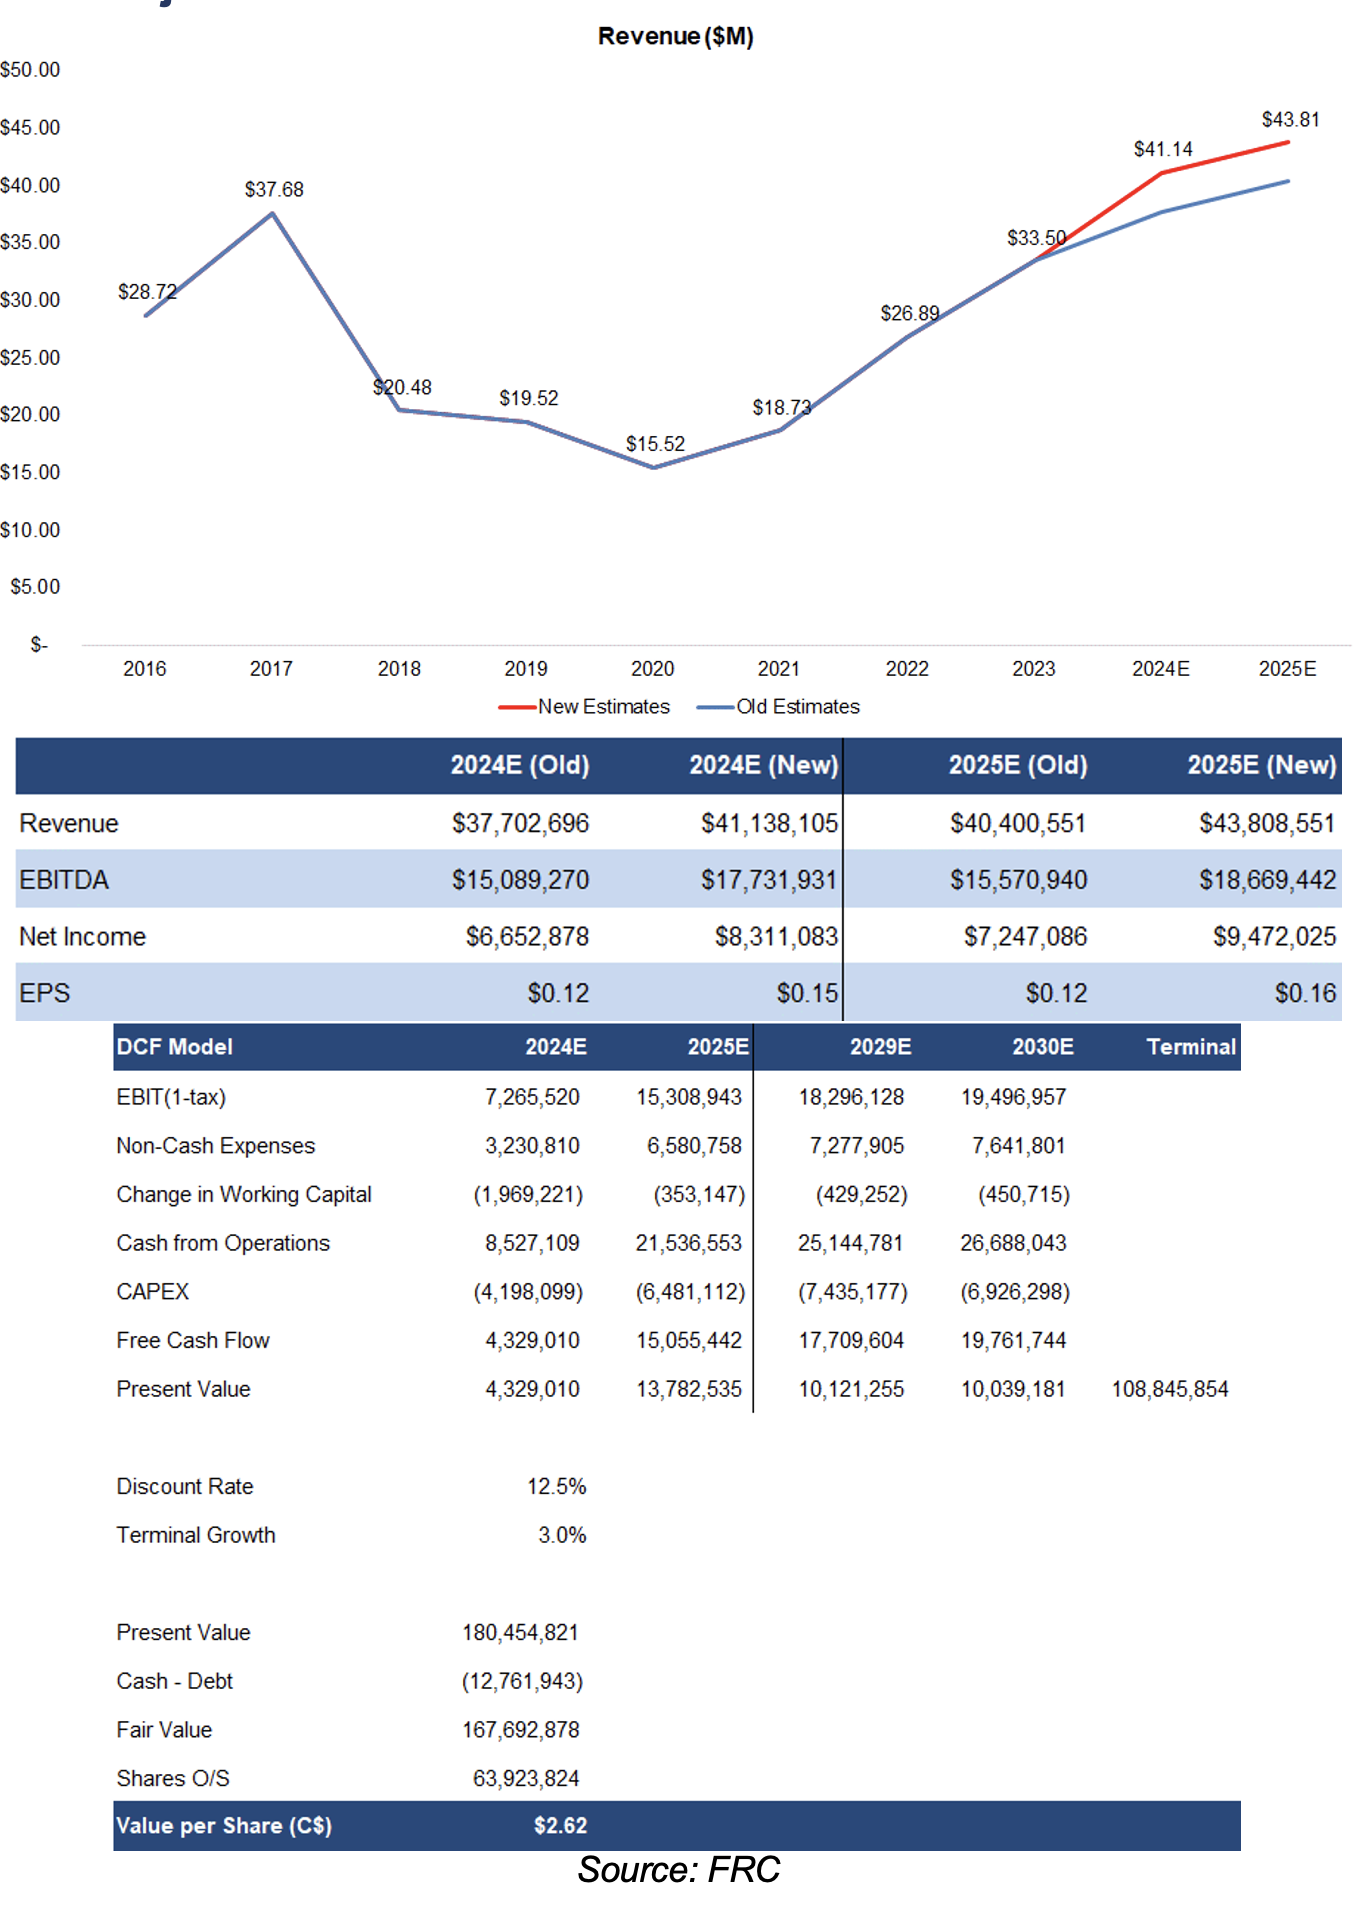
As a result, our DCF valuation increased from $2.44 to $2.62/share
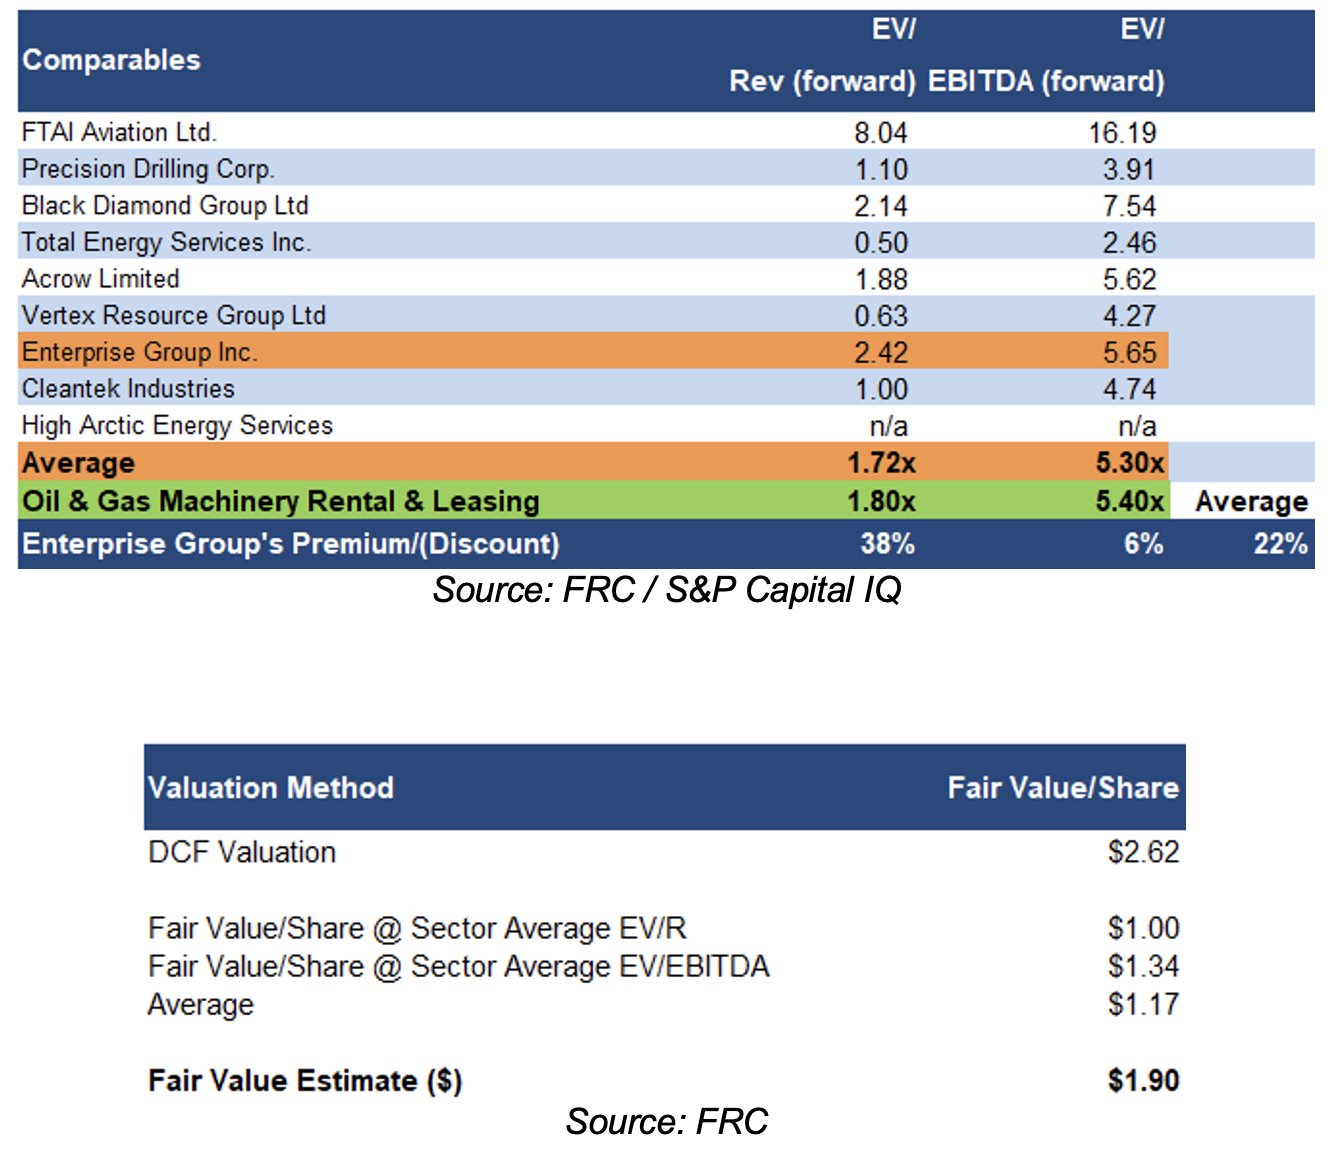
Sector multiples are up 6% since our previous report in May 2024. E’s forward EV/Revenue and EV/EBITDA are 22% (previously 21%) higher than sector average
We believe E’s premium is justified, given its higher margins, lower debt/capital, and higher 2024 revenue growth estimate
As a result of our revised DCF valuation and updated sector multiples, our fair value estimate increased from $1.62 to $1.90/share
We are maintaining our BUY rating, and raising our fair value estimate from $1.62 to $1.90/share (the average of our DCF and comparables valuations). Upcoming catalyst includes revenue growth stemming from the deployment of newly acquired equipment.
Risks
We are maintaining our risk rating of 3 (Average)
We believe the company is exposed to the following key risks (not exhaustive):
- The oil/gas field services market is highly dependent on oil and gas prices
- Operates in a competitive space
- As the company uses leverage, a downturn in business activities can negatively impact its balance sheet
Appendix
