Strategic M&A by a Near-Term Gold Producer / A New Metric for Predicting Bitcoin Prices
Published: 5/6/2024
Author: Sid Rajeev, B.Tech, CFA, MBA

Key Highlights
- Last week, equities strengthened amid a weaker US$
- An accretive acquisition by a near-term gold producer under coverage
- Major updates from a near-term graphite producer under coverage
- Introducing a new metric for predicting Bitcoin (BTC) prices
- Last month, companies on our Top Picks list were up 0.4% on
average vs 0.1% for the benchmark (TSXV)
Index
- Commentary on Companies Under Coverage: Gain insights into companies under coverage that experienced significant developments last week, along with our analysts' commentary and actionable takeaways.
- FRC Top Picks: Explore the top five weekly performers among our list of top picks.
- Weekly Mining Commentary: Gain a broader perspective on global equity and metal markets, major developments, trends affecting the mining sector, along with our analysts' predictions, and metal prices forecasts.
- Weekly Crypto Commentary: Stay updated with the latest developments in the crypto markets, including detailed analysis of key parameters such as crypto prices, global market capitalization, hash rates, and valuations of publicly traded crypto companies.
Contango Ore, Inc. (CTGO)
PR Title: Announces acquisition of HighGold Mining Inc. (TSXV: HIGH/MCAP: $41M)
Analyst Opinion: Positive – CTGO is acquiring HIGH in an all-share deal valued at US$37M, representing a 59% premium over HIGH’s 20-day volume-weighted average prices. HIGH is advancing a high-grade gold project in coastal Alaska, with resources totaling 1.1 Moz AuEq at 9+ gpt. As of December 31, 2023, HIGH had C$5.5M in working capital. We consider this acquisition highly accretive, especially since HIGH’s project can be advanced to production quickly at a relatively low cost. In addition, we estimate that CTGO is paying just US$35/oz vs US$75+/oz for comparable projects. CTGO and its partner, Kinross Gold (NYSE: KGC), are on track to commence production at their Manh Choh gold project (also in Alaska) in Q3-2024. This project is capable of producing 225 Koz per year (67.5 Koz for CTGO). We will publish a detailed update on the latest acquisition, and its impact on our fair value estimate for CTGO.
South Star Battery Metals Corp. (STSBF, STS.V)
PR Title: Announces the first sale of natural flake graphite concentrates from its Santa Cruz graphite mine in Brazil
Analyst Opinion: Positive – STS has secured a deal with an undisclosed American industrial graphite customer for the purchase of 100 tonnes of concentrates, with the potential for ongoing negotiations for regular purchases. Additionally, STS is actively engaging with other graphite customers to expand its buyer network. Management aims to commence commercial production by August 2024.
Starcore International Mines Ltd. (SAM.TO, SHVLF)
PR Title: Reports final 2023 exploration results at its Ajax property, Golden Triangle area, B.C.
Analyst Opinion: Positive – Promising results; 10 out of 28 quartz vein sites returned elevated values of up to 37.89 g/t gold, and 100+ g/t silver. SAM has already delineated a large molybdenum resource on the project. Management is planning follow up exploration this year.
HydroGraph Clean Power Inc. (HG.CN, HGCPF)
PR Title: HG to supply pristine graphene to Volfpack Energy for solar power battery storage
Analyst Opinion: FRC Opinion: Positive – Based out of Sri Lanka, Volfpack is an energy tech company claiming to have developed a supercapacitor with four times the capacity of traditional capacitors. Volfpack has selected HG’s graphene as the foundational material for its supercapacitors. While we refrain from speculating on if and when Volfpack will gain traction with its supercapacitors, we perceive this partnership as an endorsement of HG’s technology. HG is currently in discussions with 50+ potential customers, with 20+ actively testing their products
FRC Top Picks
The following table shows last week’s top five performers among our Top Picks, including four junior resource companies, and an Adtech company. The top performer, World Copper (TSXV: WCU), was up 23%. WCU is advancing multiple copper projects in the Americas.
| Top Five Weekly Performers | WoW Returns |
| World Copper Ltd. (WCU.V) | 23.1% |
| Southern Silver Exploration Corp. (SSV.V) | 18.4% |
| Kidoz Inc. (KIDZ.V) | 17.0% |
| Noram Lithium Corp. (NRM.V) | 12.5% |
| Fortune Minerals Limited (FT.TO) | 10.0% |
| * Past performance is not indicative of future performance (as of May 6, 2024) |
Source: FRC
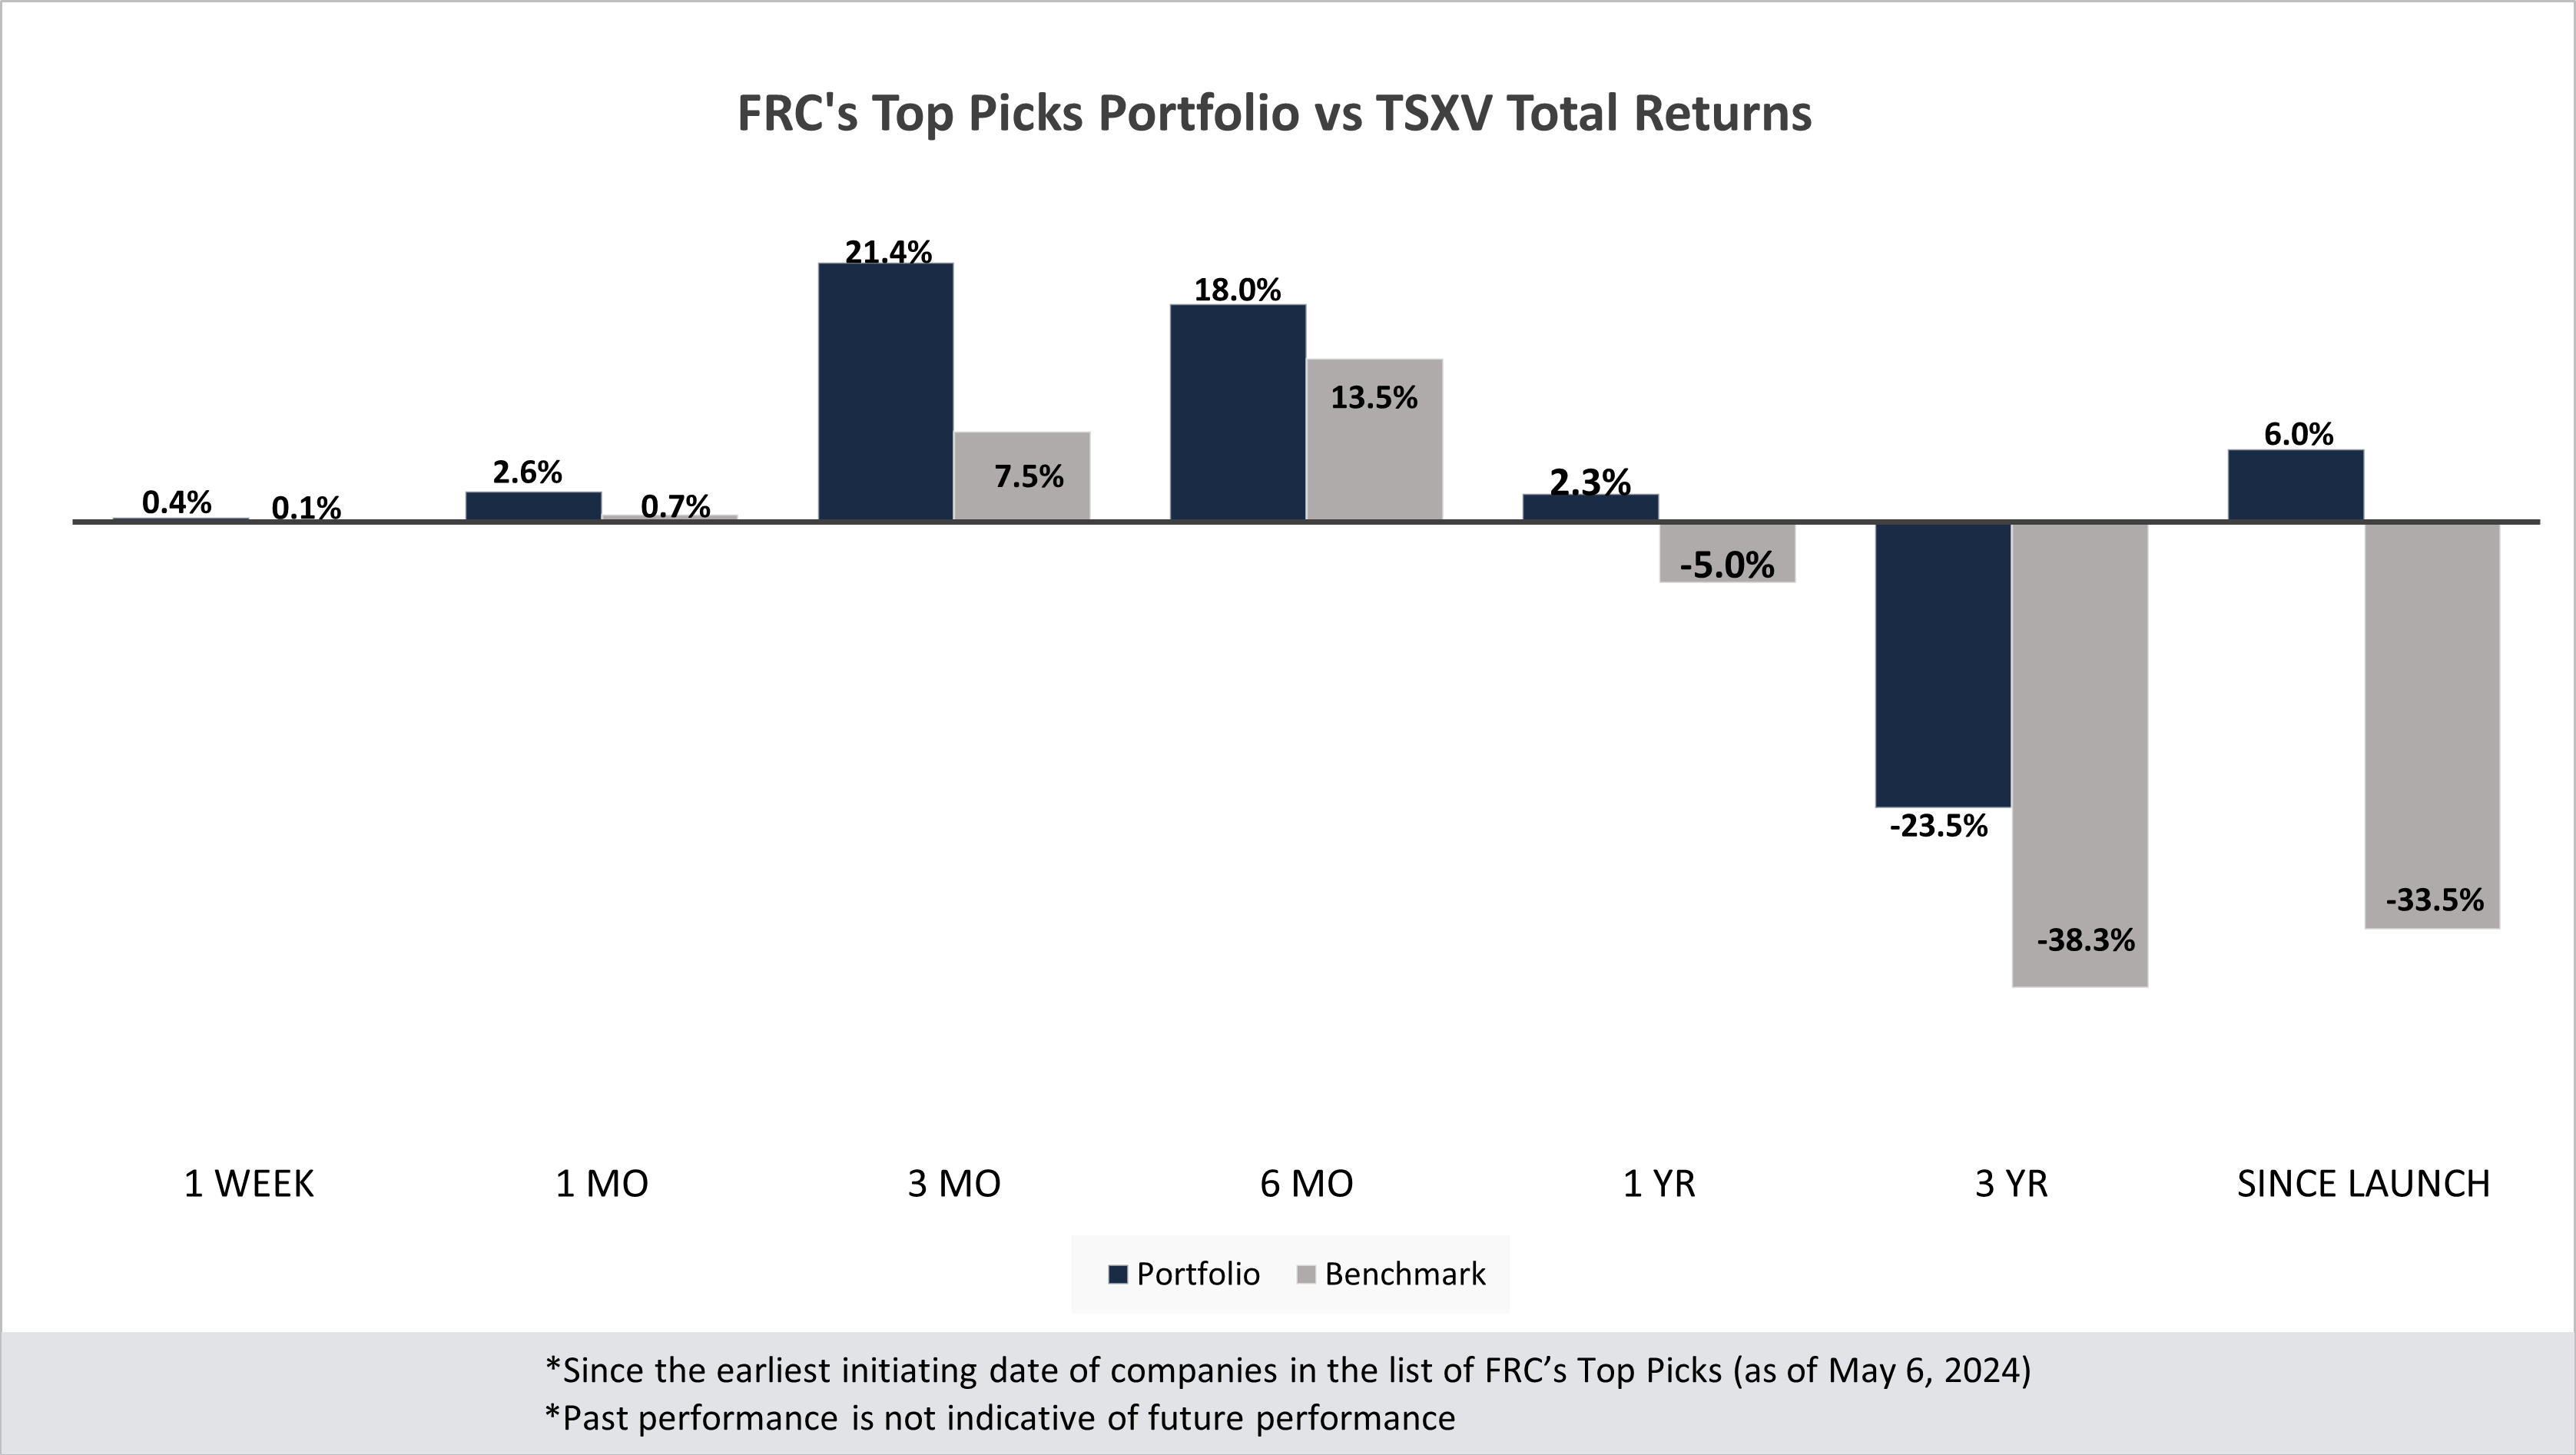
Last week, companies on our Top Picks list were up 0.4% on average vs 0.1% for the benchmark (TSXV). Our top picks have outperformed the benchmark in all of the seven time periods listed below.
Performance by Sector
| Total Return | 1 Week | 1 mo | 3 mo | 6 mo | 1 yr | 3 yr | Since launch |
| Mining | -0.9% | 4.3% | 23.2% | 18.4% | -2.9% | -47.1% | 9.1% |
| Cannabis | N/A | N/A | N/A | N/A | N/A | -43.4% | -23.6% |
| Tech | 17.0% | -10.0% | 170.0% | 50.0% | 0.0% | -31.4% | -3.8% |
| Special Situations (MIC) | 1.7% | -1.8% | -2.5% | 15.3% | 23.7% | -15.4% | -11.1% |
| Private Companies | N/A | N/A | N/A | N/A | 6.7% | 20.5% | 30.5% |
| Portfolio (Total) | 0.4% | 2.6% | 21.4% | 18.0% | 2.3% | -23.5% | 6.0% |
| Benchmark (Total) | 0.1% | 0.7% | 7.5% | 13.5% | -5.0% | -38.3% | -33.5% |
| Portfolio (Annualized) | - | - | - | - | 2.3% | -8.6% | 0.6% |
| Benchmark (Annualized) | - | - | - | - | -5.0% | -14.9% | -3.9% |
1. Since the earliest initiating date of companies in the list of Top Picks (as of May 6, 2024) 2. Green (blue) indicates FRC's picks outperformed (underperformed) the benchmark. 3. Past performance is not indicative of future performance. 4. Our complete list of top picks (updated weekly) can be viewed here: Top Picks List
Weekly Mining Commentary
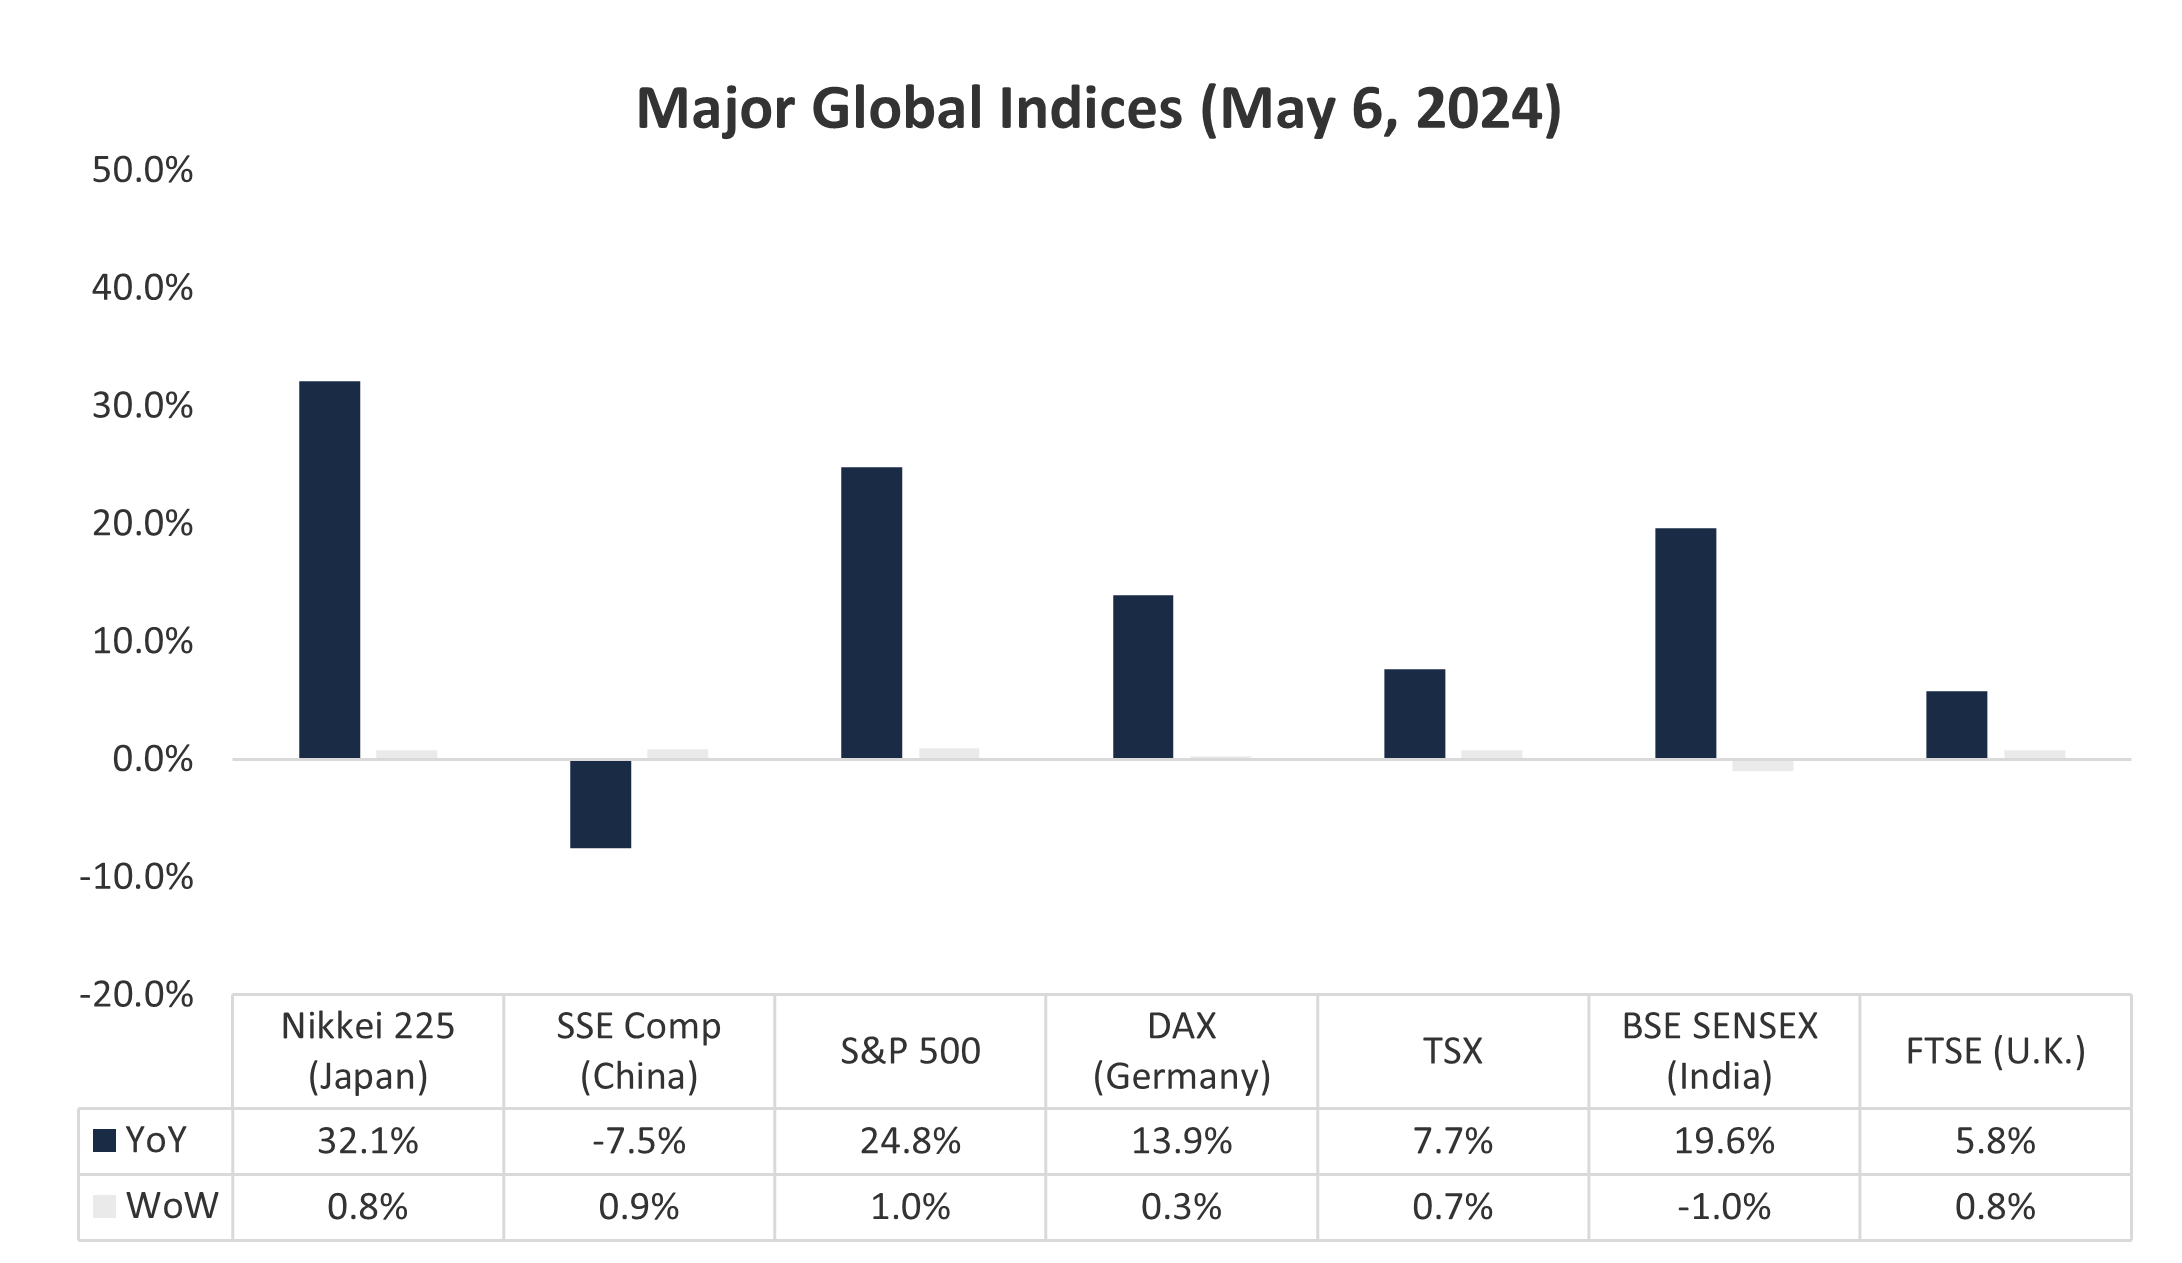
Last week, global equity markets were up 0.5% on average (up 1.5% in the previous week). Despite the Fed confirming no imminent interest rate cuts, sluggish jobs data and rising unemployment spurred equity markets higher, and the US$ lower.
Source: FRC / Various
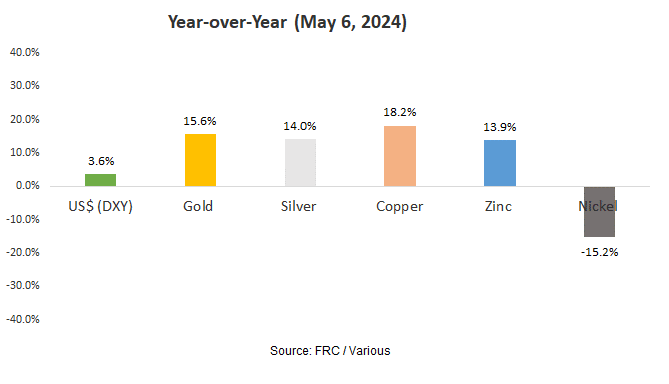
Last week, metal prices were down 1.1% on average (up 0.4% in the previous week).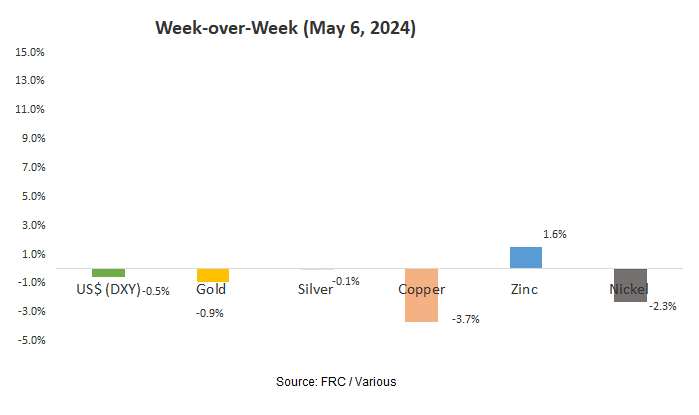
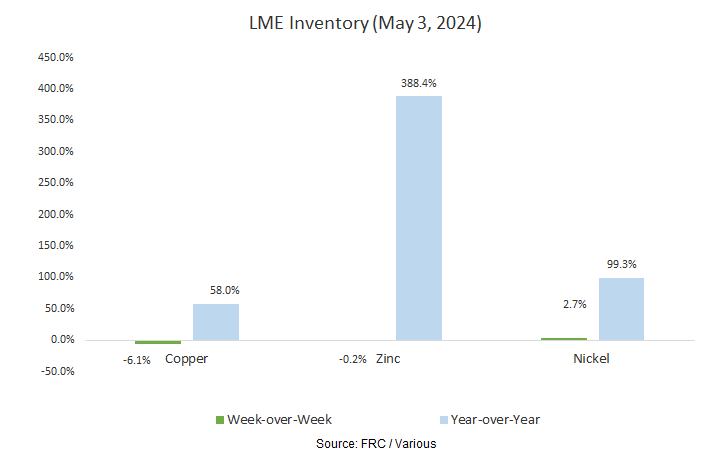
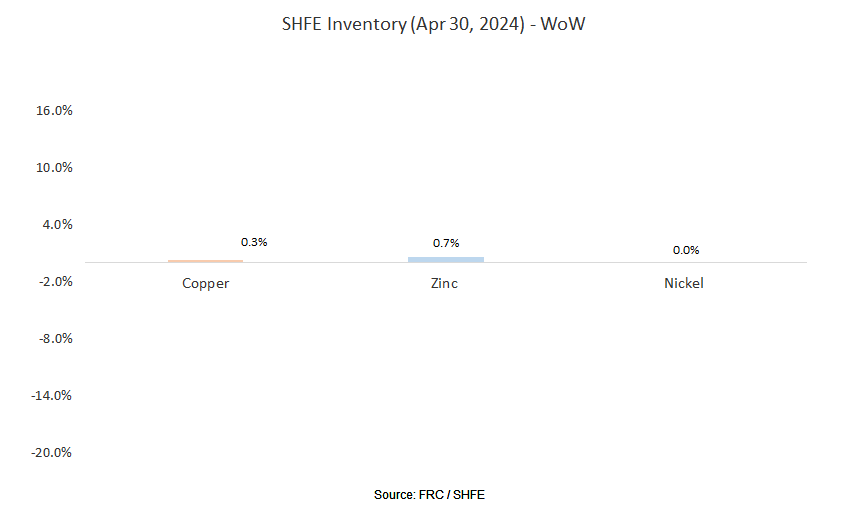
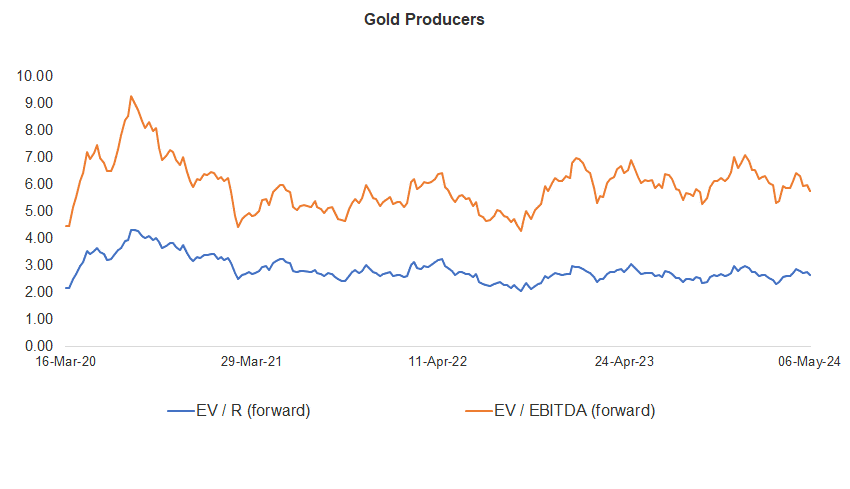
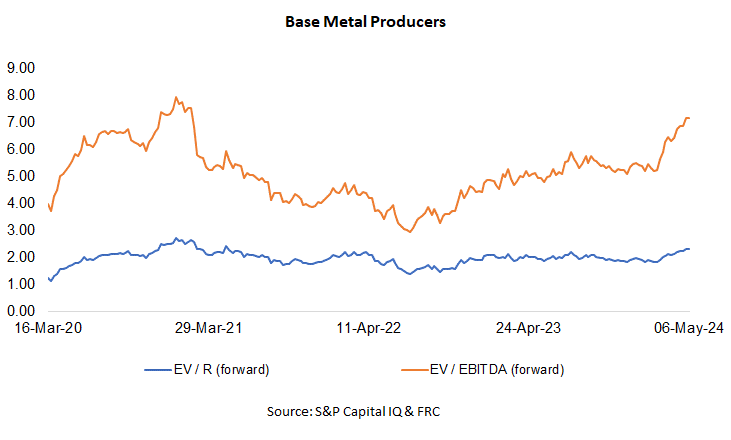
Gold producer valuations were down 3.4% last week (up 0.9% in the prior week); base metal producers were up 0.1% last week (up 3.9% in the prior week). On average, gold producer valuations are 20% lower compared to the past three instances when gold surpassed US$2k/oz.
| 22-Apr-24 | 29-Apr-24 | 06-May-24 | |||||
| Gold Producers | EV / R (forward) | EV / EBITDA (forward) | EV / R (forward) | EV / EBITDA (forward) | EV / R (forward) | EV / EBITDA (forward) | |
| 1 | Barrick | 3.11 | 6.60 | 3.10 | 6.58 | 3.09 | 6.63 |
| 2 | Newmont | 3.09 | 7.29 | 3.35 | 7.80 | 3.17 | 7.37 |
| 3 | Agnico Eagle | 4.52 | 8.80 | 4.53 | 8.58 | 4.44 | 8.49 |
| 4 | AngloGold | 2.18 | 5.02 | 2.15 | 4.96 | 2.09 | 4.74 |
| 5 | Kinross Gold | 2.36 | 5.49 | 2.34 | 5.36 | 2.29 | 5.16 |
| 6 | Gold Fields | 3.01 | 5.52 | 3.09 | 5.60 | 2.84 | 5.19 |
| 7 | Sibanye | 0.76 | 3.75 | 0.74 | 3.68 | 0.71 | 3.53 |
| 8 | Hecla Mining | 4.68 | 17.18 | 4.43 | 16.55 | 4.16 | 15.53 |
| 9 | B2Gold | 1.89 | 3.74 | 1.84 | 3.66 | 1.75 | 3.50 |
| 10 | Alamos | 4.79 | 8.78 | 4.92 | 9.36 | 4.85 | 9.14 |
| 11 | Harmony | 1.70 | 4.88 | 1.74 | 5.10 | 1.67 | 4.88 |
| 12 | Eldorado Gold | 2.52 | 5.28 | 2.48 | 4.93 | 2.32 | 4.75 |
| Average (excl outliers) | 2.72 | 5.92 | 2.75 | 5.96 | 2.66 | 5.76 | |
| Min | 0.76 | 3.74 | 0.74 | 3.66 | 0.71 | 3.50 | |
| Max | 4.79 | 17.18 | 4.92 | 16.55 | 4.85 | 15.53 | |
| Industry (three year average) | 110.70 | 116.70 | 110.70 | 116.70 | 110.70 | 116.70 | |
| Base Metal Producers | EV / R (forward) | EV / EBITDA (forward) | EV / R (forward) | EV / EBITDA (forward) | EV / R (forward) | EV / EBITDA (forward) | |
| 1 | BHP Group | 2.98 | 5.70 | 2.89 | 5.55 | 2.91 | 5.60 |
| 2 | Rio Tinto | 2.25 | 4.82 | 2.32 | 4.96 | 2.32 | 4.93 |
| 3 | South32 | 1.43 | 6.70 | 1.52 | 7.12 | 1.57 | 7.40 |
| 4 | Glencore | 0.44 | 6.01 | 0.45 | 6.11 | 0.44 | 5.87 |
| 5 | Anglo American | 1.66 | 4.97 | 2.03 | 6.05 | 2.00 | 5.95 |
| 6 | Teck Resources | 2.65 | 5.98 | 3.05 | 7.06 | 3.00 | 6.93 |
| 7 | First Quantum | 4.19 | 14.04 | 3.93 | 13.30 | 3.97 | 13.44 |
| Average (excl outliers) | 2.23 | 6.89 | 2.31 | 7.16 | 2.32 | 7.16 | |
| Min | 0.44 | 4.82 | 0.45 | 4.96 | 0.44 | 4.93 | |
| Max | 4.19 | 14.04 | 3.93 | 13.30 | 3.97 | 13.44 | |
Source: S&P Capital IQ & FRC
We are maintaining our metal price forecasts.
Weekly Crypto Commentary
Prices of mainstream/popular cryptos were up 7% on average last week (down 1% in the previous week).
| May 6, 2024 | ||
| Cryptocurrencies | 1-Week | 1-Year |
| Bitcoin | 9% | 119% |
| Binance Coin | 5% | 83% |
| Cardano | 3% | 22% |
| Ethereum | 4% | 62% |
| Polkadot | 10% | 27% |
| XRP | 6% | 20% |
| Polygon | 3% | -26% |
| Solana | 14% | 592% |
| AVERAGE | 7% | 112% |
| MIN | 3% | -26% |
| MAX | 14% | 592% |
| Indices | ||
| Canadian | 1-Week | 1-Year |
| BTCC | 4% | 125% |
| BTCX | 3% | 135% |
| EBIT | 3% | 132% |
| FBTC | 4% | 36% |
| U.S. | 1-Week | 1-Year |
| BITO | -3% | 63% |
| BTF | 3% | 72% |
| IBLC | 0% | 58% |
Source: FRC/Yahoo Finance
The global MCAP of cryptos is US$2.51T, down 7% MoM, but up 104%YoY.
Total Crypto Market Cap Chart

Source: CoinGecko
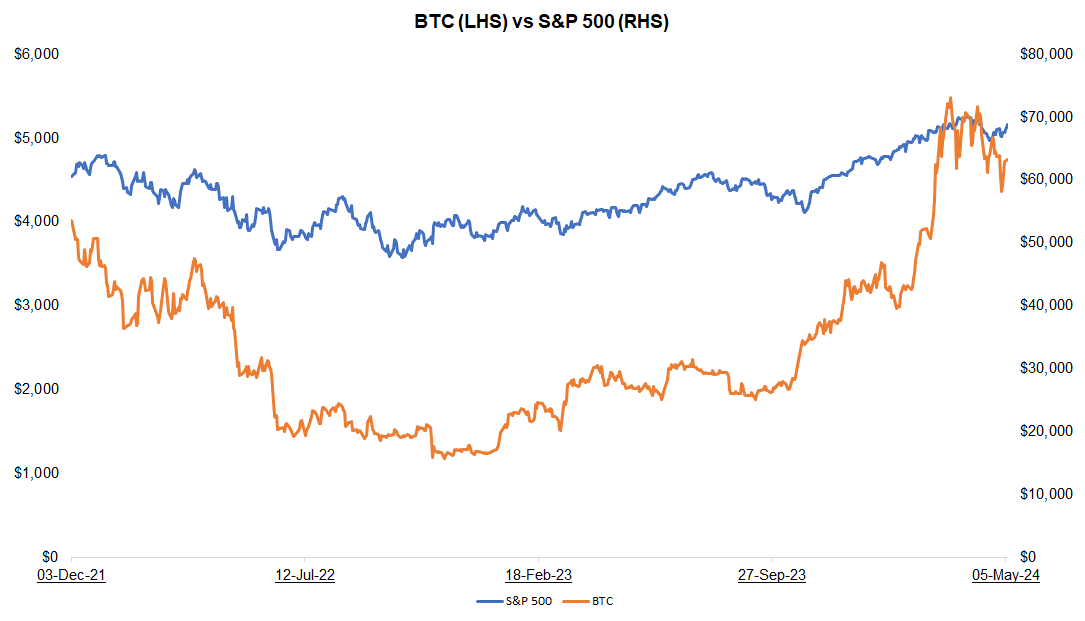
Last week, BTC was up 9%, while the S&P 500 was up 1%.
Source: FRC/ Yahoo Finance
The global hash rate of BTC (defined as calculations performed per second/an indicator of network difficulty) is 600 exahashes per second (EH/s), down 6% WoW, but up 1% MoM. The decrease in hash rates is negative for miners as their efficiency rates (BTC production per EH/s) are inversely linked to global hash rates.
Total Hash Rate (BTC) 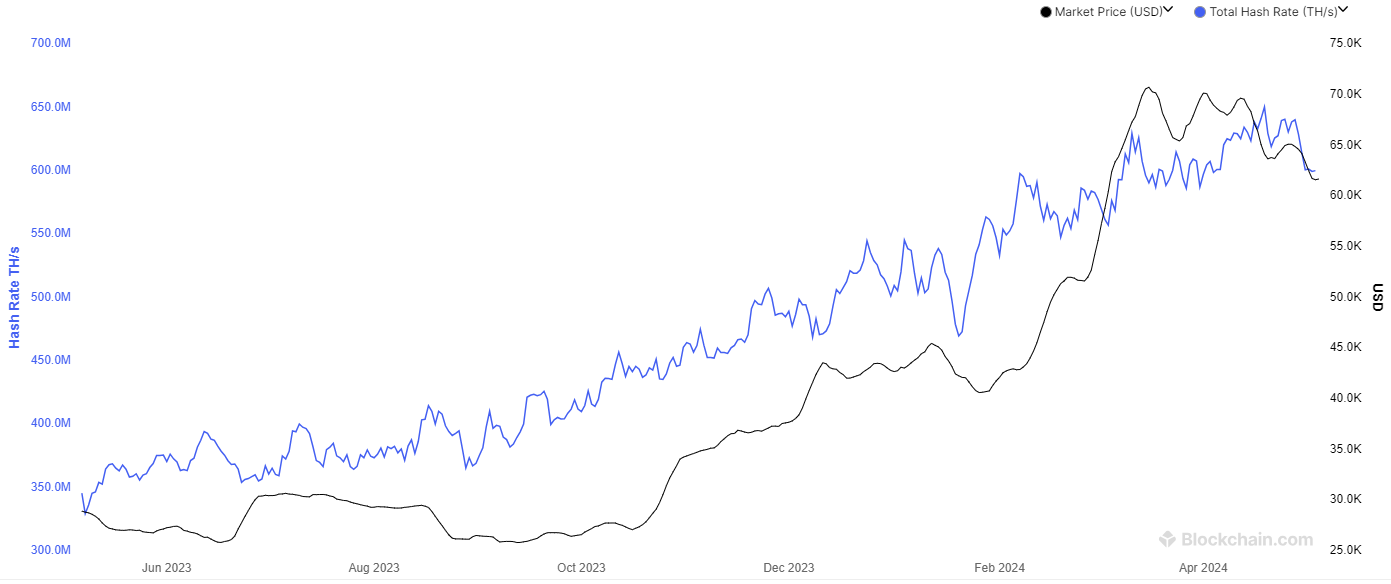
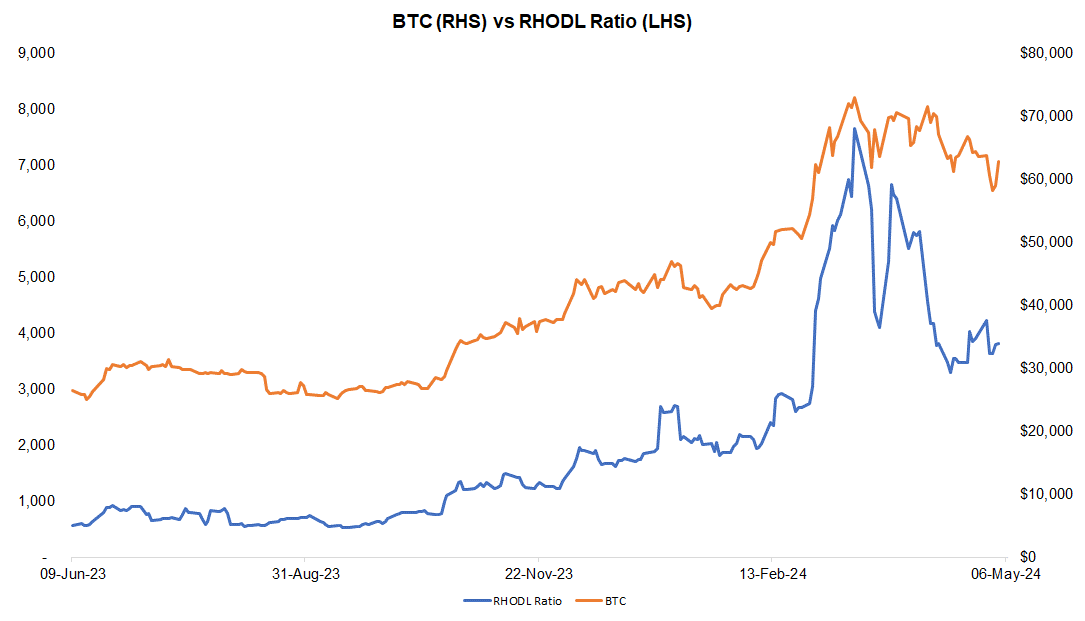
The following chart tracks BTC prices vs the Realized HODL ratio (RHODL), which gauges the activity of short-term holders relative to long-term holders. A rising RHODL indicates increasing short-term buying. Historically, BTC prices have moved in tandem with this ratio. By tracking the RHODL, we believe we can identify potential turning points in BTC prices.
Source: FRC/ Various
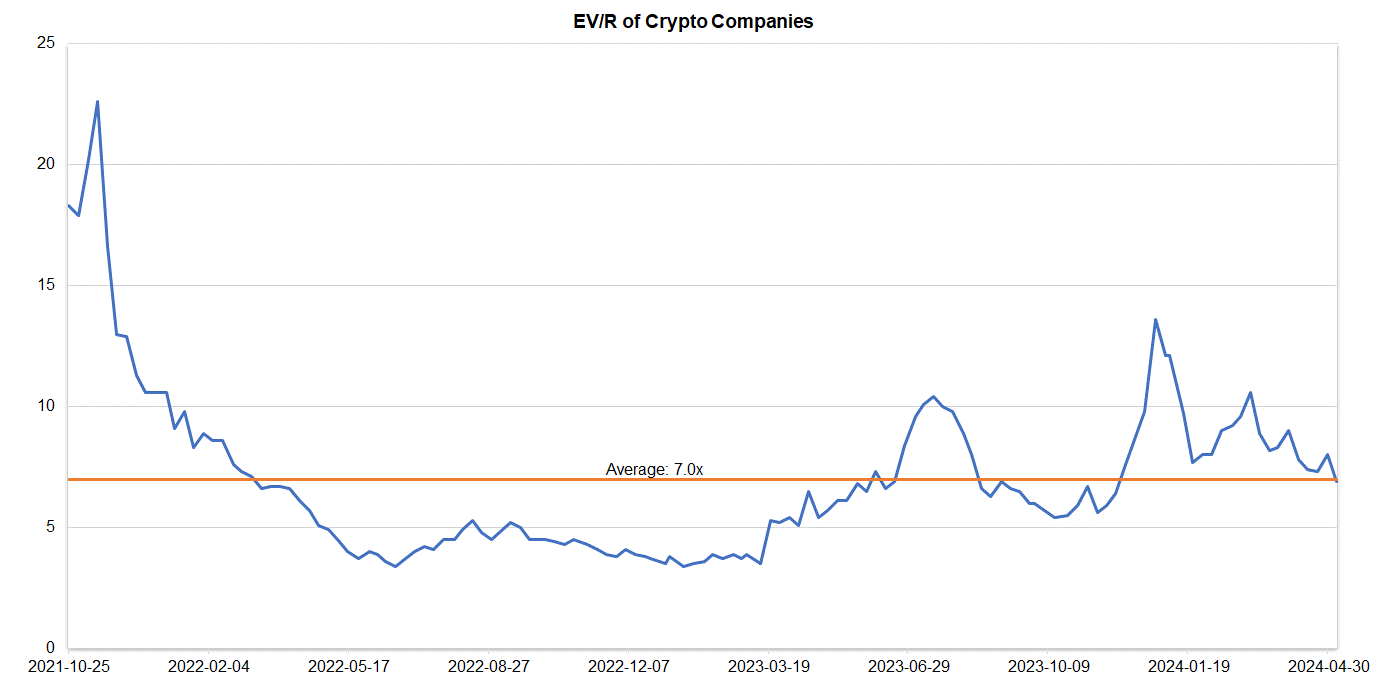
Companies operating in the crypto space are trading at an average EV/R of 6.9x (previously 8.0x).
Source: S&P Capital IQ/FRC
| May 6, 2024 | ||
| Crypto Companies | Ticker | TEV/Revenue |
| Argo Blockchain | LSE: ARB | 2.7 |
| BIGG Digital | CSE: BIGG | 7.8 |
| Bitcoin Well | TSXV: BTCW | 0.7 |
| Canaan Inc. | NASDAQ: CAN | 0.5 |
| CleanSpark Inc. | NasdaqCM:CLSK | 16.8 |
| Coinbase Global | NASDAQ: COIN | 13.9 |
| Galaxy Digital Holdings | TSX: GLXY | N/A |
| HIVE Digital | TSXV:HIVE | 2.8 |
| Hut 8 Mining Corp. | TSX: HUT | 8.2 |
| Marathon Digital Holdings | NASDAQ: MARA | 12.3 |
| Riot Platforms | NASDAQ: RIOT | 8.2 |
| SATO Technologies | TSXV: SATO | 2.0 |
| AVERAGE | 6.9 | |
| MEDIAN | 7.8 | |
| MINIMUM | 0.5 | |
| MAXIMUM | 16.8 |
Source: S&P Capital IQ/FRC


