Rate Cut Forecasts / M&A Activity
Published: 4/22/2024
Author: FRC Analysts

Summary
- Last week, gold, silver, and oil prices retreated due to easing tensions in the Middle East
- Our revised predictions for the timing of rate cuts by the Fed and BoC
- Recent M&A activity suggests a favorable trend in the junior gold/silver sector
- Shares of an Adtech company under coverage were up 11% WoW
- Last month, companies on our Top Picks list were up 13% on average vs 2% for the benchmark (TSXV)
Index
- FRC Top Picks: Explore the top five weekly performers among our list of top picks.
- Commentary on Companies Under Coverage: Gain insights into companies under coverage that experienced significant developments last week, along with our analysts' commentary and actionable takeaways.
- Weekly Mining Commentary: Gain a broader perspective on global equity and metal markets, major developments, trends affecting the mining sector, along with our analysts' predictions, and metal prices forecasts.
- Weekly Crypto Commentary: Stay updated with the latest developments in the crypto markets, including detailed analysis of key parameters such as crypto prices, global market capitalization, hash rates, and valuations of publicly traded crypto companies.
N/A
PR Title: Raises US$15M, and announces a long-term agreement for the sale of concentrates from its Zancudo project
Analyst Opinion: Funds will be used towards a 10,000 m drill program to potentially upgrade inferred resources to the indicated category. DSLV is on schedule to advance the project to production this year. The company has also secured an offtake agreement with Trafigura, a prominent global commodities trading company, for the sale of its concentrates. A recently completed Preliminary Economic Assessment (PEA) returned robust economics, with an ATNPV5% of US$206M, and a very high AT-IRR of 287%, using US$1,800/oz gold, and US$22/oz silver.
Blue Sky Uranium Corp. (BSK.V, BKUCF)
PR Title: Announces a $1M equity financing
Analyst Opinion: A recent PEA had reported an AT-NPV8% of US$228M, and a high AT-IRR of 39%, using US$75/lb U3O8 vs the spot price of US$89/lb. BSK is trading at just 5% of the NPV. The company is planning resource expansion and upgrade drilling, along with engineering studies, before completing a prefeasibility study.
FRC Top Picks
The following table shows last week’s top five performers among our Top Picks, including four junior resource companies, and an Adtech company. The top performer, Kidoz Inc. (TSXV: KIDZ), was up 11%. The company’s year-end financials are due before the end of this month.
| Top Five Weekly Performers | WoW Returns |
| Kidoz Inc. (KIDZ.V) | 11.4% |
| Rio2 Limited (RIO.V) | 8.1% |
| South Star Battery Metals Corp. (STS.V) | 7.5% |
| Sirios Resources Inc. (SOI.V) | 7.1% |
| Sabre Gold Mines Corp. (SGLD.TO) | 6.1% |
| * Past performance is not indicative of future performance (as of Apr 22, 2024) |
Source: FRC
Last month, companies on our Top Picks list were up 13% on average vs 2% for the benchmark (TSXV). Our top picks have outperformed the benchmark in five out of the seven time periods listed below. Junior resource stocks, comprising 65% of our list of top picks, have exhibited a notable revival, as evidenced by our top picks portfolio outperforming its benchmark in four out of the last five weeks.
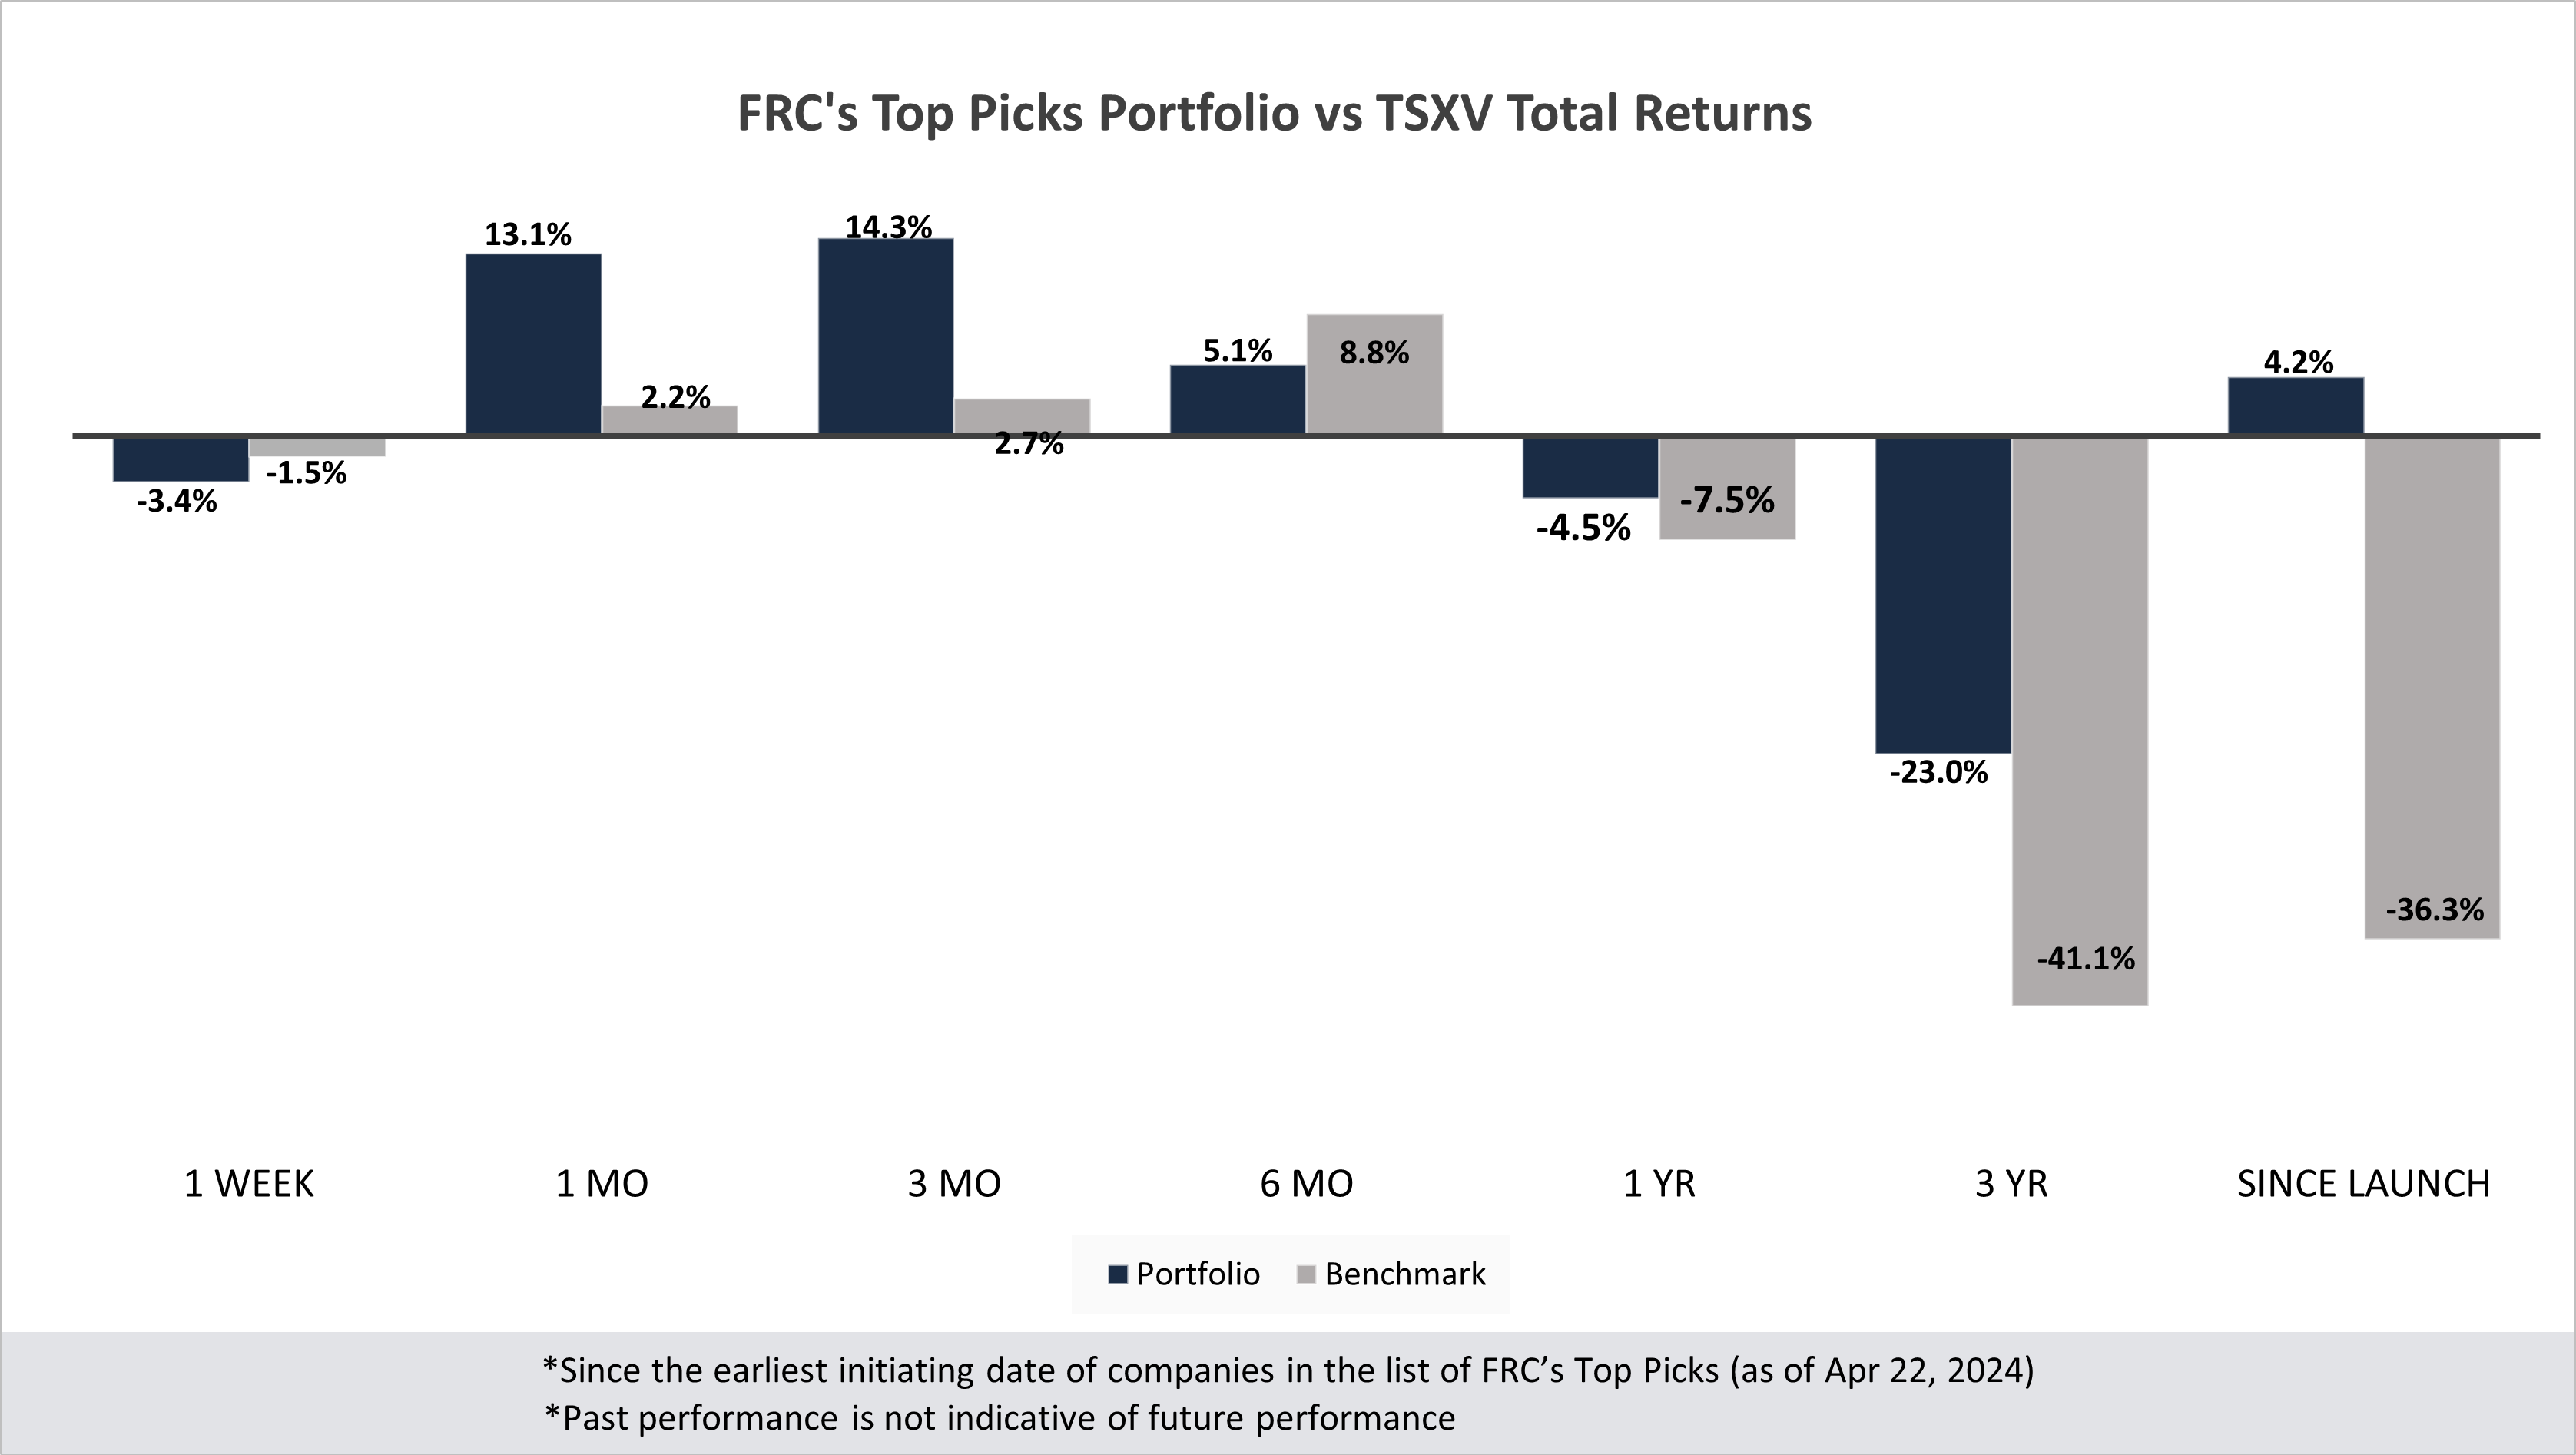
| Total Return | 1 Week | 1 mo | 3 mo | 6 mo | 1 yr | 3 yr | Since launch |
| Mining | -4.7% | 16.1% | 18.1% | 2.3% | -13.3% | -46.1% | 6.0% |
| Cannabis | N/A | N/A | N/A | N/A | N/A | -42.2% | -23.6% |
| Tech | 11.4% | 36.1% | 50.0% | 29.0% | 16.7% | -32.6% | -3.9% |
| Special Situations (MIC) | -1.0% | 1.3% | 4.1% | 17.3% | 22.2% | -14.9% | -12.1% |
| Private Companies | N/A | N/A | N/A | N/A | 6.7% | 20.5% | 30.5% |
| Portfolio (Total) | -3.4% | 13.1% | 14.3% | 5.1% | -4.5% | -23.0% | 4.2% |
| Benchmark (Total) | -1.5% | 2.2% | 2.7% | 8.8% | -7.5% | -41.1% | -36.3% |
| Portfolio (Annualized) | - | - | - | - | -4.5% | -8.3% | 0.4% |
| Benchmark (Annualized) | - | - | - | - | -7.5% | -16.2% | -4.3% |
1. Since the earliest initiating date of companies in the list of Top Picks (as of Apr 22, 2024)
2. Green (blue) indicates FRC's picks outperformed (underperformed) the benchmark.
3. Past performance is not indicative of future performance.
4. Our complete list of top picks (updated weekly) can be viewed here: Top Picks List
Weekly Mining Commentary
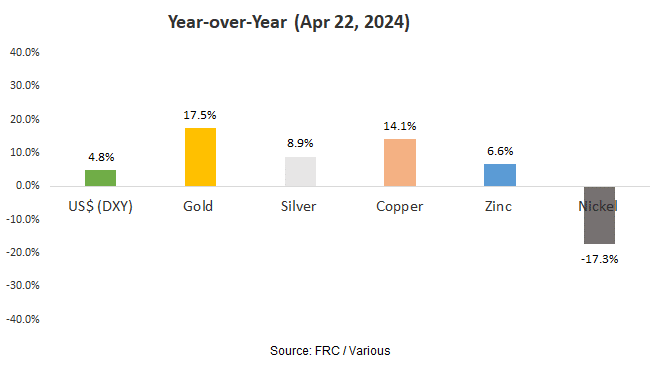
Last week, global equity markets were down 1.0% on average (down 1.0% in the previous week as well). Gold, silver, and oil prices retreated due to easing tensions in the Middle East. The S&P 500 was down 2.2% amid robust jobs data, and hawkish comments from the Fed. We have revised our forecast for the Fed's first rate cut, from June to Q4. We anticipate the BOC will cut its rate in June.
Source: FRC / Various
Last week, metal prices were up 1.6% on average (up 4.0% in the previous week).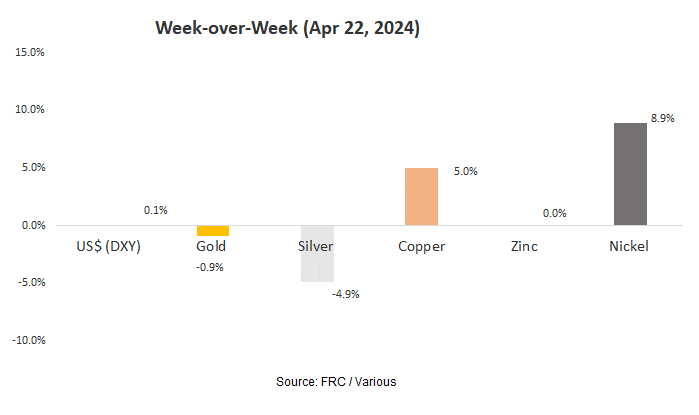
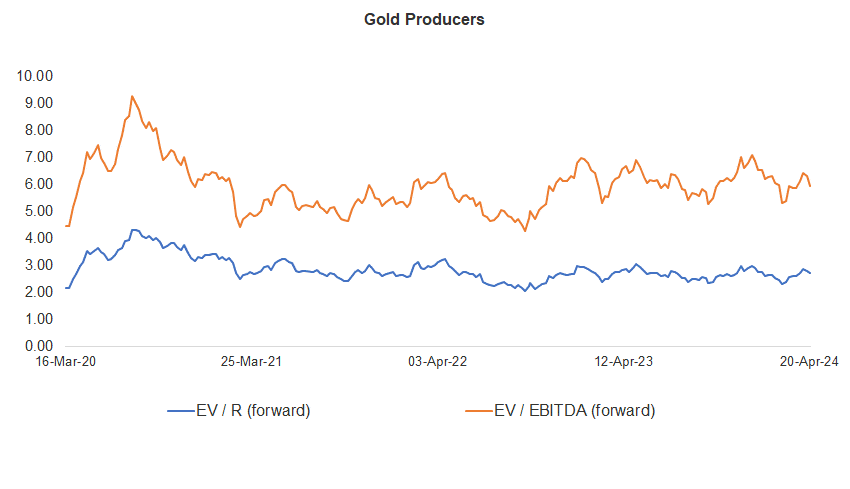
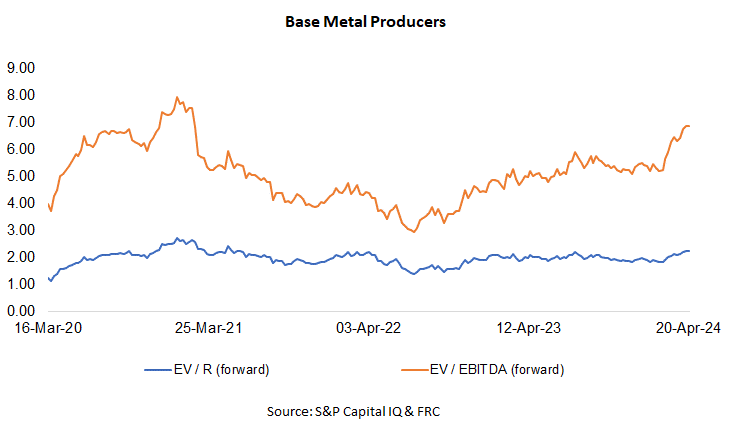
Gold producer valuations were down 4.0% last week (down 2.2% in the prior week); base metal producers were down 0.3% last week (up 1.5% in the prior week). On average, gold producer valuations are 18% lower compared to the past three instances when gold surpassed US$2k/oz.
| 15-Apr-24 | 22-Apr-24 | ||||
| Gold Producers | EV / R (forward) | EV / EBITDA (forward) | EV / R (forward) | EV / EBITDA (forward) | |
| 1 | Barrick | 3.23 | 7.04 | 3.11 | 6.60 |
| 2 | Newmont | 3.10 | 7.35 | 3.09 | 7.29 |
| 3 | Agnico Eagle | 4.40 | 8.61 | 4.52 | 8.80 |
| 4 | AngloGold | 2.25 | 5.49 | 2.18 | 5.02 |
| 5 | Kinross Gold | 2.25 | 5.29 | 2.36 | 5.49 |
| 6 | Gold Fields | 3.31 | 6.48 | 3.01 | 5.52 |
| 7 | Sibanye | 0.81 | 4.10 | 0.76 | 3.75 |
| 8 | Hecla Mining | 4.79 | 18.13 | 4.68 | 17.18 |
| 9 | B2Gold | 2.08 | 4.28 | 1.89 | 3.74 |
| 10 | Alamos | 4.76 | 9.28 | 4.79 | 8.78 |
| 11 | Harmony | 1.83 | 5.77 | 1.70 | 4.88 |
| 12 | Eldorado Gold | 2.54 | 5.55 | 2.52 | 5.28 |
| Average (excl outliers) | 2.78 | 6.29 | 2.72 | 5.92 | |
| Min | 0.81 | 4.10 | 0.76 | 3.74 | |
| Max | 4.79 | 18.13 | 4.79 | 17.18 | |
| Base Metal Producers | EV / R (forward) | EV / EBITDA (forward) | EV / R (forward) | EV / EBITDA (forward) | |
| 1 | BHP Group | 2.98 | 5.69 | 2.98 | 5.70 |
| 2 | Rio Tinto | 2.26 | 4.87 | 2.25 | 4.82 |
| 3 | South32 | 1.47 | 6.82 | 1.43 | 6.70 |
| 4 | Glencore | 0.45 | 6.14 | 0.44 | 6.01 |
| 5 | Anglo American | 1.68 | 5.02 | 1.66 | 4.97 |
| 6 | Teck Resources | 2.70 | 6.05 | 2.65 | 5.98 |
| 7 | First Quantum | 4.15 | 13.64 | 4.19 | 14.04 |
| Average (excl outliers) | 2.24 | 6.89 | 2.23 | 6.89 | |
| Min | 0.45 | 4.87 | 0.44 | 4.82 | |
| Max | 4.15 | 13.64 | 4.19 | 14.04 | |
Source: S&P Capital IQ & FRC
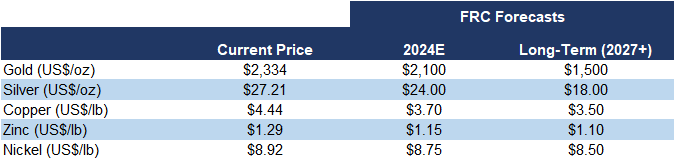
We are maintaining our metal price forecasts.
Key Developments:
- G Mining Ventures (TSX: GMIN/MCAP: $1.02B) is acquiring Reunion Gold (TSXV: RGD/MCAP: $738M) for $800M, reflecting a 29% premium over the last closing MCAP. RGD is advancing a large gold project in Guyana (South America) with resources totaling 5.9 Moz. We believe GMIN is paying $141/oz vs the sector average of $48/oz, a 194% premium. This transaction signals positive momentum in the junior resource sector, reflecting the willingness of larger players to invest in large projects at substantial premiums. Rio2 Limited (TSXV: RIO) and Southern Silver Exploration (TSXV: SSV) are prime examples of juniors under coverage with large gold/silver projects.
Weekly Crypto Commentary
Prices of mainstream/popular cryptos were up 10% on average last week (down 19% in the previous week).
| April 22, 2024 | ||
| Cryptocurrencies | 1-Week | 1-Year |
| Bitcoin | 8% | 138% |
| Binance Coin | 12% | 80% |
| Cardano | 17% | 31% |
| Ethereum | 7% | 70% |
| Polkadot | 12% | 25% |
| XRP | 11% | 16% |
| Polygon | 1% | -27% |
| Solana | 12% | 606% |
| AVERAGE | 10% | 117% |
| MIN | 1% | -27% |
| MAX | 17% | 606% |
| Indices | ||
| Canadian | 1-Week | 1-Year |
| BTCC | 5% | 136% |
| BTCX | 4% | 144% |
| EBIT | 4% | 141% |
| FBTC | 5% | 42% |
| U.S. | 1-Week | 1-Year |
| BITO | 5% | 78% |
| BTF | 4% | 80% |
| IBLC | 11% | 70% |
Source: FRC/Yahoo Finance
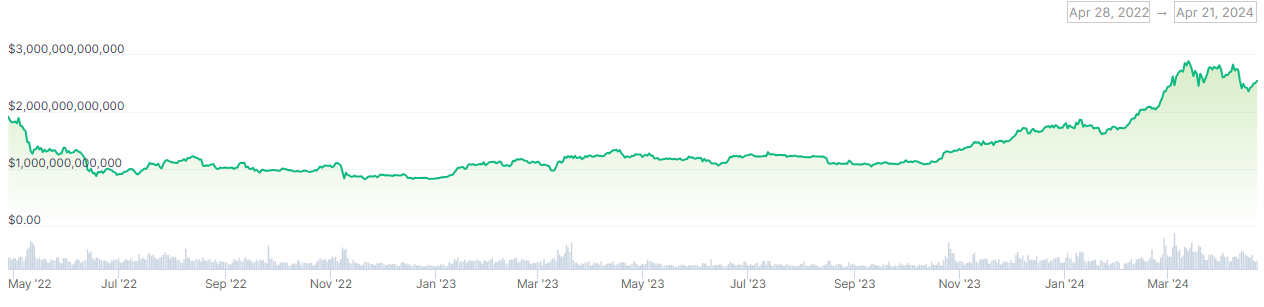
The global MCAP of cryptos is US$2.51T, down 3% MoM, but up 107%YoY.
Source: CoinGecko
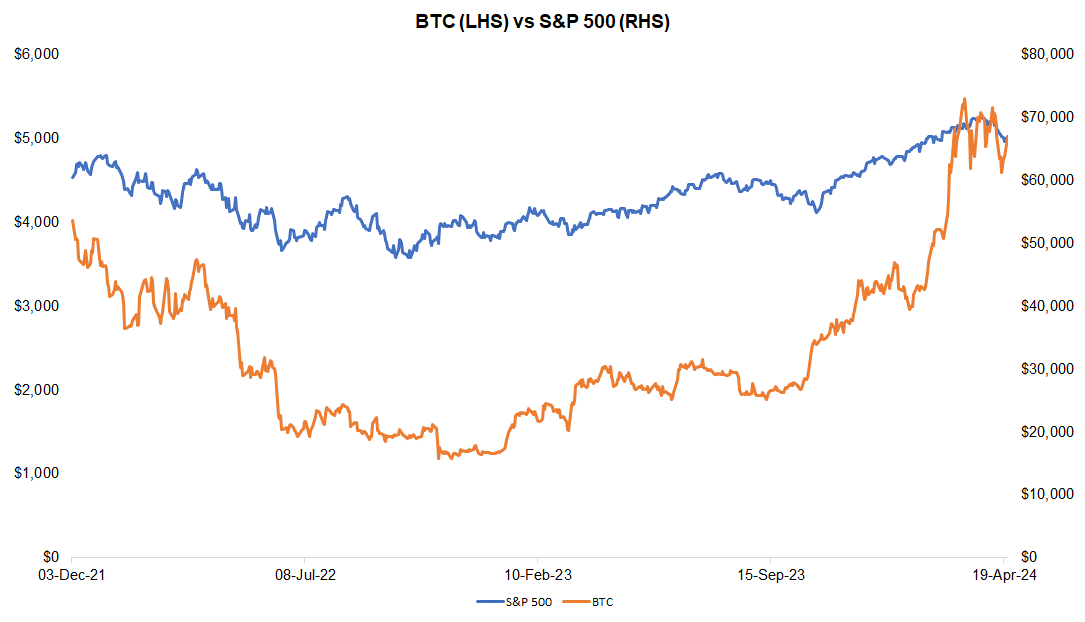
Last week, BTC was up 8%, while the S&P 500 was down 2%.
Source: FRC/ Yahoo Finance
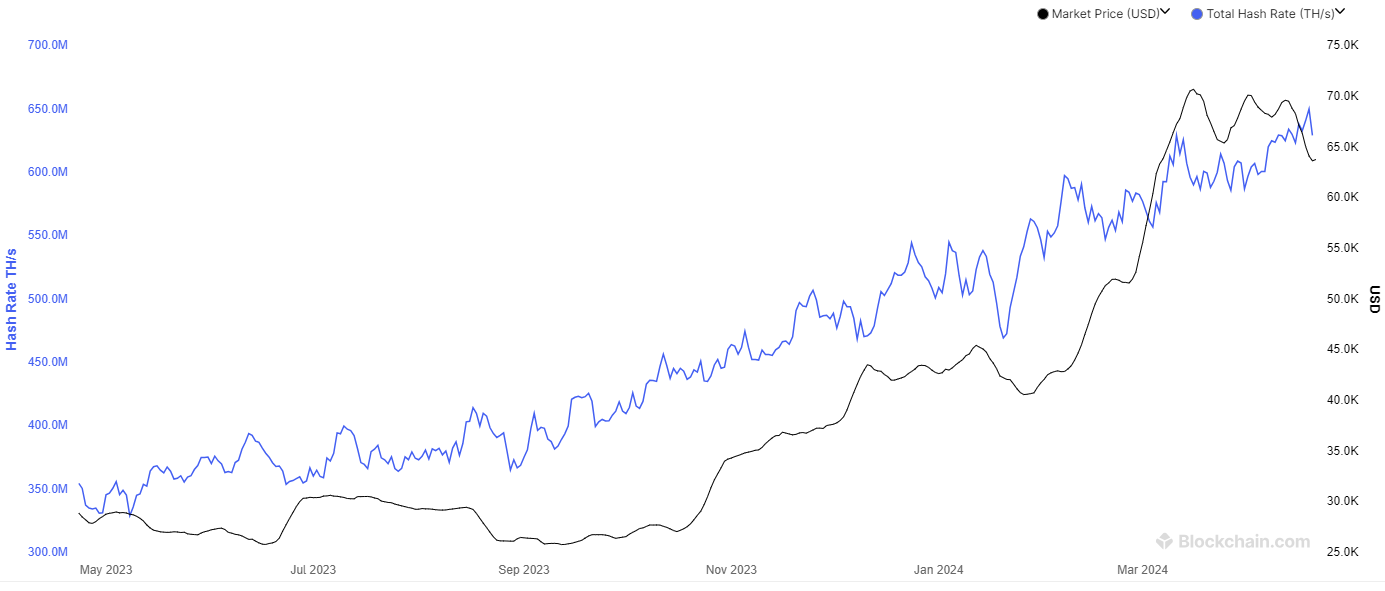
The global hash rate of BTC (defined as calculations performed per second/an indicator of network difficulty) is 629 exahashes per second (EH/s), down 1% WoW, but up 6% MoM. The decrease in hash rates is positive for miners as their efficiency rates (BTC production per EH/s) are inversely linked to global hash rates.
Total Hash Rate (BTC)
Companies operating in the crypto space are trading at an average EV/R of 7.3x (previously 7.4x).
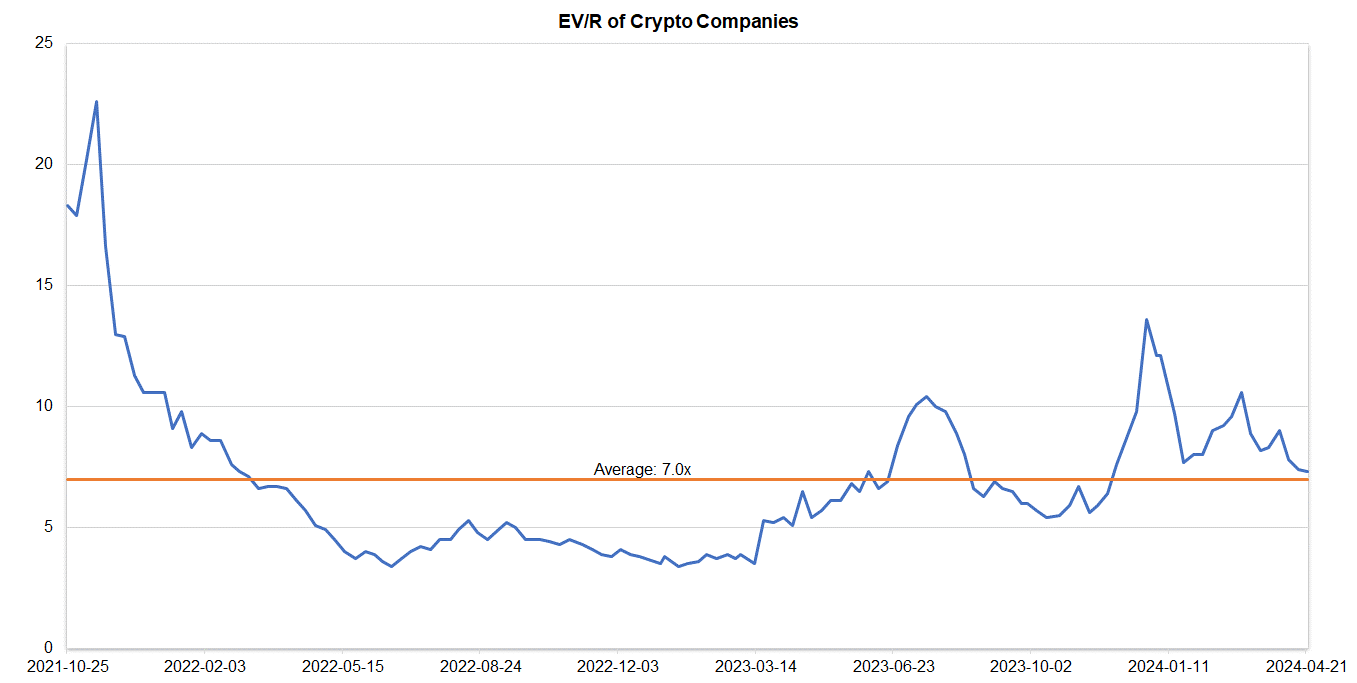
Source: S&P Capital IQ/FRC
| April 22, 2024 | ||
| Crypto Companies | Ticker | TEV/Revenue |
| Argo Blockchain | LSE: ARB | 3.3 |
| BIGG Digital | CSE: BIGG | 9.7 |
| Bitcoin Well | TSXV: BTCW | 0.7 |
| Canaan Inc. | NASDAQ: CAN | 0.4 |
| CleanSpark Inc. | NasdaqCM:CLSK | 17.9 |
| Coinbase Global | NASDAQ: COIN | 16.8 |
| Galaxy Digital Holdings | TSX: GLXY | N/A |
| HIVE Digital | TSXV:HIVE | 3.1 |
| Hut 8 Mining Corp. | TSX: HUT | 8.2 |
| Marathon Digital Holdings | NASDAQ: MARA | 11.3 |
| Riot Platforms | NASDAQ: RIOT | 6.2 |
| SATO Technologies | TSXV: SATO | 2.2 |
| AVERAGE | 7.3 | |
| MEDIAN | 6.2 | |
| MINIMUM | 0.4 | |
| MAXIMUM | 17.9 |
Source: S&P Capital IQ/FRC


