Junior Resource Stocks Gaining Momentum/ Explore Our Top Picks Portfolio
Published: 4/8/2024
Author: FRC Analysts

Summary
- Last week, global equity markets were down 0.3% on average, while gold and Bitcoin (BTC) maintained their momentum, reaching new highs
- Silver surpassed US$27.5/oz for the first time since May 2021. We continue to anticipate silver reaching US$30/oz in the coming months.
- Gold producer valuations are 12% lower compared to the past three instances when gold surpassed US$2k/oz.
- Shares of a gold-silver junior under coverage were up 52% WoW
- Our top picks portfolio has outperformed its benchmark in three out of the last four weeks.
Index
- FRC Top Picks: Explore the top five weekly performers among our list of top picks.
- Commentary on Companies Under Coverage: Gain insights into companies under coverage that experienced significant developments last week, along with our analysts' commentary and actionable takeaways.
- Weekly Mining Commentary: Gain a broader perspective on global equity and metal markets, major developments, trends affecting the mining sector, along with our analysts' predictions, and metal prices forecasts.
- Weekly Crypto Commentary: Stay updated with the latest developments in the crypto markets, including detailed analysis of key parameters such as crypto prices, global market capitalization, hash rates, and valuations of publicly traded crypto companies.
Companies Mentioned in this article:
FRC Top Picks
The following table shows last week’s top five performers among our Top Picks, including four junior resource companies, and an oilfield services company. The top performer, Golden Minerals (TSX: AUMN), was up 52%. AUMN is advancing multiple gold-silver projects in the Americas.
| Top 5 Weekly Performers | WoW Returns |
| Golden Minerals Company (AUMN.TO) | 51.8% |
| World Copper Ltd. (WCU.V) | 42.9% |
| Enterprise Group, Inc. (E.TO) | 39.4% |
| Sabre Gold Mines Corp. (SGLD.TO) | 36.4% |
| Transition Metals Corp.(XTM.V) | 33.3% |
| * Past performance is not indicative of future performance (as of Apr 8, 2024) |
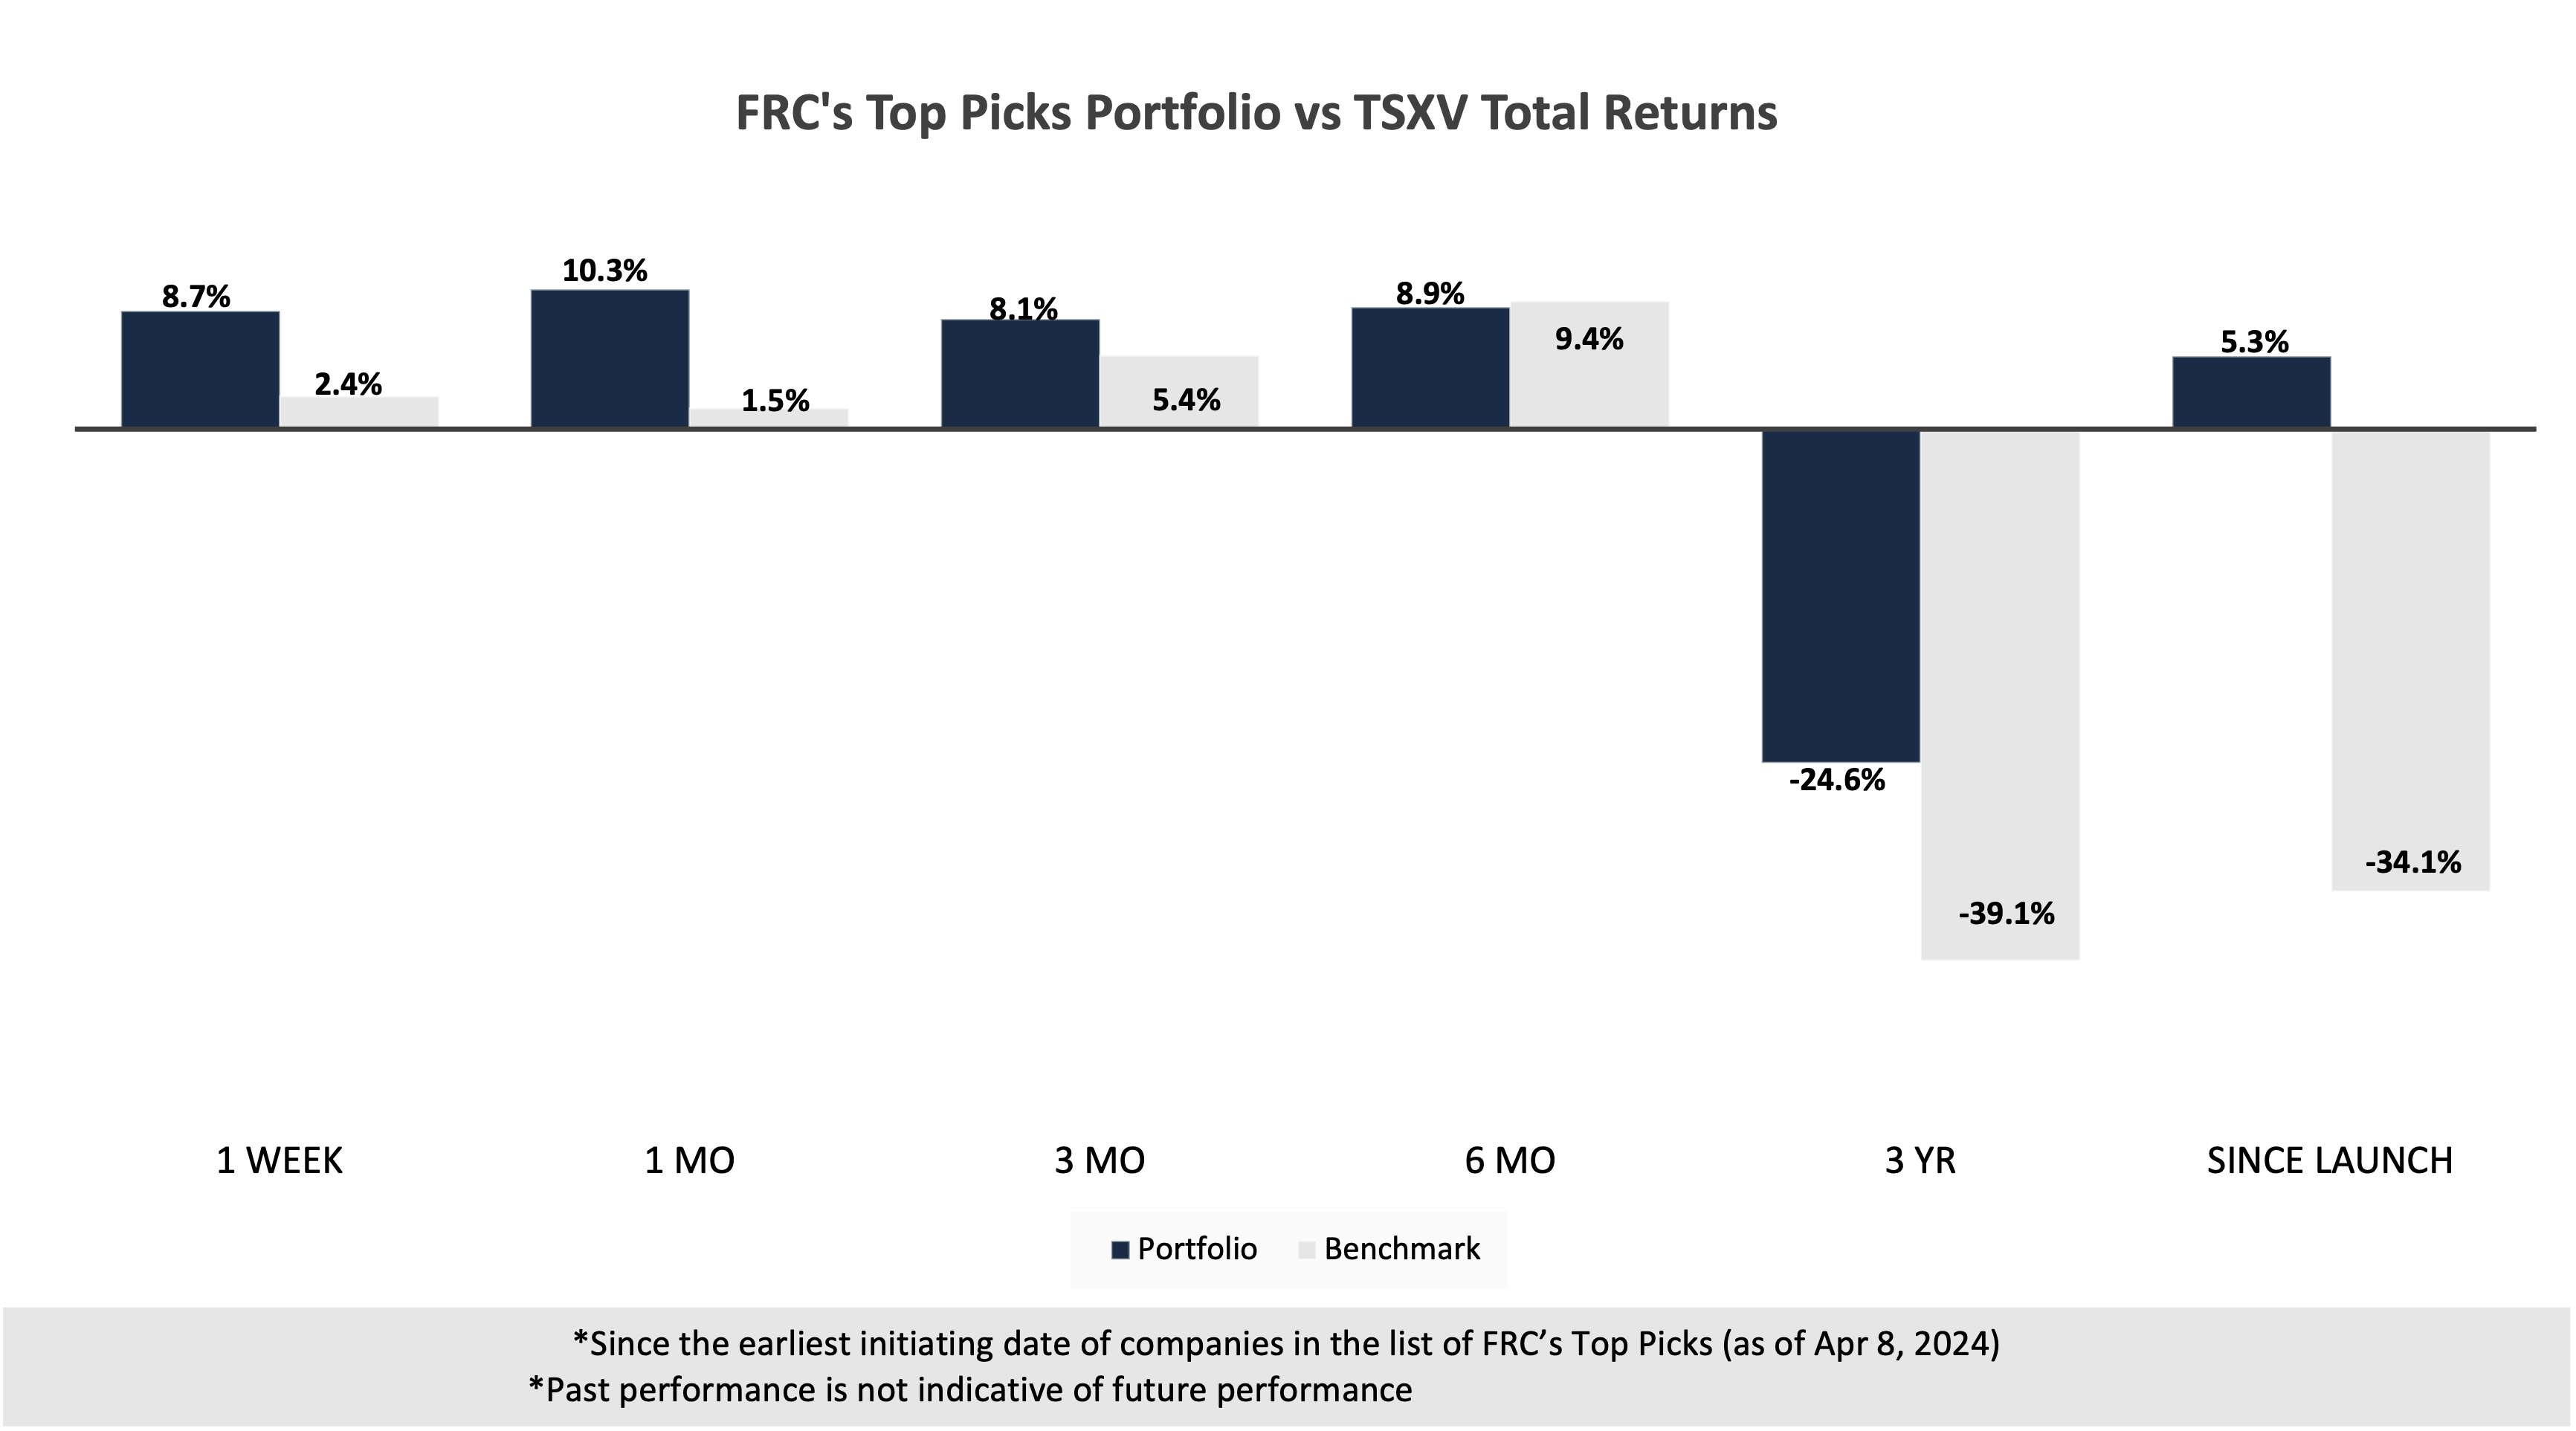
Last week, companies on our Top Picks list were up 8.7% on average vs 2.4% for the benchmark (TSXV). Junior resource stocks, comprising 65% of our list of top picks, have exhibited a notable revival, as evidenced by our top picks portfolio outperforming its benchmark in three out of the last four weeks.
| Total Return | 1 Week | 1 mo | 3 mo | 6 mo | 3 yr | Since launch |
| Mining | 9.7% | 12.0% | 6.9% | 7.0% | -47.6% | 7.8% |
| Cannabis | N/A | N/A | N/A | N/A | -52.5% | -23.6% |
| Tech | 14.0% | 41.0% | 50.0% | 33.0% | -37.7% | -3.9% |
| Special Situations (MIC) | 7.7% | 3.8% | 13.7% | 17.7% | -13.7% | -10.2% |
| Private Companies | N/A | N/A | N/A | N/A | 20.5% | 30.5% |
| Portfolio (Total) | 8.7% | 10.3% | 8.1% | 8.9% | -24.6% | 5.3% |
| Benchmark (Total) | 2.4% | 1.5% | 5.4% | 9.4% | -39.1% | -34.1% |
| Portfolio (Annualized) | - | - | - | - | -9.0% | 0.5% |
| Benchmark (Annualized) | - | - | - | - | -15.2% | -4.0% |
- Since the earliest initiating date of companies in the list of Top Picks (as of Apr 8, 2024)
- Green (blue) indicates FRC's picks outperformed (underperformed) the benchmark.
- Past performance is not indicative of future performance.
- Our complete list of top picks (updated weekly) can be viewed here: Top Picks List
Weekly Mining Commentary
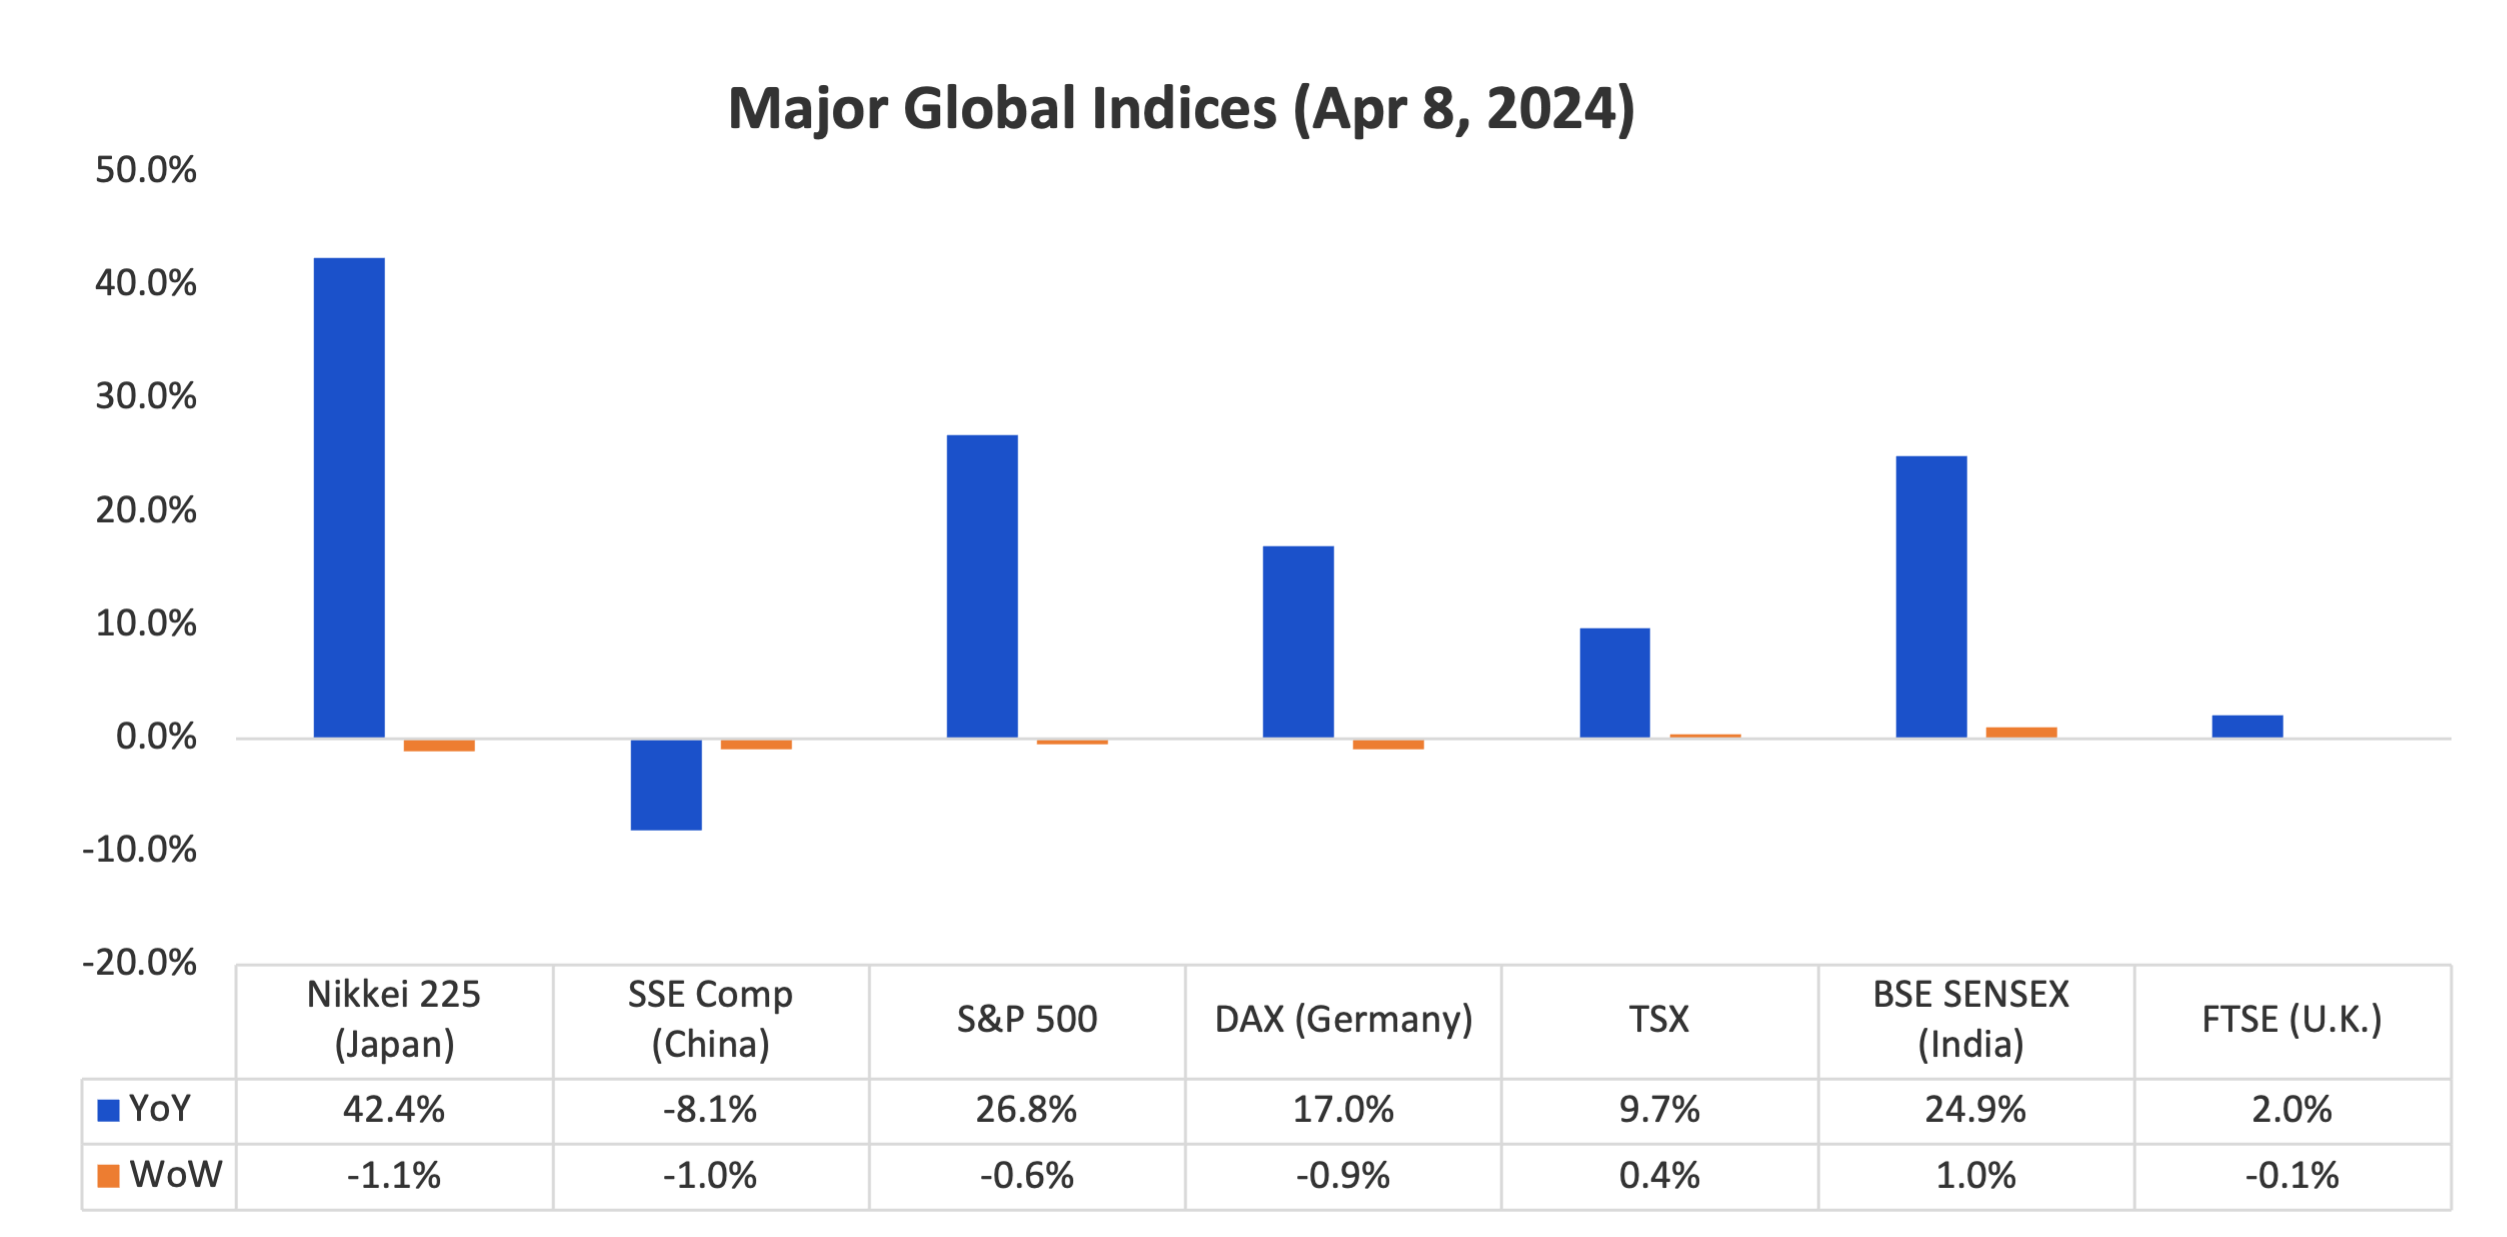
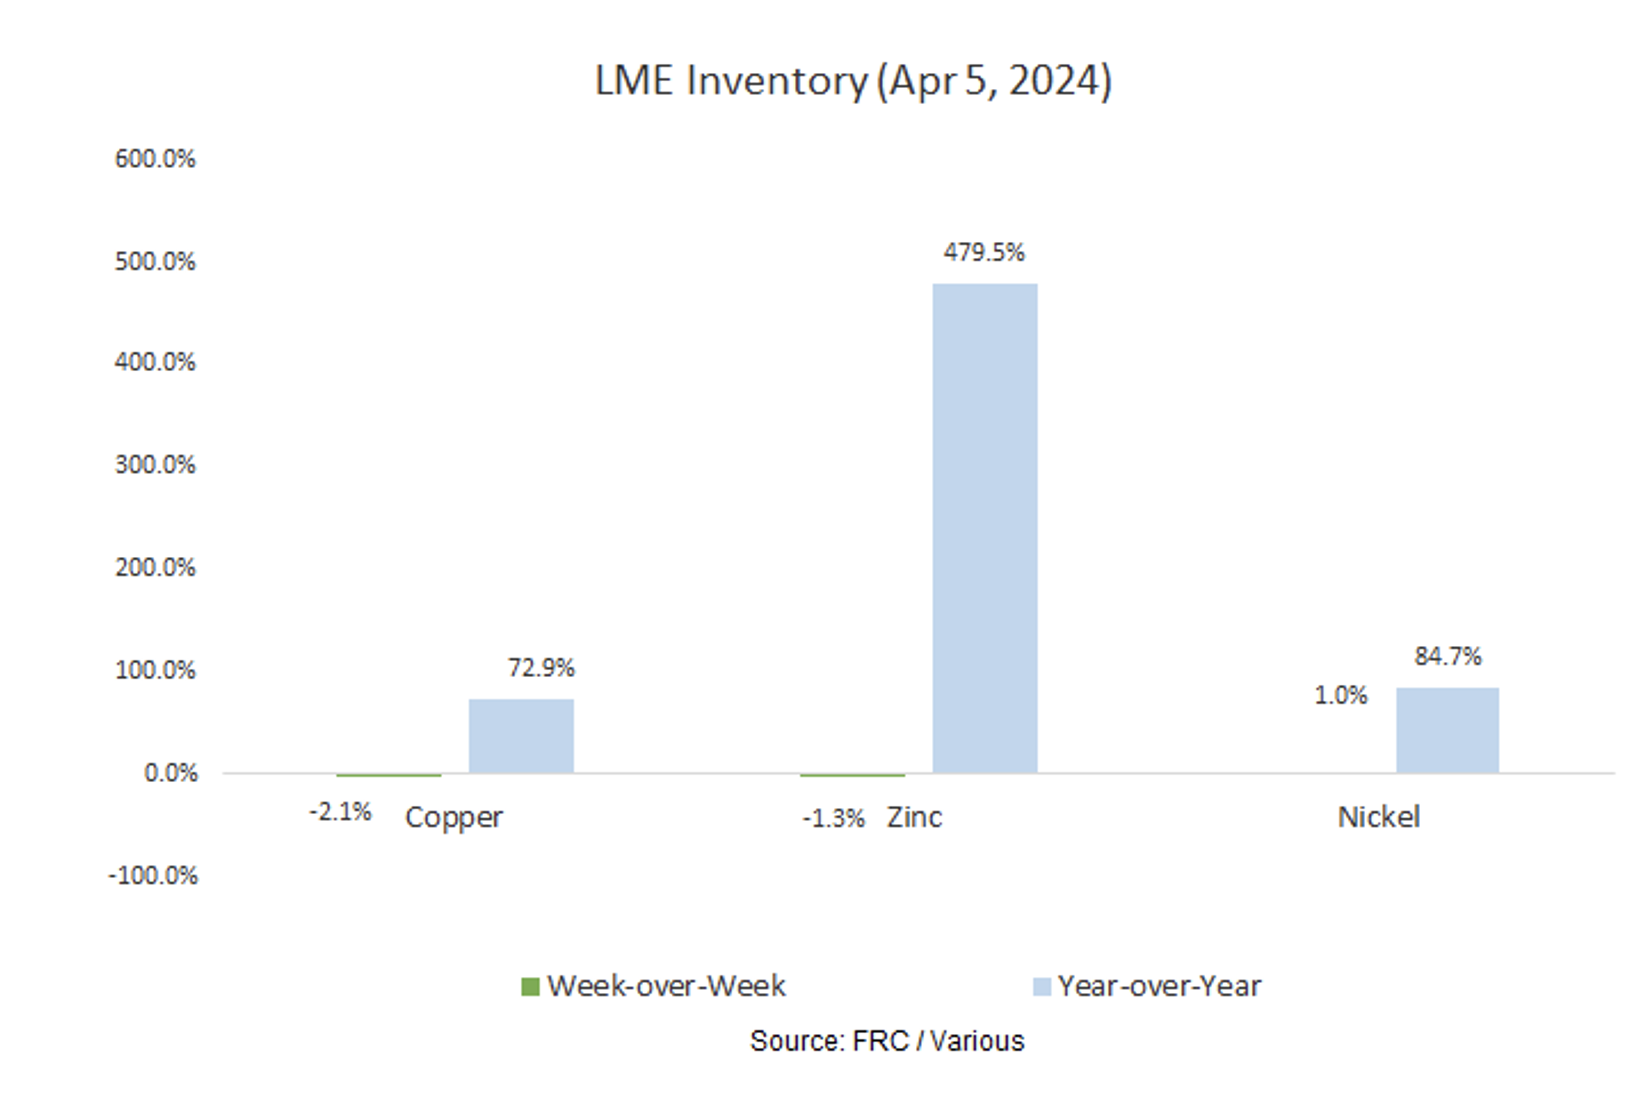
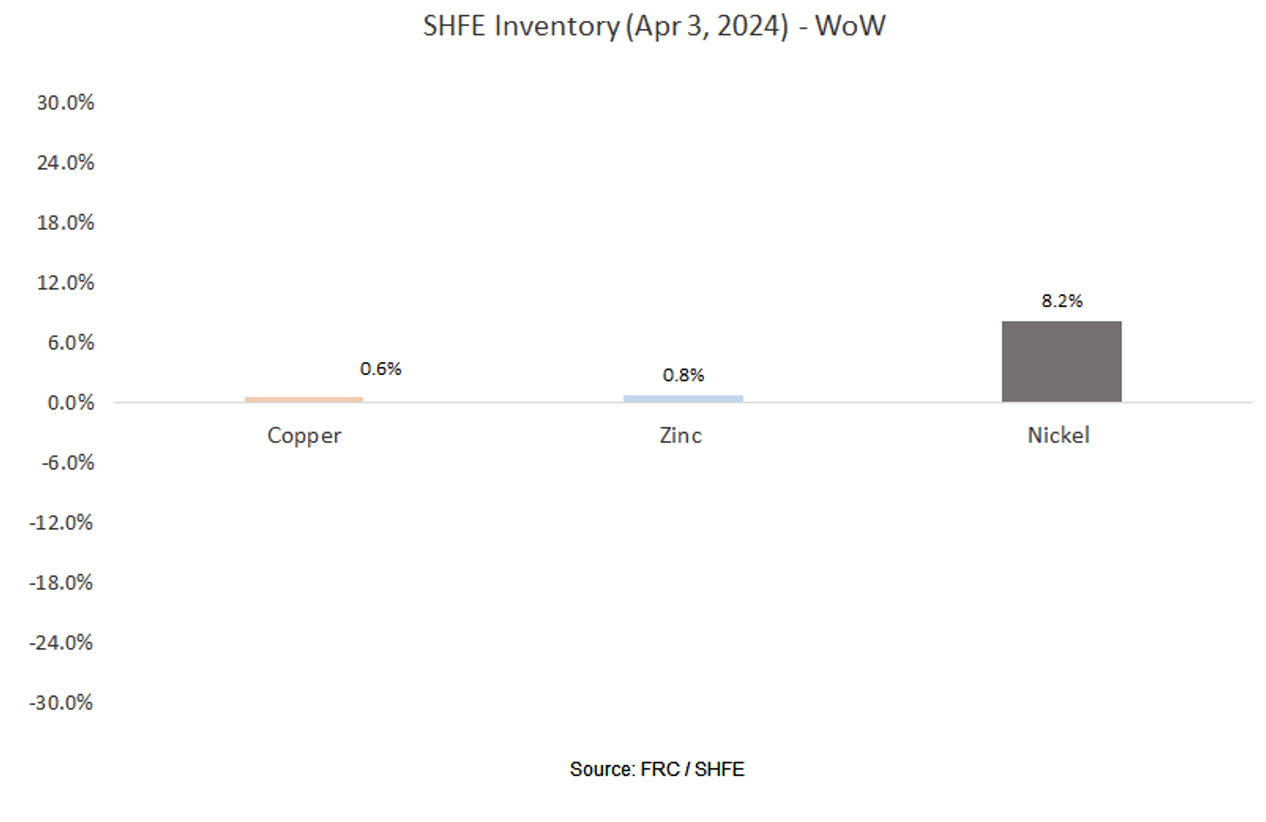
Last week, global equity markets were down 0.3% on average (up 0.6% in the previous week). The US$ and the S&P 500 retreated, while gold and BTC maintained their momentum, reaching new highs, propelled by inflationary pressures stemming from rising oil prices, and escalating tensions in the Middle East.
Source: FRC / Various
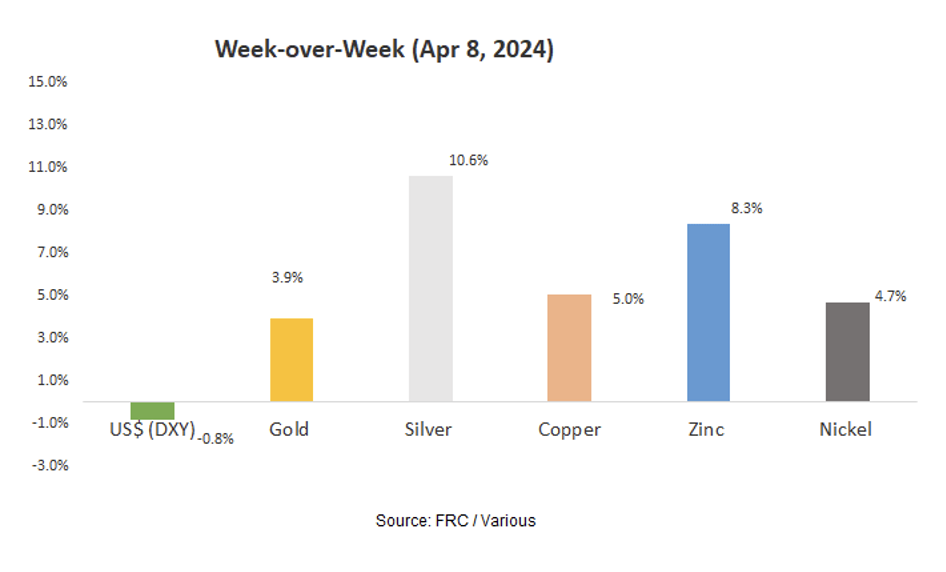
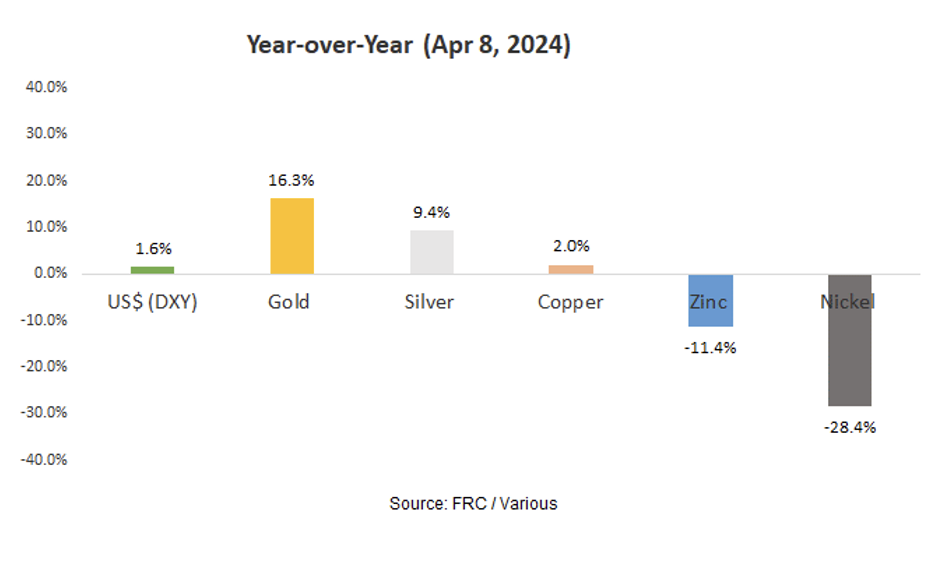
Last week, metal prices were up 6.5% on average (up 0.3% in the previous week). Gold surpassed US$2,300/oz for the first time. Silver surpassed US$27.5/oz for the first time since May 2021. Earlier this year, we had issued a note saying that we believe gold and silver will outperform other metals this year. We continue to anticipate silver reaching US$30/oz in the coming months.
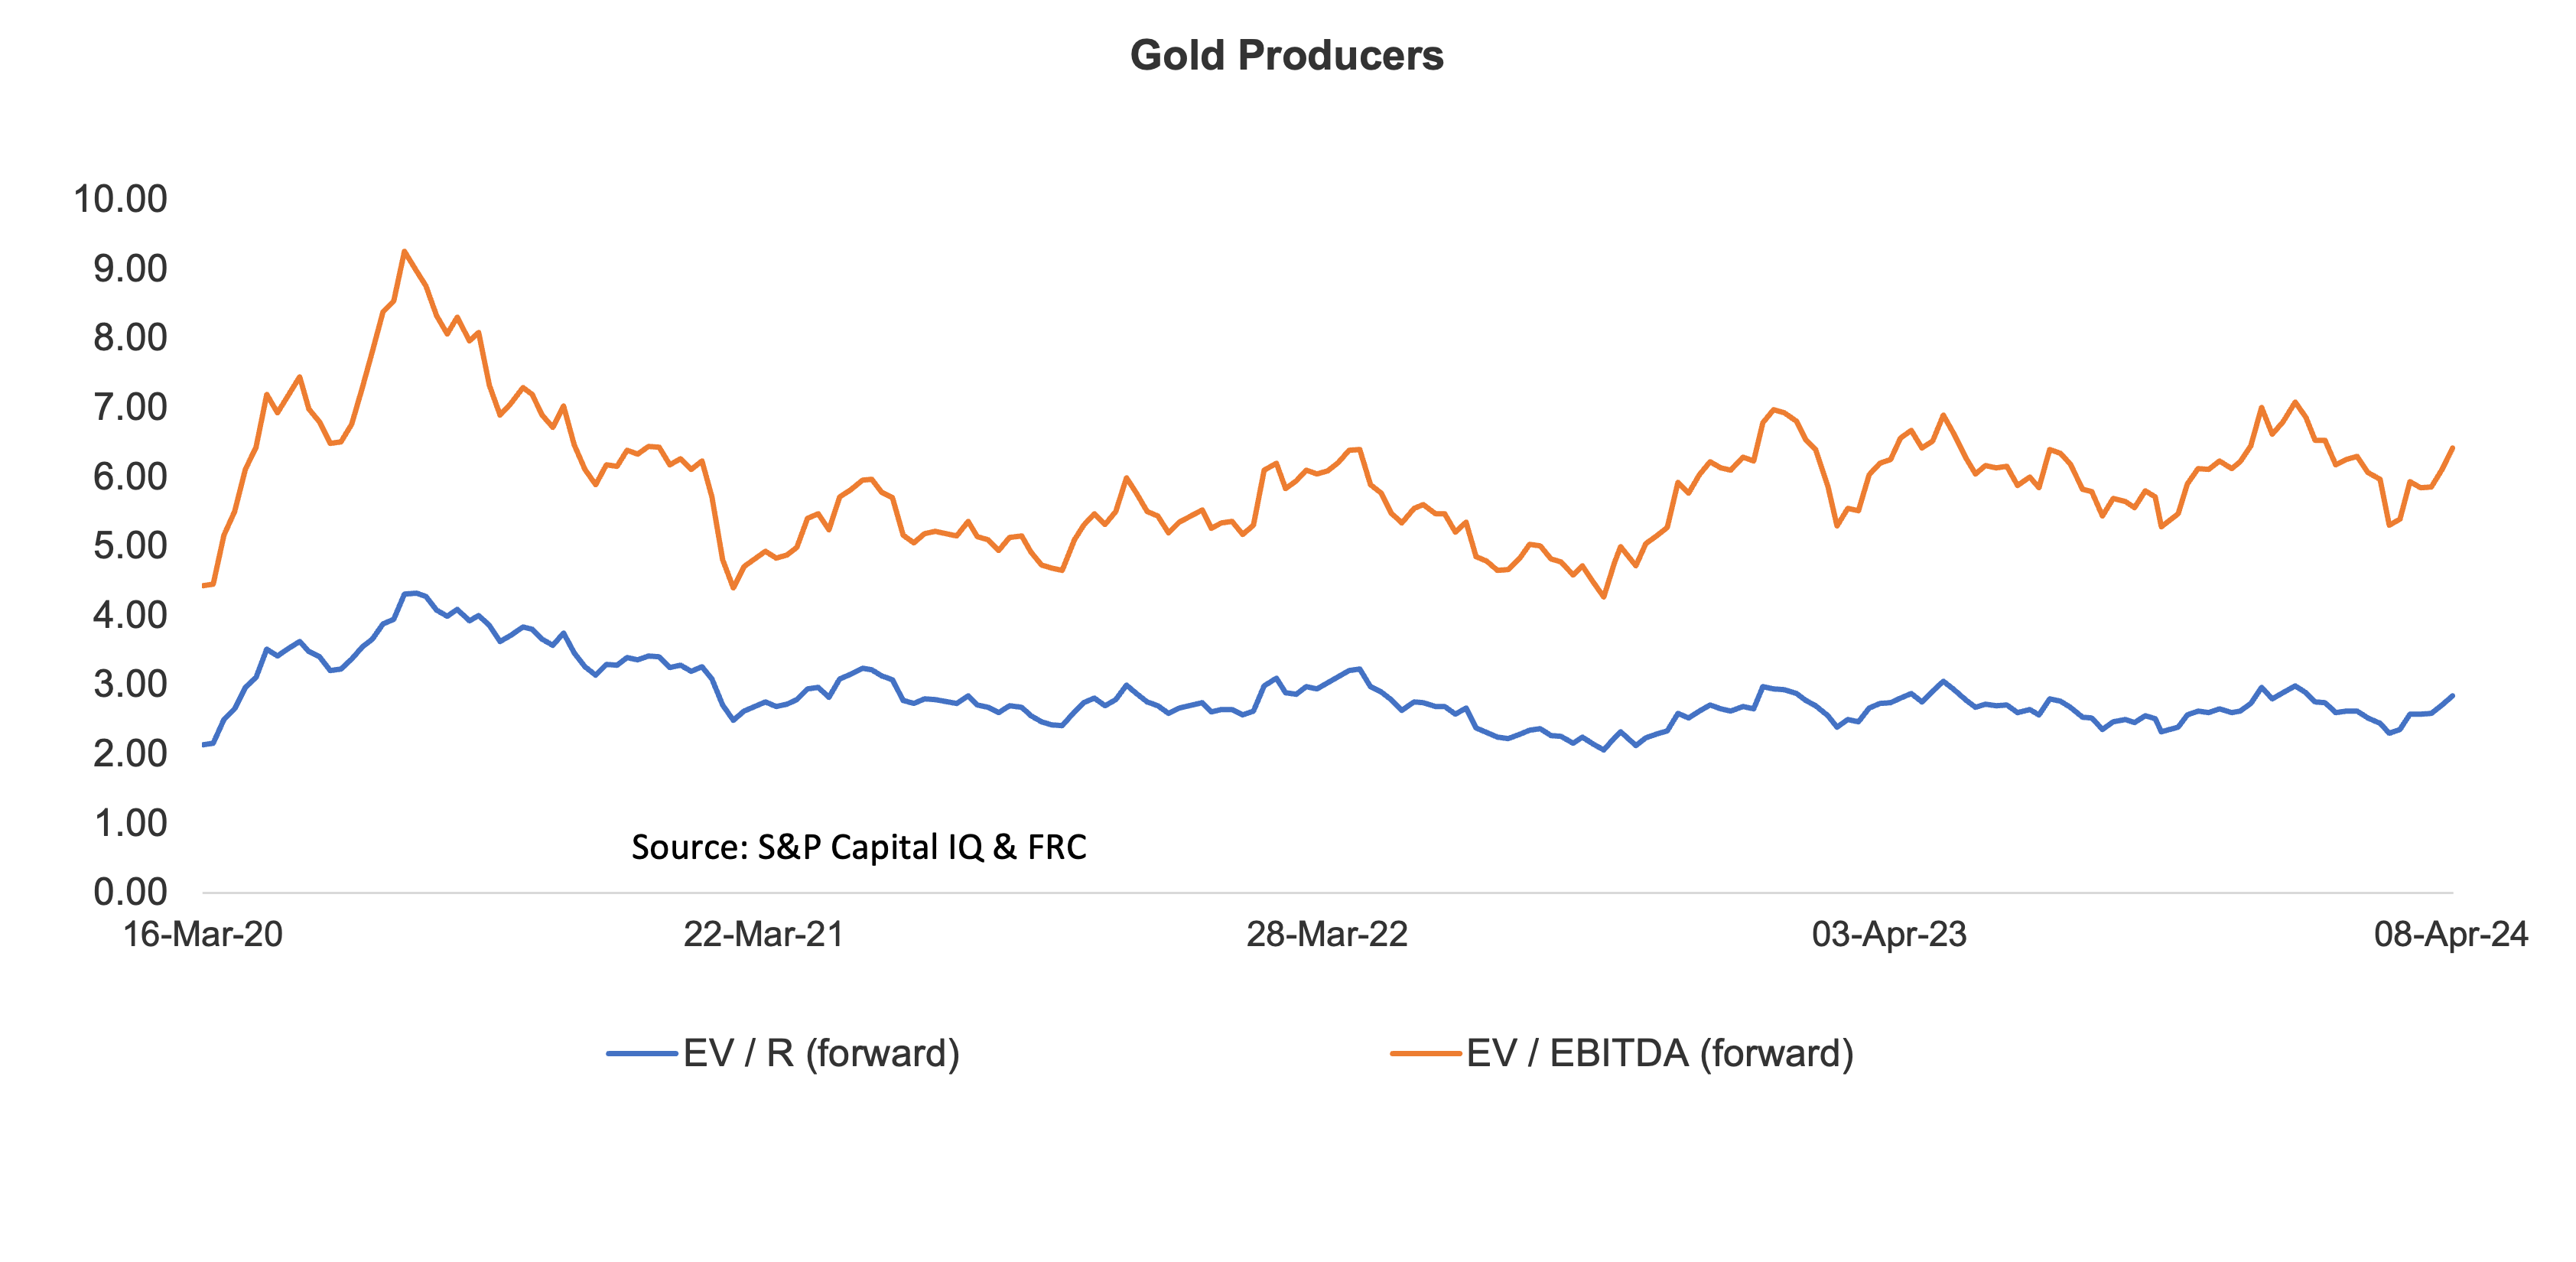
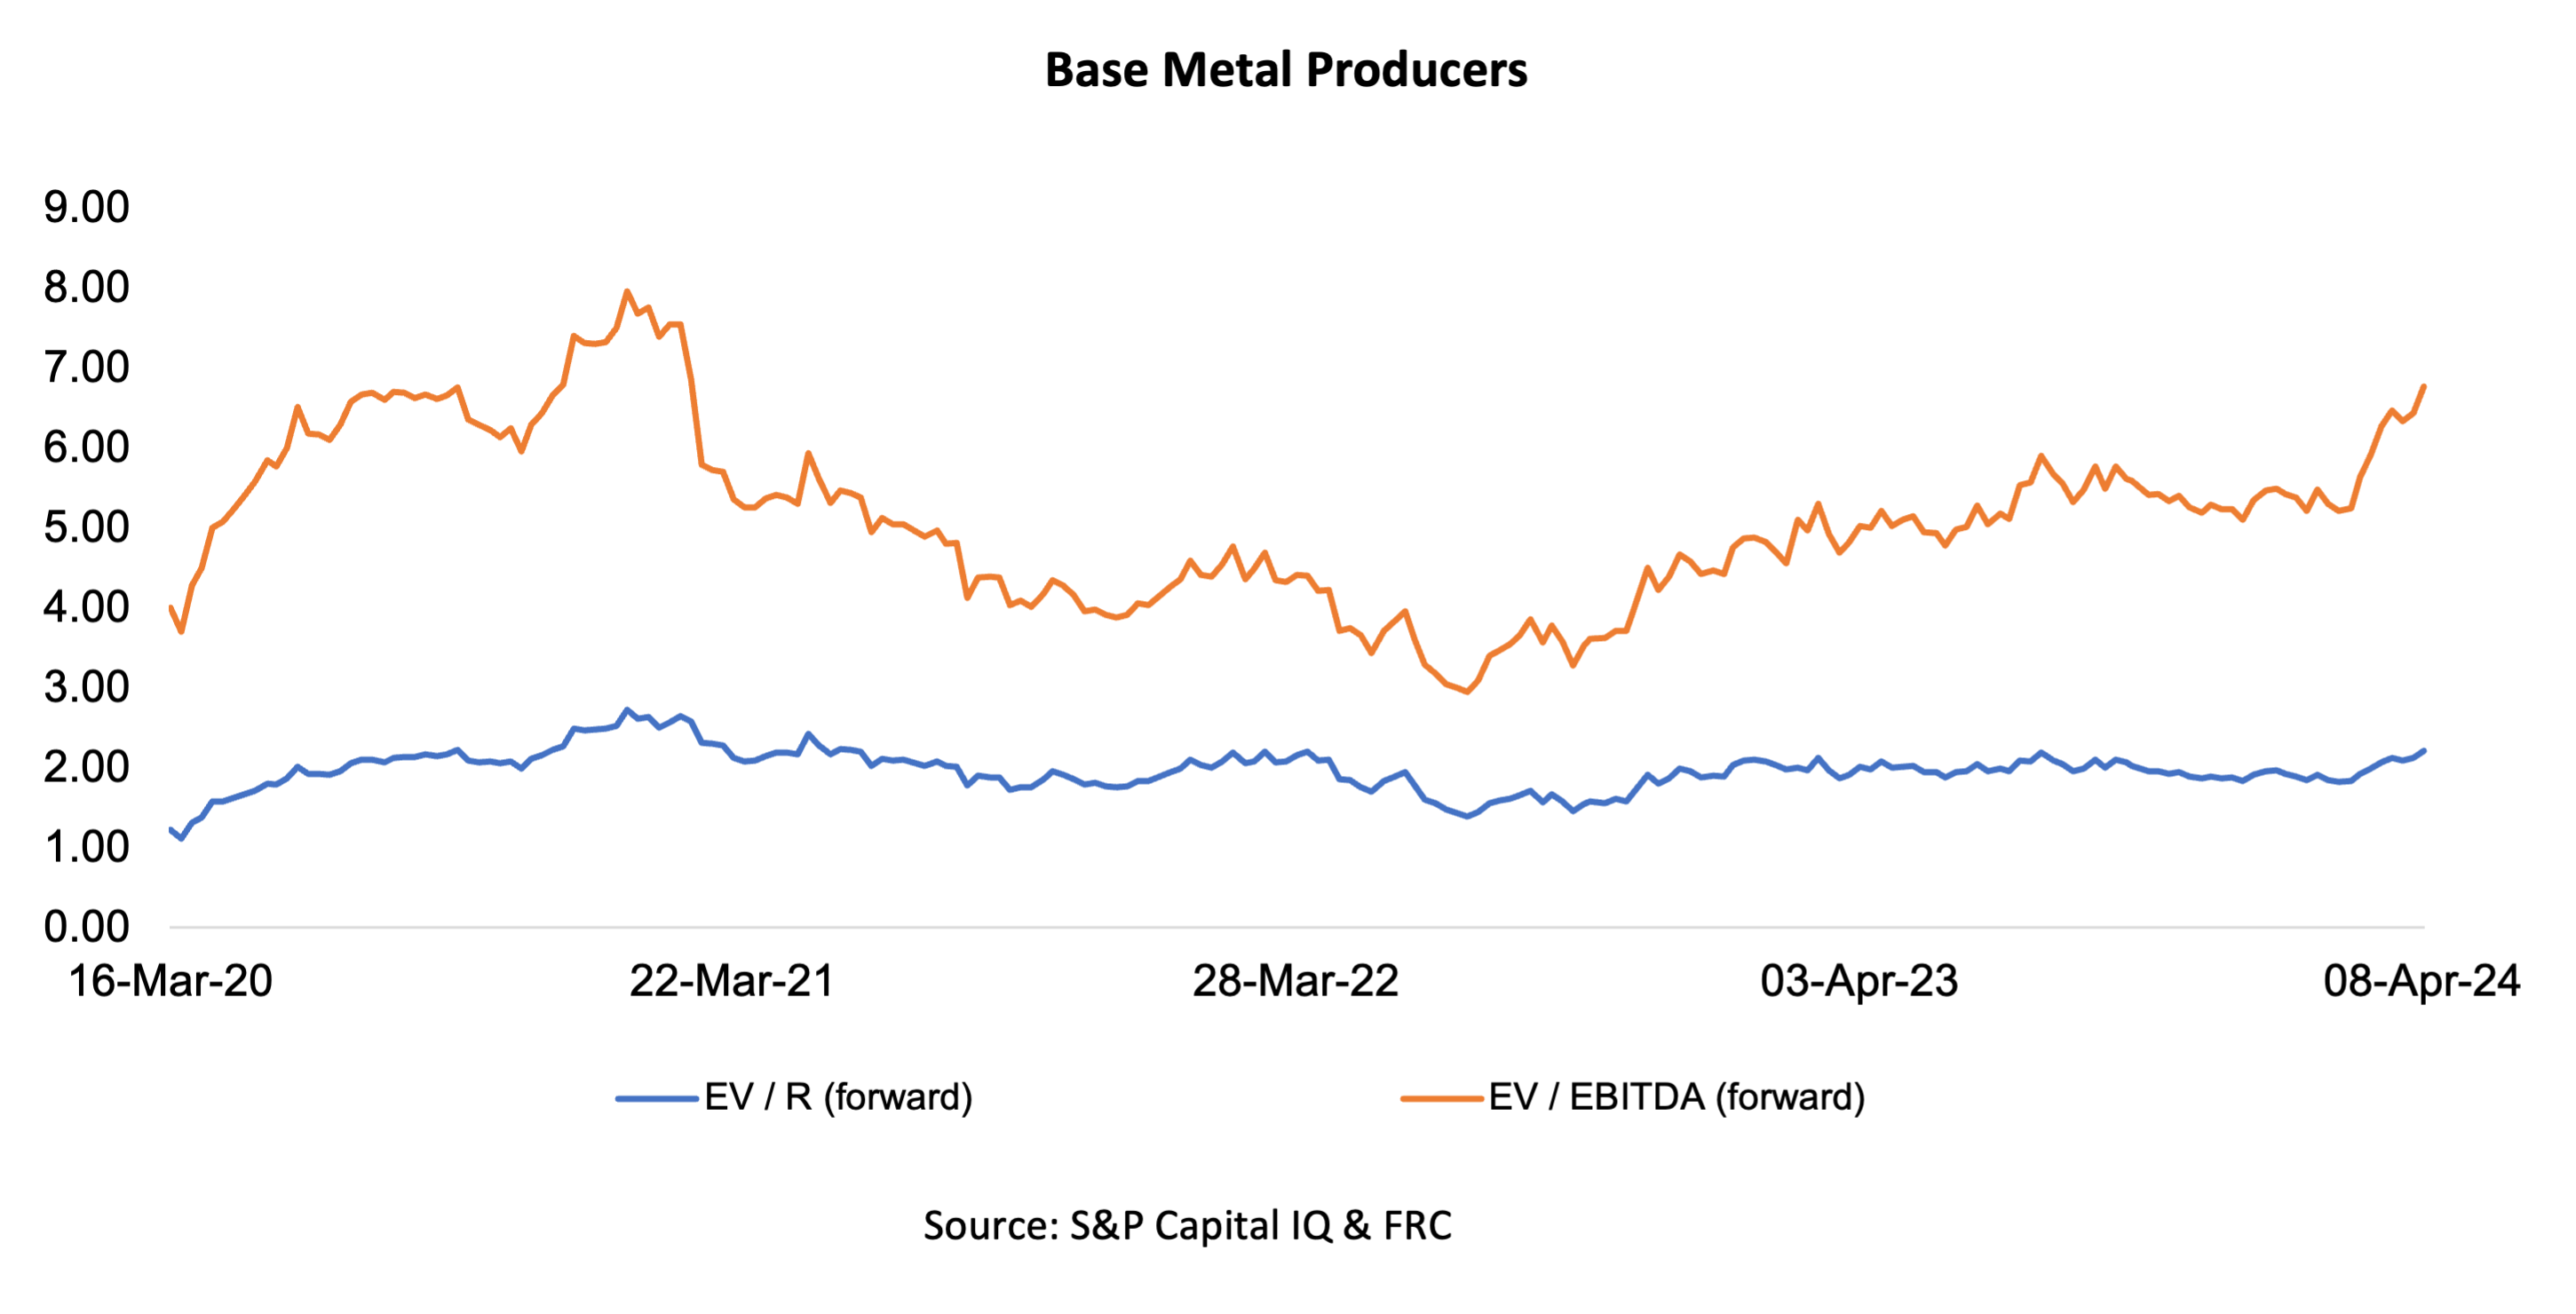
Gold producer valuations were up 4.9% last week (up 4.5% in the prior week); base metal producers were up 4.7% last week (up 1.4% in the prior week). On average, gold producer valuations are 12% lower compared to the past three instances when gold surpassed US$2k/oz.
| 01-Apr-24 | 08-Apr-24 | ||||
| Gold Producers | EV / R (forward) | EV / EBITDA (forward) | EV / R (forward) | EV / EBITDA (forward) | |
| 1 | Barrick | 3.13 | 6.95 | 3.29 | 7.33 |
| 2 | Newmont | 2.98 | 7.18 | 3.23 | 7.68 |
| 3 | Agnico Eagle | 4.40 | 8.82 | 4.52 | 9.00 |
| 4 | AngloGold | 2.11 | 5.16 | 2.25 | 5.51 |
| 5 | Kinross Gold | 2.23 | 5.37 | 2.30 | 5.54 |
| 6 | Gold Fields | 2.98 | 5.87 | 3.16 | 6.24 |
| 7 | Sibanye | 0.72 | 3.52 | 0.81 | 3.99 |
| 8 | Hecla Mining | 4.40 | 15.38 | 4.95 | 17.66 |
| 9 | B2Gold | 1.92 | 3.97 | 2.09 | 4.31 |
| 10 | Alamos | 5.32 | 9.85 | 5.32 | 9.69 |
| 11 | Harmony | 1.65 | 5.19 | 1.77 | 5.55 |
| 12 | Eldorado Gold | 2.43 | 5.40 | 2.59 | 5.74 |
| Average (excl outliers) | 2.72 | 6.12 | 2.85 | 6.42 | |
| Min | 0.72 | 3.52 | 0.81 | 3.99 | |
| Max | 5.32 | 15.38 | 5.32 | 17.66 | |
| Industry (three year average) | 110.70 | 116.70 | 110.70 | 116.70 | |
| Base Metal Producers | EV / R (forward) | EV / EBITDA (forward) | EV / R (forward) | EV / EBITDA (forward) | |
| 1 | BHP Group | 2.87 | 5.45 | 2.94 | 5.61 |
| 2 | Rio Tinto | 2.09 | 4.42 | 2.17 | 4.63 |
| 3 | South32 | 1.31 | 5.95 | 1.40 | 6.48 |
| 4 | Glencore | 0.42 | 5.76 | 0.45 | 6.14 |
| 5 | Anglo American | 1.57 | 4.69 | 1.70 | 5.08 |
| 6 | Teck Resources | 2.52 | 5.60 | 2.65 | 5.90 |
| 7 | First Quantum | 4.08 | 13.20 | 4.19 | 13.54 |
| Average (excl outliers) | 2.12 | 6.44 | 2.21 | 6.77 | |
| Min | 0.42 | 4.42 | 0.45 | 4.63 | |
| Max | 4.08 | 13.20 | 4.19 | 13.54 | |
| Source: S&P Capital IQ & FRC | |||||
We are maintaining our metal price forecasts.

Commentary on Resource Companies Under Coverage
Skyharbour Resources Ltd. / TSXV: SYH
PR Title: Partner company Tisdale Clean Energy (TSXV: TCEC) completes two drill holes at the South Falcon East uranium project, Athabasca basin, Saskatchewan
FRC Opinion : Positive - Phase one drilling intersected multiple zones of uranium mineralization. Tisdale is awaiting assay results. This project hosts historic inferred resources totaling 7 Mlbs at 0.03% U3O8.
Power Nickel Inc. / TSXV: PNPN
PR Tile - Announces a $2M private placement
FRC Opinion : Positive - PNPN has already secured commitments for $2M. PNPN is advancing a high-grade nickel project in Quebec.
HydroGraph Clean Power Inc. (CSE: HG)
PR Title - Completes a $3.2M private placement
FRC Opinion : Positive - HG is working towards commercializing its patented technology (the Hyperion System), capable of producing high-purity graphene in large-scale. Graphene is the thinnest/lightest/strongest material known.
Weekly Crypto Commentary
Prices of mainstream/popular cryptos were up 4% on average last week (down 3% in the previous week).
| April 8, 2024 | ||
| Cryptocurrencies | 1-Week | 1-Year |
| Bitcoin | 9% | 157% |
| Binance Coin | 4% | 89% |
| Cardano | 7% | 59% |
| Ethereum | 11% | 100% |
| Polkadot | -1% | 47% |
| XRP | 8% | 23% |
| Polygon | 1% | -15% |
| Solana | -5% | 794% |
| AVERAGE | 4% | 157% |
| MIN | -5% | -15% |
| MAX | 11% | 794% |
| Indices | ||
| Canadian | 1-Week | 1-Year |
| BTCC | 10% | 138% |
| BTCX | 11% | 147% |
| EBIT | 11% | 143% |
| FBTC | 11% | 54% |
| U.S. | 1-Week | 1-Year |
| BITO | 11% | 81% |
| BTF | 12% | 89% |
| IBLC | -5% | 71% |
Source: FRC/Yahoo Finance
The global MCAP of cryptos is US$2.83T, up 44% MoM, and 132%YoY.
Total Crypto Market Cap Chart

BTC was up 9% last week, while the S&P 500 was down 1%.

Source: FRC / Yahoo Finance
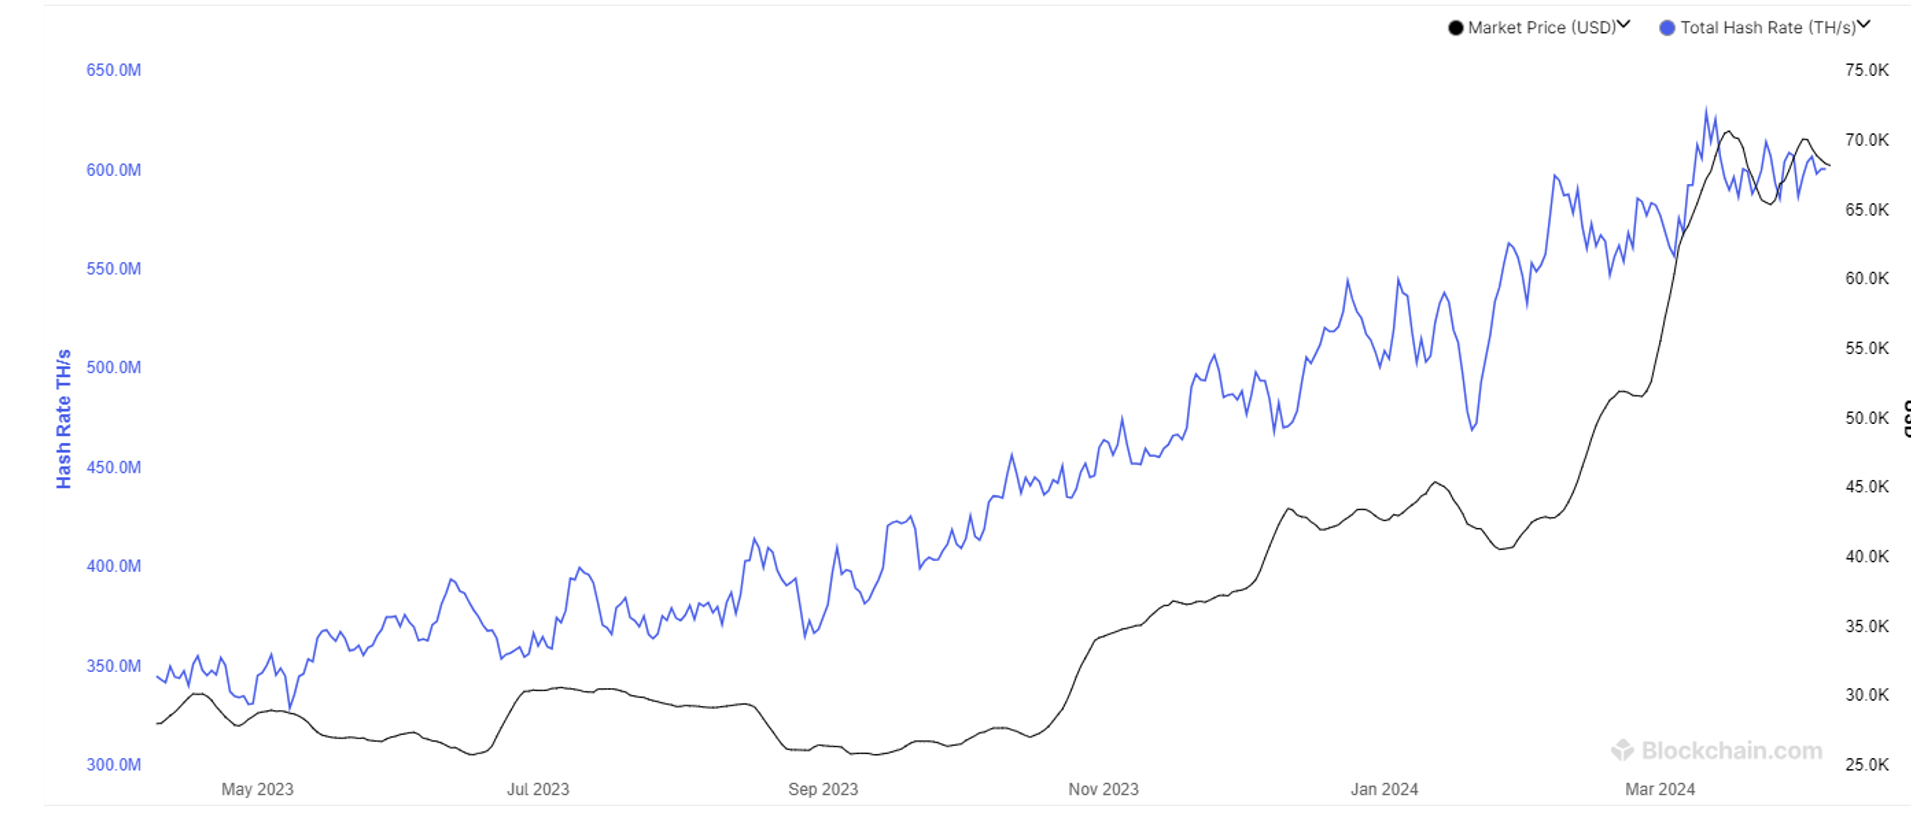
The global hash rate of BTC (defined as calculations performed per second/an indicator of network difficulty) is 601 exahashes per second (EH/s), down 1% WoW, but 1% MoM. The decrease in hash rates is positive for miners as their efficiency rates (BTC production per EH/s) are inversely linked to global hash rates.
Total Hash Rate (BTC)
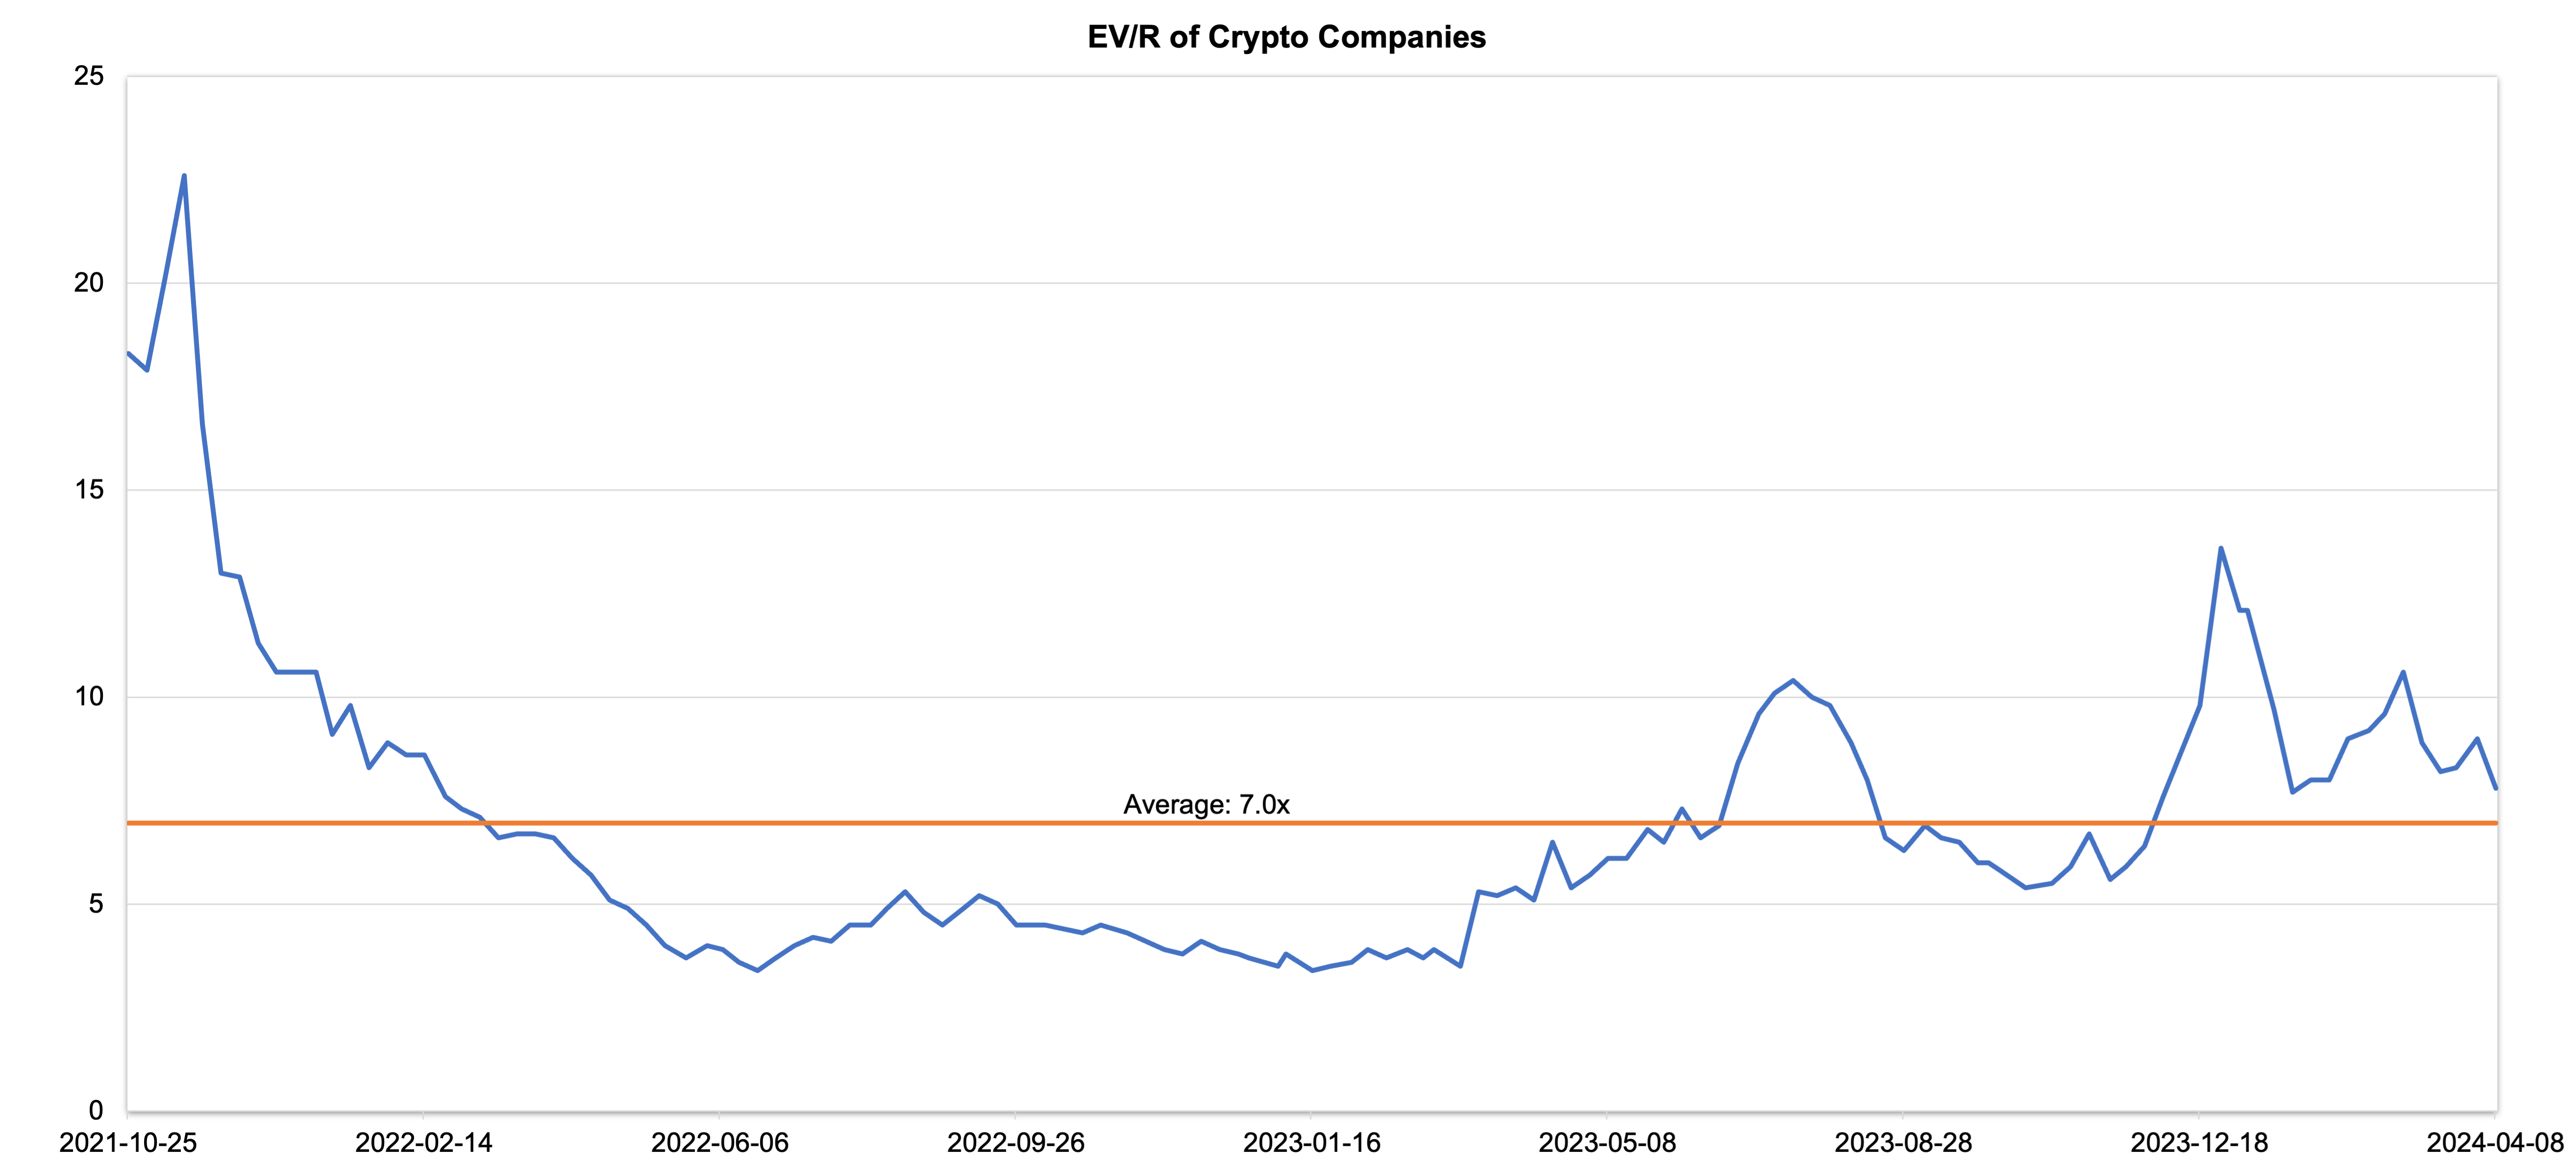
Companies operating in the crypto space are trading at an average EV/R of 7.8x (previously 9.0x).
Source: S&P Capital IQ/FRC
| April 8, 2024 | ||
| Crypto Companies | Ticker | TEV/Revenue |
| Argo Blockchain | LSE: ARB | 3.4 |
| BIGG Digital | CSE: BIGG | 11.0 |
| Bitcoin Well | TSXV: BTCW | 0.8 |
| Canaan Inc. | NASDAQ: CAN | 1.0 |
| CleanSpark Inc. | NasdaqCM:CLSK | 16.2 |
| Coinbase Global | NASDAQ: COIN | 19.2 |
| Galaxy Digital Holdings | TSX: GLXY | N/A |
| HIVE Digital | TSXV:HIVE | 3.6 |
| Hut 8 Mining Corp. | TSX: HUT | 8.2 |
| Marathon Digital Holdings | NASDAQ: MARA | 12.6 |
| Riot Platforms | NASDAQ: RIOT | 7.2 |
| SATO Technologies | TSXV: SATO | 2.4 |
| AVERAGE | 7.8 | |
| MEDIAN | 7.2 | |
| MINIMUM | 0.8 | |
| MAXIMUM | 19.2 |
Source: S&P Capital IQ/FRC


