Summary
Last week, the S&P 500 surged 2.4% and is currently trading at record levels
This week, our focus is on two key macroeconomic data announcements
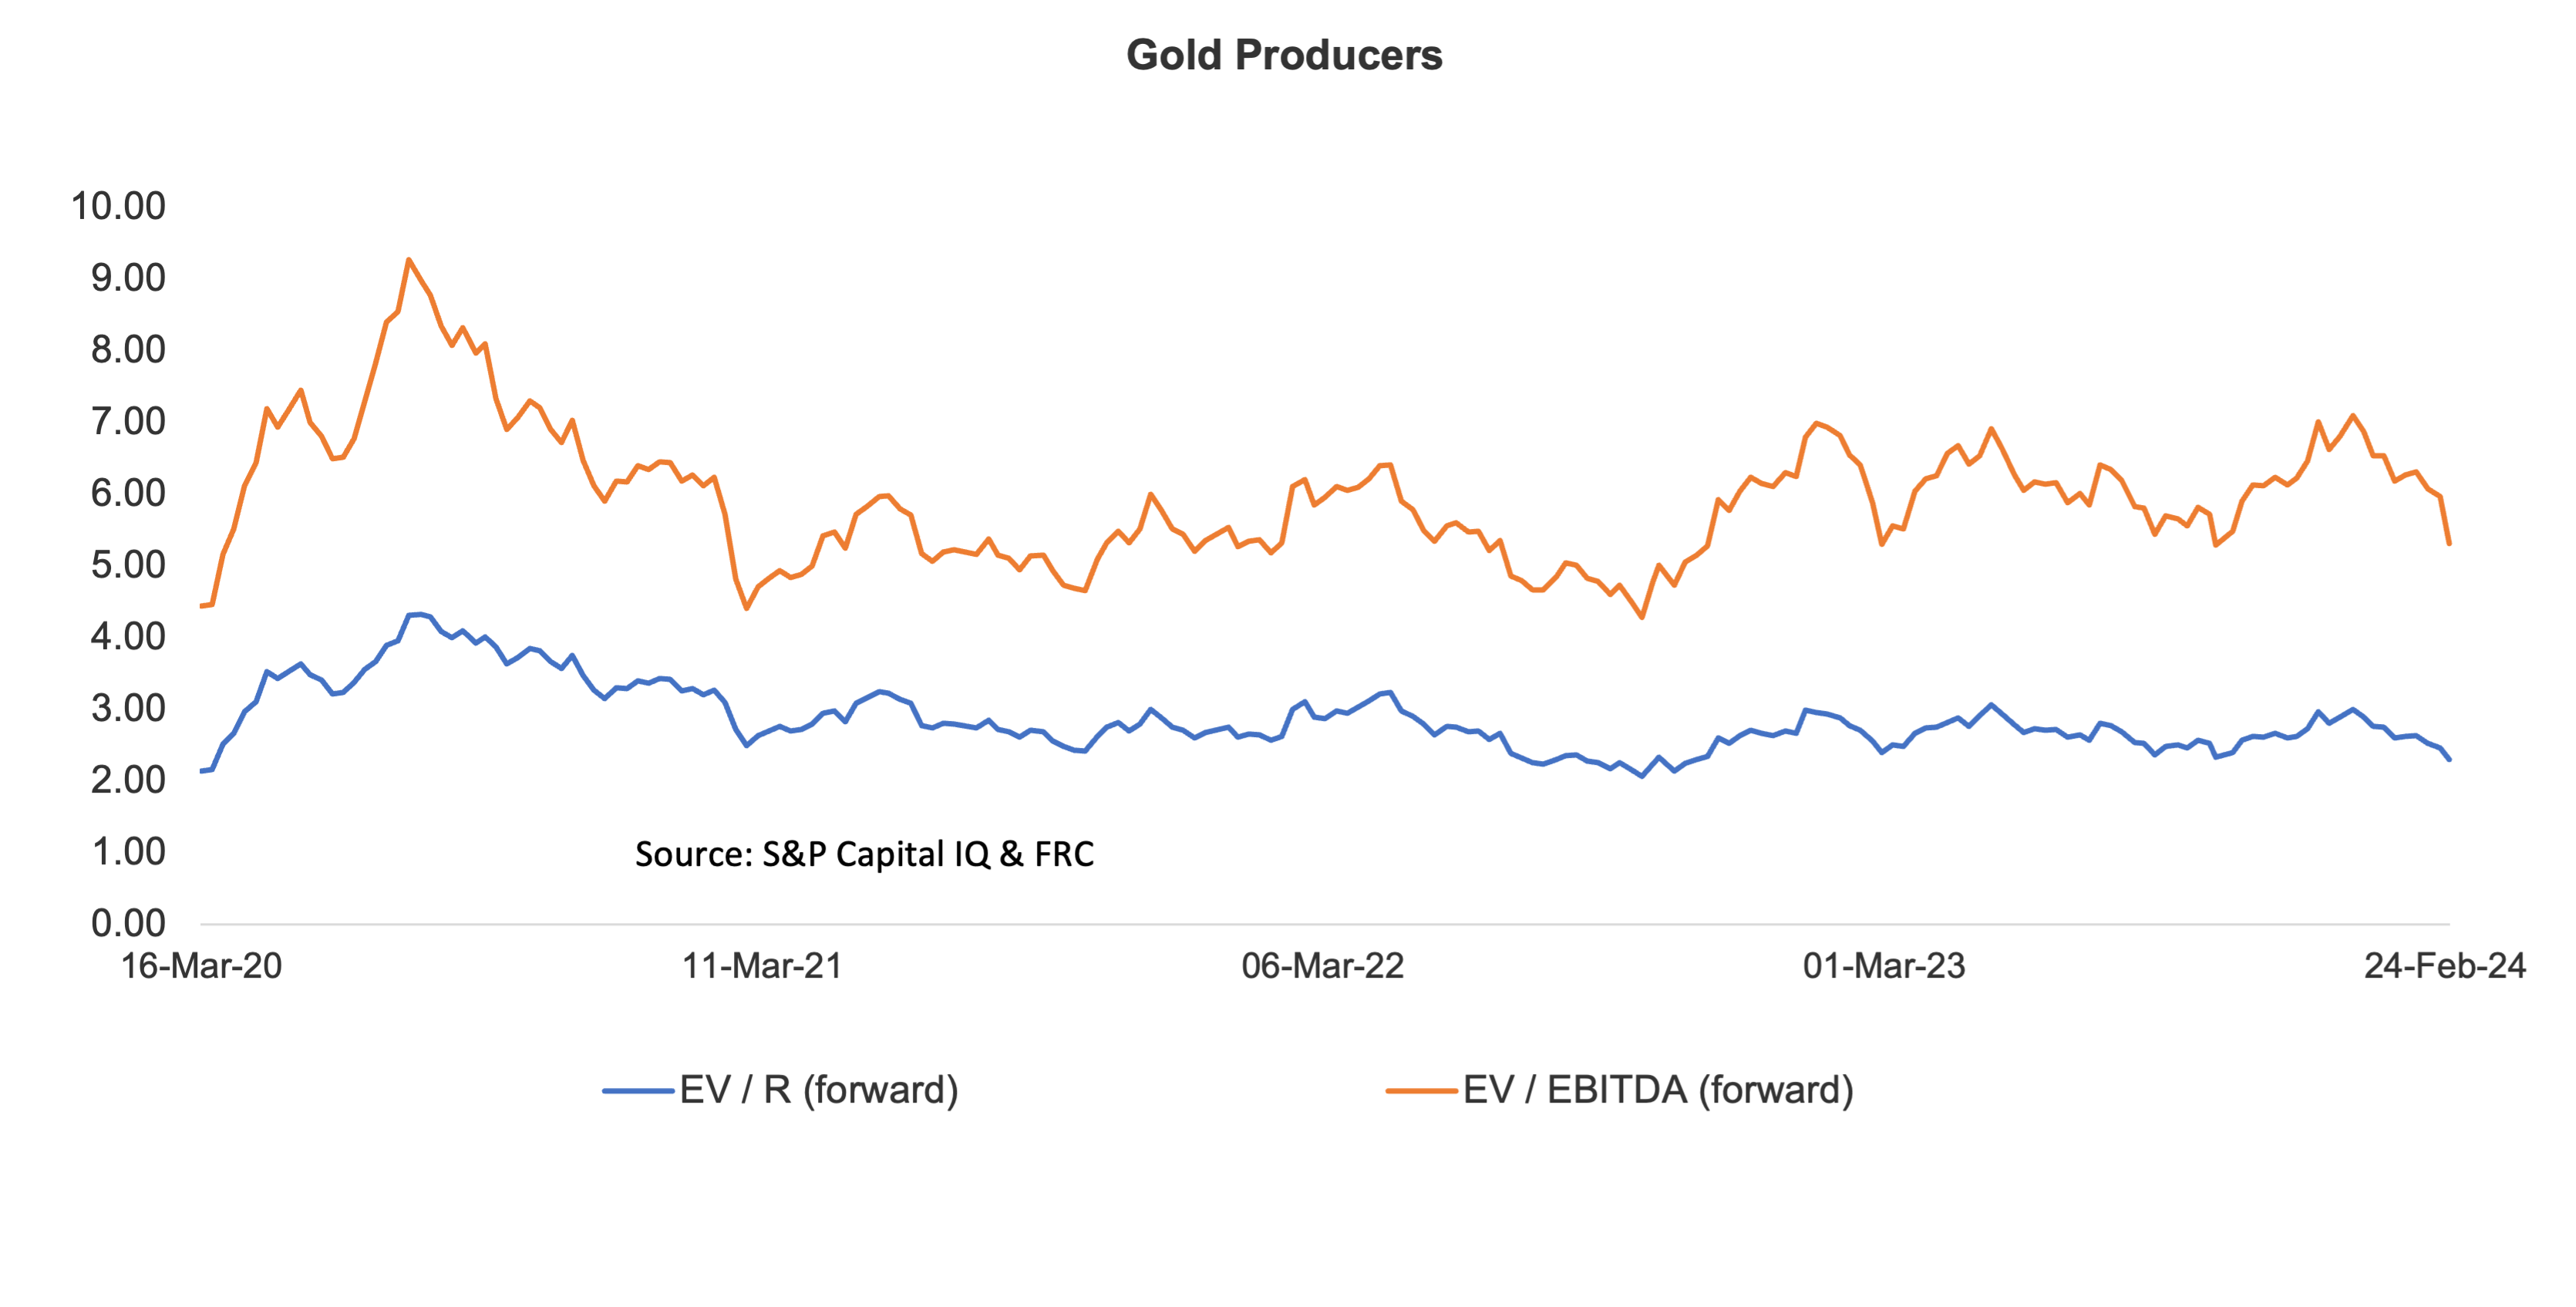
Gold producer valuations are 28% lower than the past three instances when gold surpassed US$2k/oz
Nickel has risen 7% to US$7.59/lb since our note last month, wherein we predicted a potential uptick in prices
A robust Preliminary Economic Assessment from a uranium junior under coverage
FRC Top Picks
The following table shows last month’s top five performers among our Top Picks, including three gold juniors, an oilfield services company, and a financial services provider. The top performer, Lumina Gold (TSXV: LUM), was up 35%. LUM is advancing a large open-pittable gold project in Ecuador.
| Top 5 Weekly Performers |
WoW Returns |
| Lumina Gold (TSXV: LUM) |
35.10% |
| Golden Minerals Company (AUMN.TO) |
17.20% |
| Sirios Resources Inc. (SOI.V)) |
12.50% |
| Enterprise Group, Inc. (E.TO) |
9.80% |
| Olympia Financial Group Inc. (OLY.TO) |
8.40% |
| * Past performance is not indicative of future performance (as of Feb 26, 2024) |
Companies on our Top Picks list are up 3% on average since we initiated coverage vs -38% for the benchmark (TSXV).
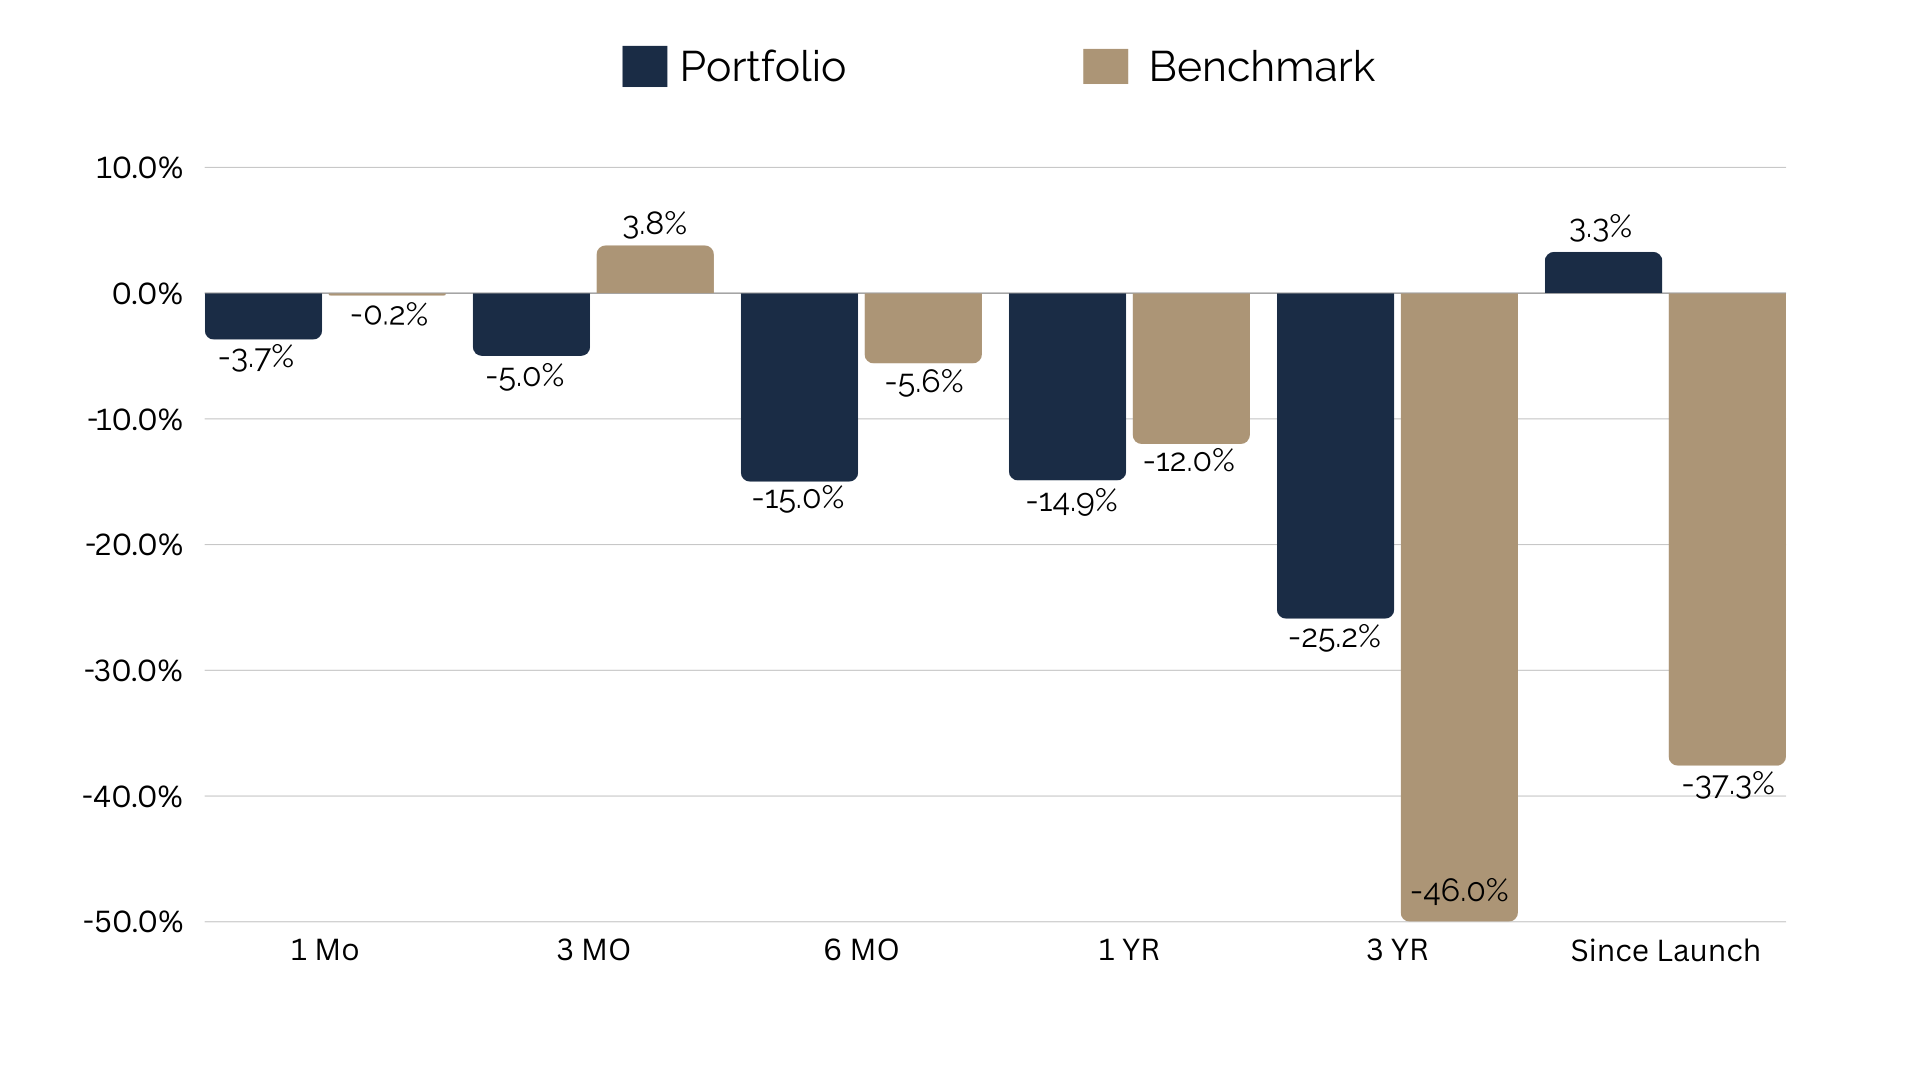
*Since the earliest initiating date of companies in the list of FRC’s Top Picks (as of February 26, 2024)
*Past performance is not indicative of future performance
| Total Return |
1 mo |
3 mo |
6 mo |
1 yr |
3 yr |
Since launch |
| Mining |
-3.70% |
-7.50% |
-20.10% |
-17.90% |
-55.80% |
4.40% |
| Cannabis |
N/A |
N/A |
N/A |
n/a |
-31.80% |
-23.60% |
| Tech |
-17.60% |
-20.00% |
-44.00% |
-44.00% |
-42.10% |
-4.60% |
| Special Situations (MIC) |
-0.50% |
10.10% |
14.40% |
-14.50% |
-10.30% |
-16.10% |
| Private Companies |
N/A |
N/A |
N/A |
6.70% |
20.50% |
30.50% |
| Portfolio (Total) |
-3.70% |
-5.00% |
-15.00% |
-14.90% |
-25.20% |
3.30% |
| Benchmark (Total) |
-0.20% |
3.80% |
-5.60% |
-12.00% |
-46.00% |
-37.90% |
| Portfolio (Annualized) |
- |
- |
- |
-14.90% |
-9.20% |
0.30% |
| Benchmark (Annualized) |
- |
- |
- |
-12.00% |
-18.60% |
-4.60% |
1. Since the earliest initiating date of companies in the list of Top Picks (as of February 26, 2024)
2. Green (blue) indicates FRC’s picks outperformed (underperformed) the benchmark.
3. Past performance is not indicative of future performance.
Weekly Mining Commentary
Last week, global equity markets were up 1.2% on average (up 1.7% in the previous week). The S&P 500 surged 2.4% and is currently trading at record levels. This week, our focus is on U.S. GDP and PCE (personal consumption) data. As stated last week, we anticipate the US$ will remain strong in the coming weeks, with expectations of the Fed initiating rate cuts in June.
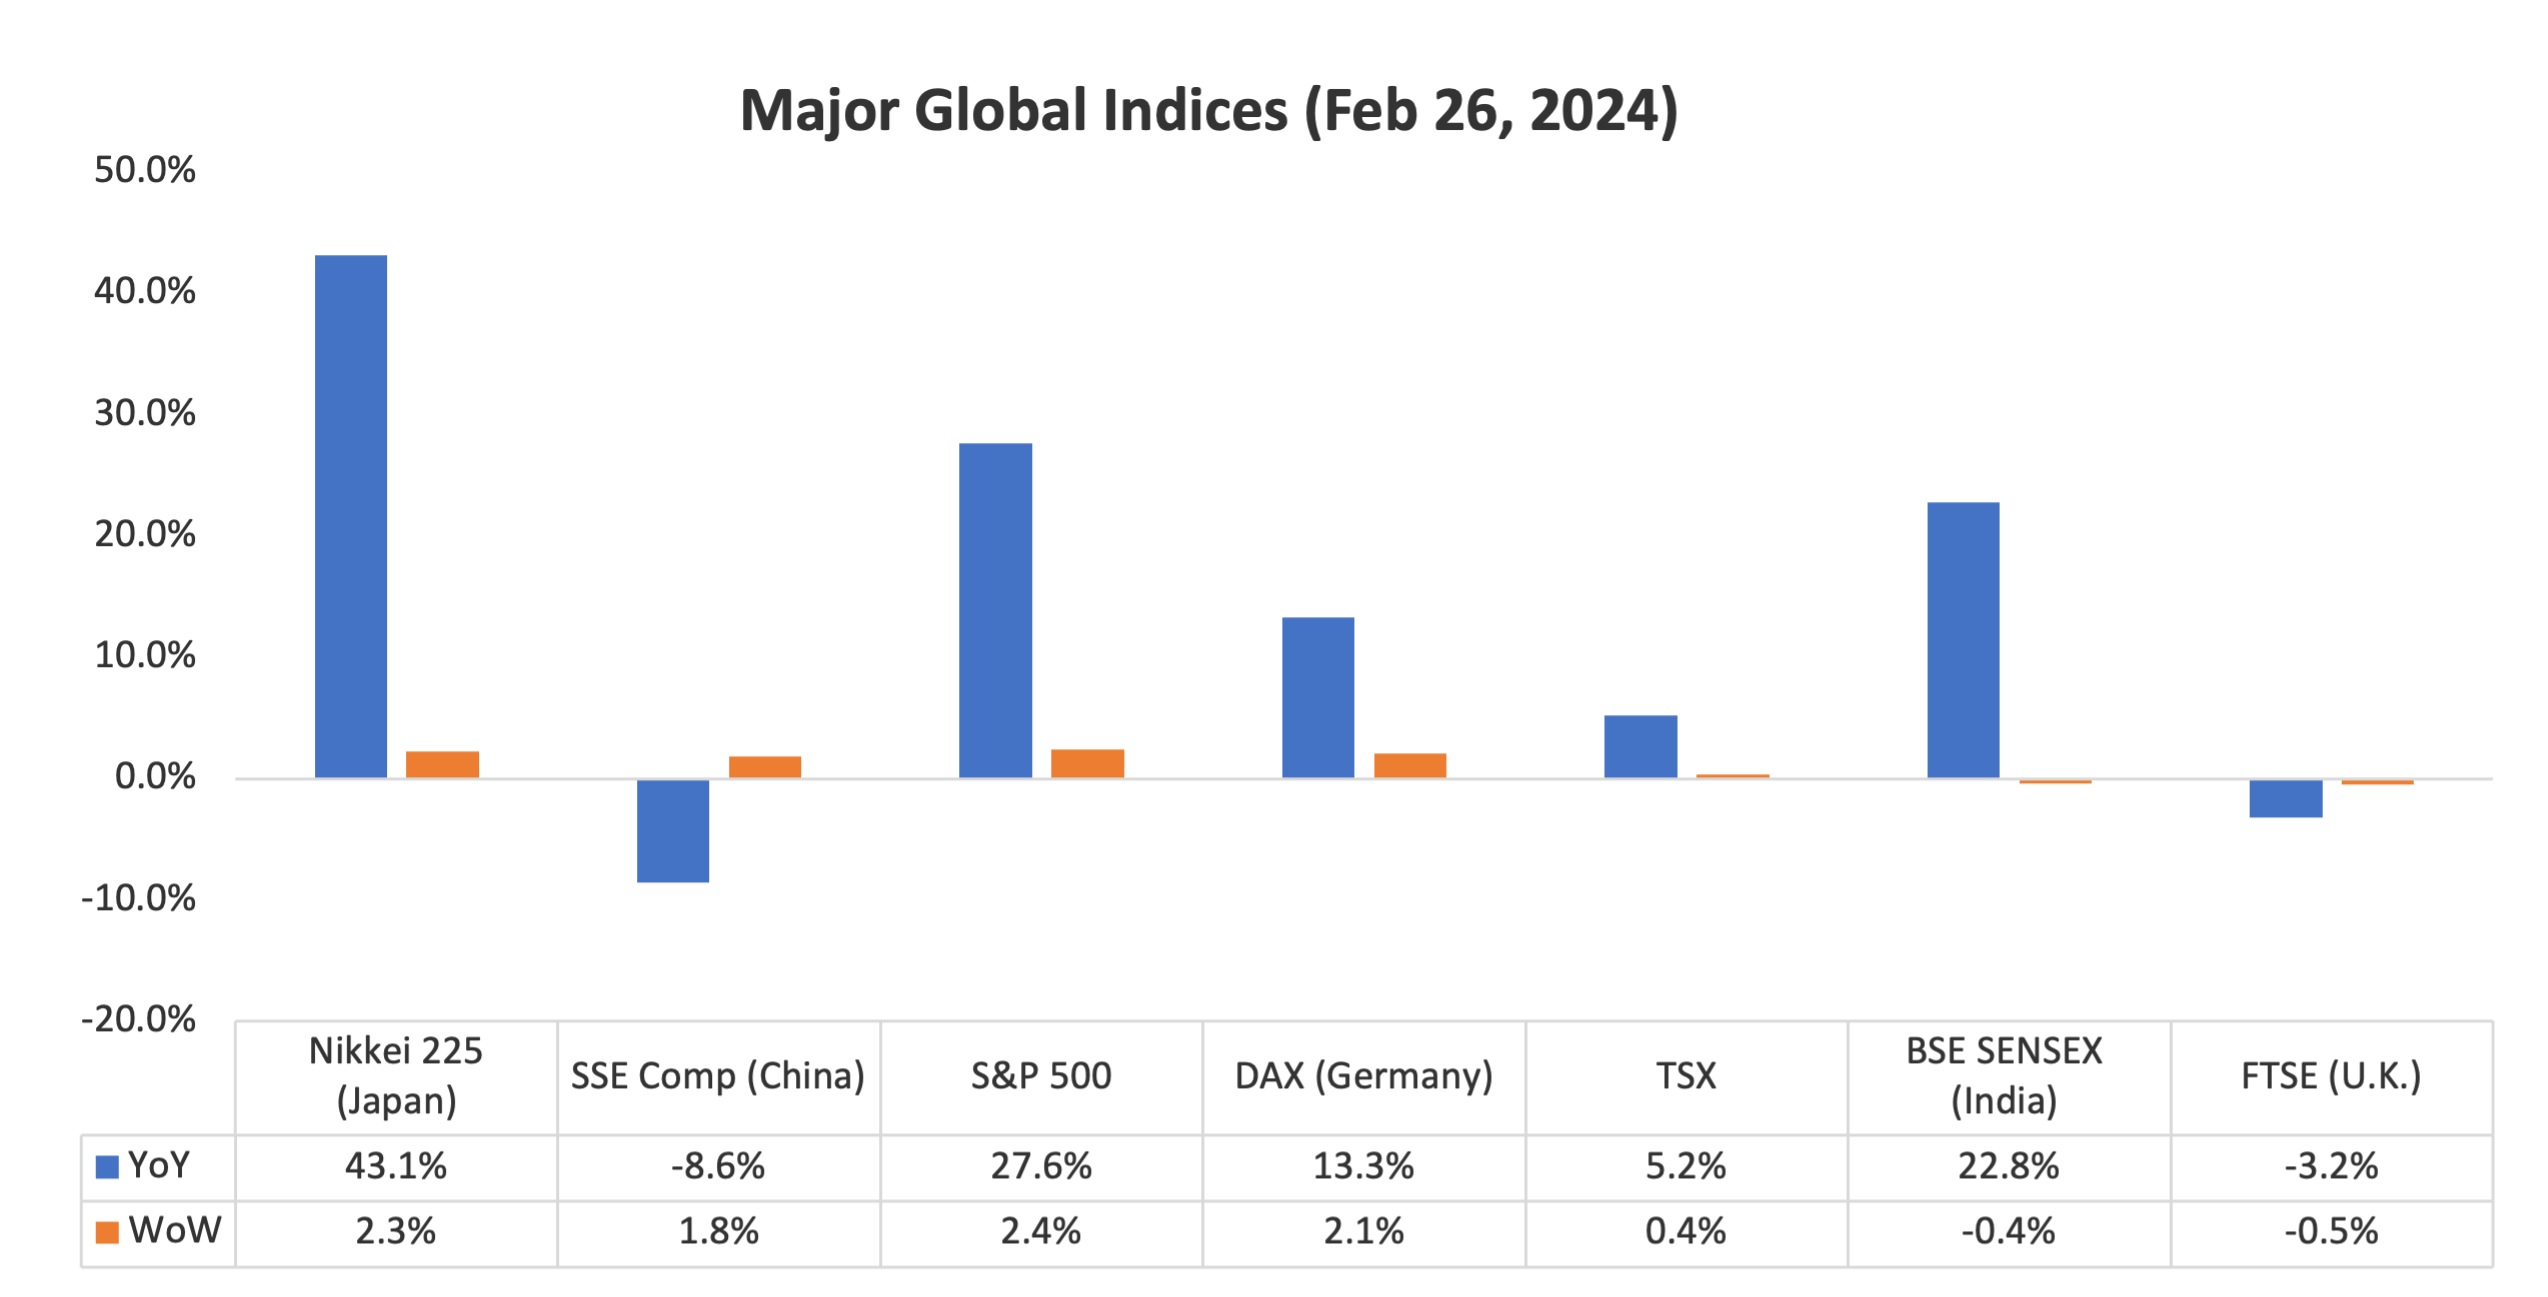
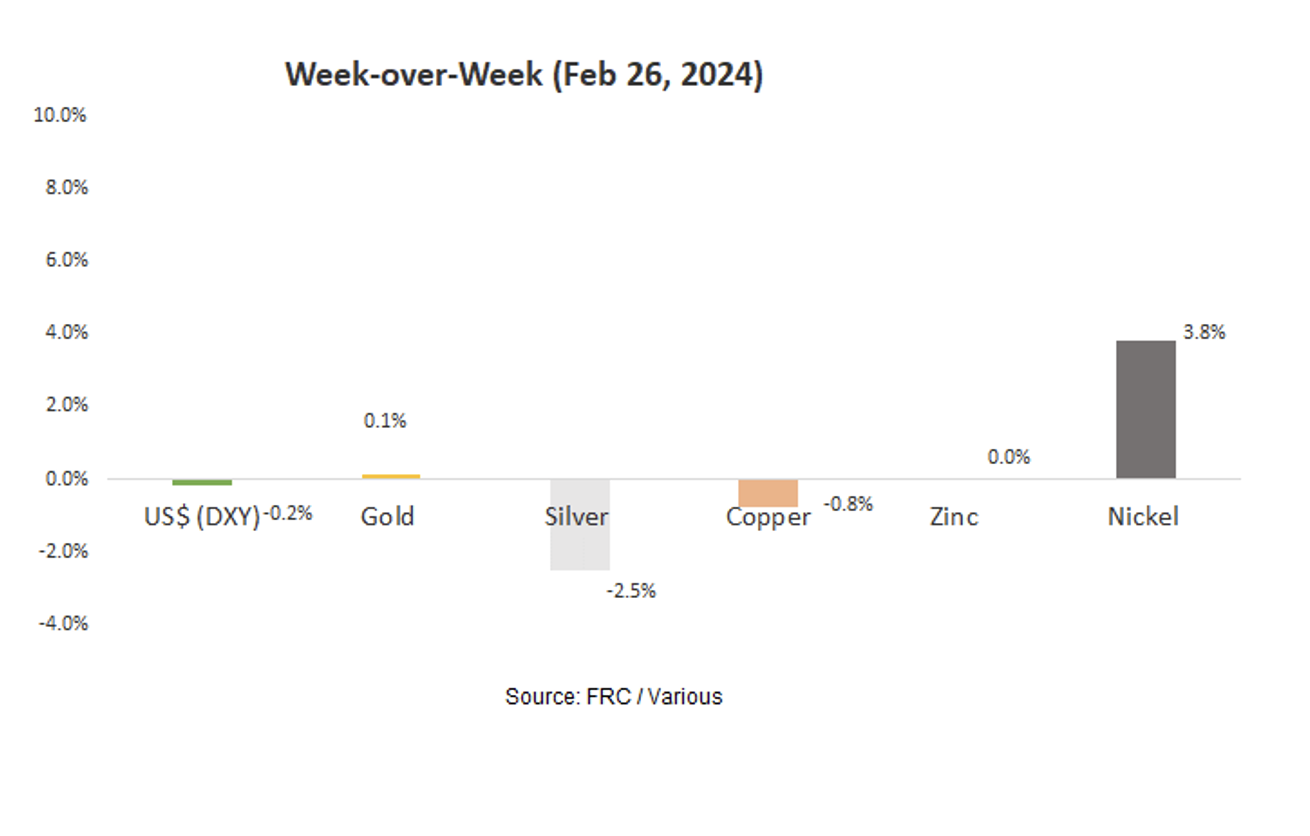
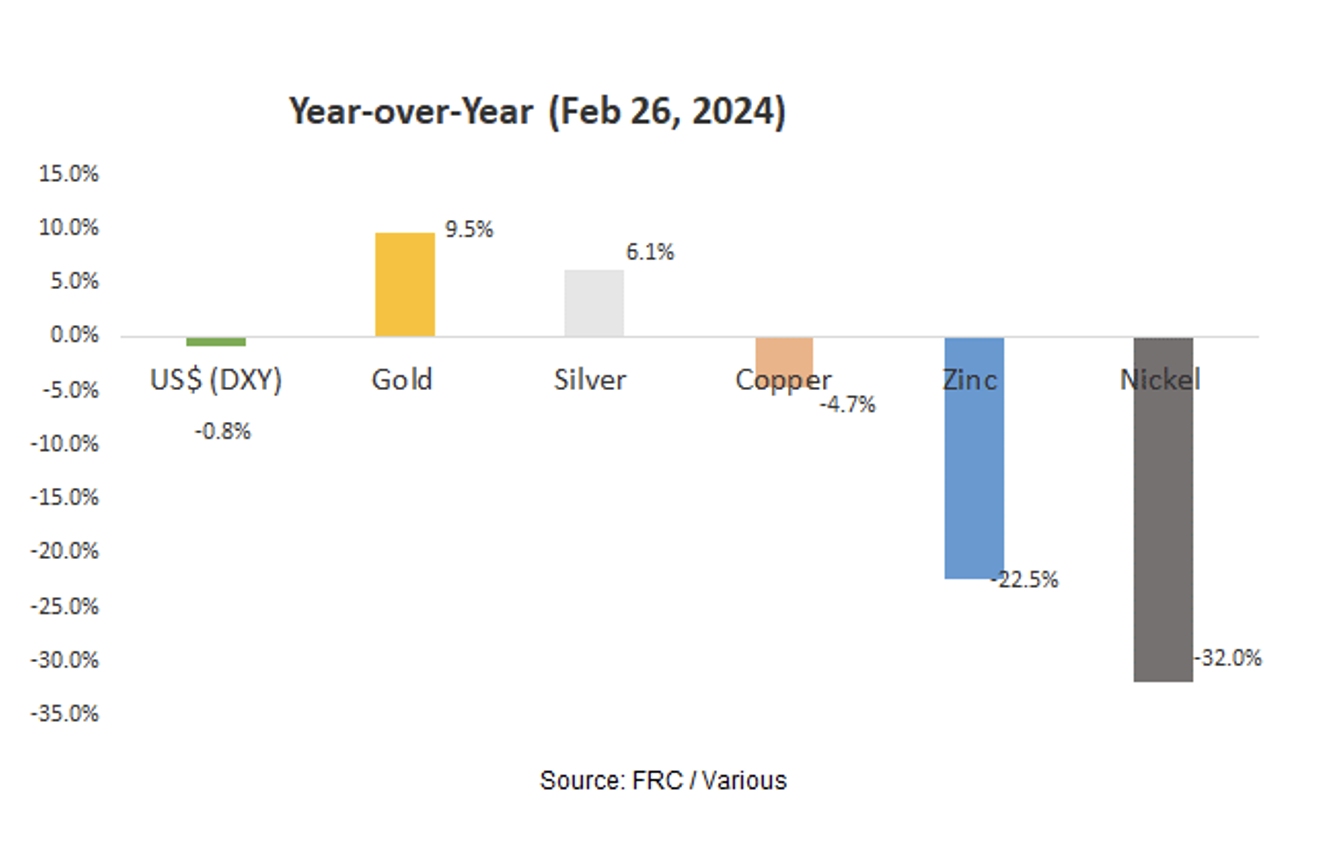
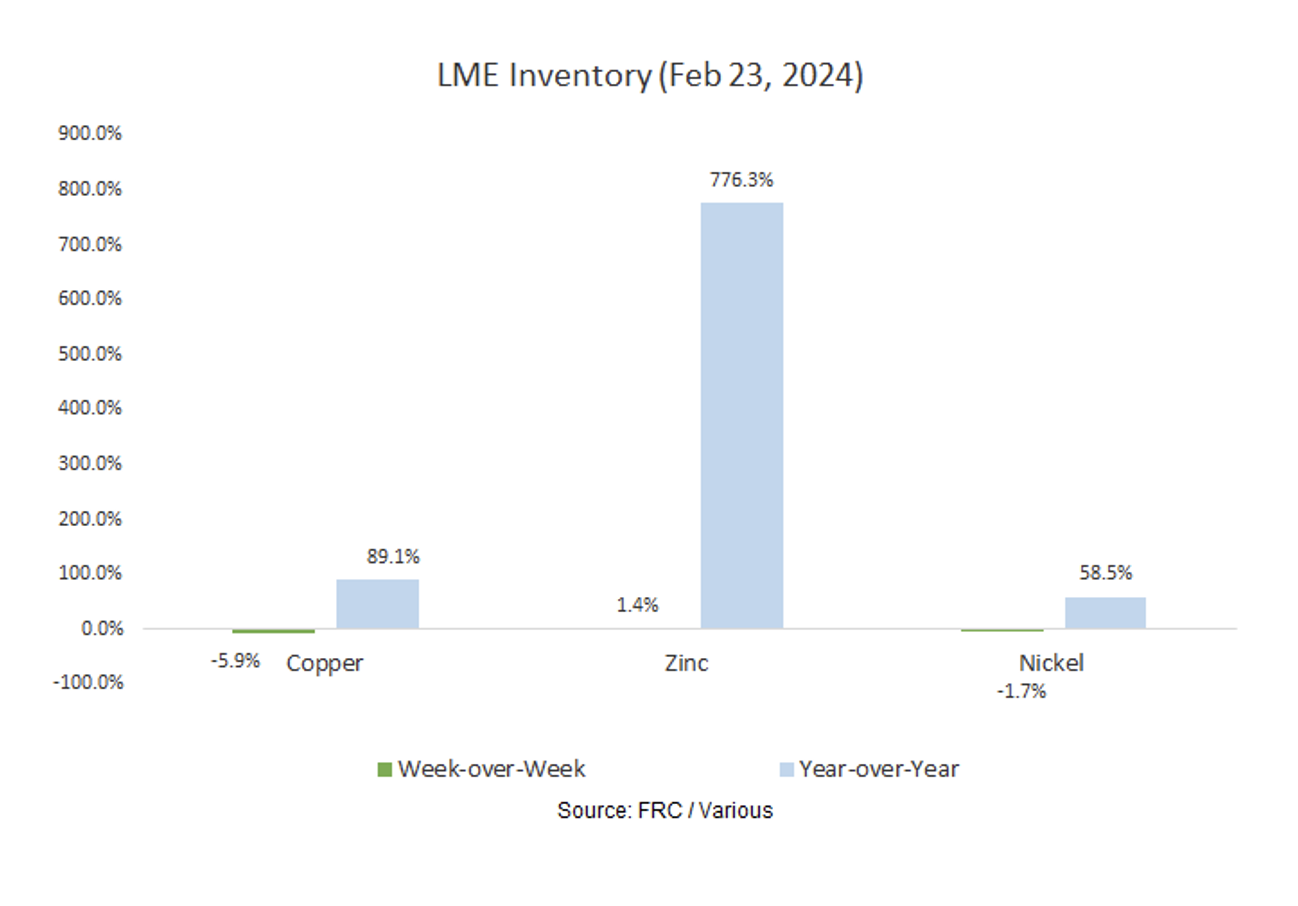
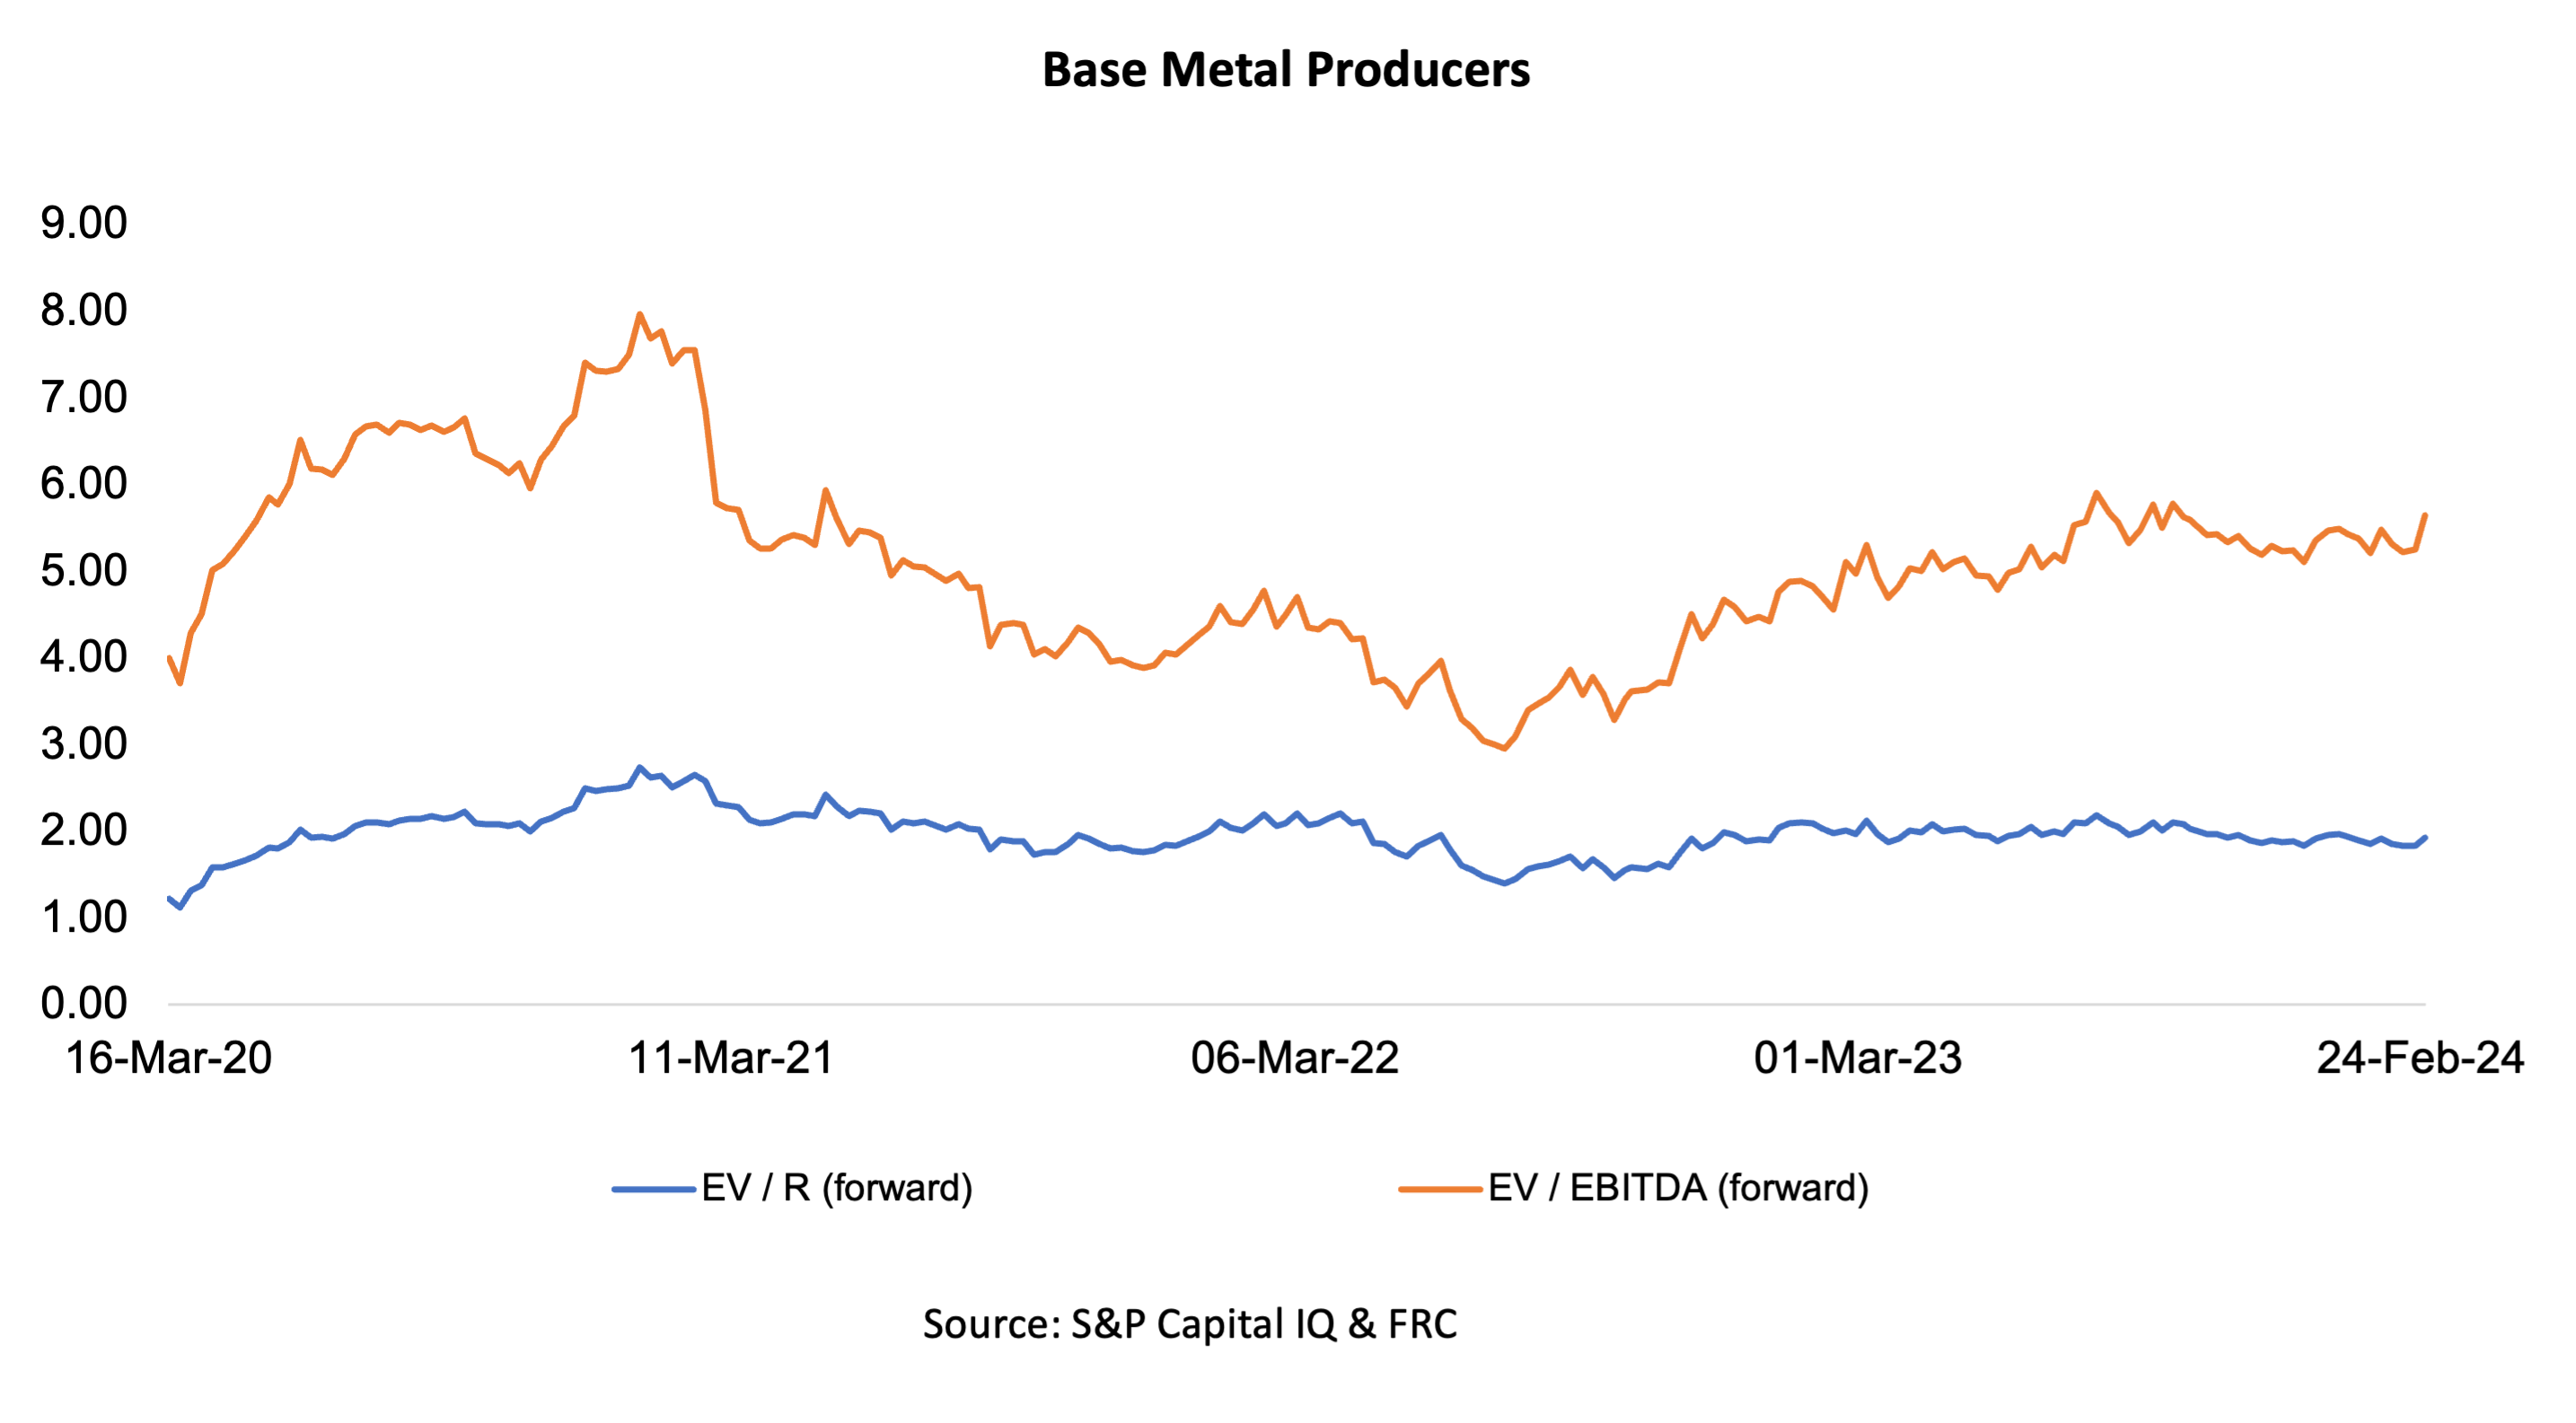
Gold producer valuations were down 8% last week (down 2% in the prior week); base metal producers were up 6% last week (up 1% in the prior week). On average, gold producer valuations are 28% lower compared to the past three instances when gold surpassed US$2k/oz.
| |
05-Feb-24 |
12-Feb-24 |
20-Feb-24 |
26-Feb-24 |
|
| |
Gold Producers |
EV / R (forward) |
EV / EBITDA (forward) |
EV / R (forward) |
EV / EBITDA (forward) |
EV / R (forward) |
EV / EBITDA (forward) |
EV / R (forward) |
EV / EBITDA (forward) |
| 1 |
Barrick |
3.16 |
7.02 |
3.07 |
6.75 |
2.83 |
6.36 |
2.88 |
6.42 |
| 2 |
Newmont |
3.72 |
10.24 |
3.56 |
9.9 |
3.62 |
10.07 |
2.64 |
6.44 |
| 3 |
Agnico Eagle |
3.94 |
8.06 |
3.78 |
7.75 |
3.64 |
7.36 |
3.71 |
7.45 |
| 4 |
AngloGold |
1.99 |
7.22 |
1.93 |
6.99 |
1.93 |
7.29 |
1.86 |
4.81 |
| 5 |
Kinross Gold |
2.12 |
5.01 |
2.04 |
4.8 |
1.95 |
4.78 |
1.91 |
4.73 |
| 6 |
Gold Fields |
3.15 |
6.01 |
3.01 |
5.74 |
3.06 |
5.89 |
2.41 |
4.79 |
| 7 |
Sibanye |
0.61 |
3.17 |
0.57 |
2.98 |
0.59 |
3.09 |
0.57 |
2.99 |
| 8 |
Hecla Mining |
3.89 |
18.13 |
3.71 |
17.11 |
3.48 |
13.28 |
3.5 |
12.69 |
| 9 |
B2Gold |
1.77 |
3.26 |
1.68 |
3.12 |
1.61 |
2.99 |
1.86 |
3.98 |
| 10 |
Alamos |
4.56 |
9.16 |
4.38 |
8.86 |
4.27 |
8.62 |
4.37 |
8.41 |
| 11 |
Harmony |
1.37 |
4.62 |
1.3 |
4.39 |
1.25 |
4.21 |
1.26 |
4.26 |
| 12 |
Eldorado Gold |
2.52 |
5.56 |
2.45 |
5.42 |
2.23 |
4.96 |
1.83 |
4.11 |
| |
Average (excl outliers) |
2.63 |
6.3 |
2.52 |
6.06 |
2.45 |
5.97 |
2.3 |
5.31 |
| |
Min |
0.61 |
3.17 |
0.57 |
2.98 |
0.59 |
2.99 |
0.57 |
2.99 |
| |
Max |
4.56 |
18.13 |
4.38 |
17.11 |
4.27 |
13.28 |
4.37 |
12.69 |
| |
|
|
|
|
|
|
|
|
|
| |
Base Metal Producers |
EV / R (forward) |
EV / EBITDA (forward) |
EV / R (forward) |
EV / EBITDA (forward) |
EV / R (forward) |
EV / EBITDA (forward) |
EV / R (forward) |
EV / EBITDA (forward) |
| 1 |
BHP Group |
2.99 |
5.6 |
2.99 |
5.57 |
3.02 |
5.55 |
2.85 |
5.39 |
| 2 |
Rio Tinto |
2.25 |
5.09 |
2.27 |
5.12 |
2.23 |
5.05 |
2.09 |
4.45 |
| 3 |
South32 |
1.31 |
5.78 |
1.27 |
5.6 |
1.27 |
5.73 |
1.29 |
5.89 |
| 4 |
Glencore |
0.39 |
4.87 |
0.38 |
4.77 |
0.38 |
4.72 |
0.38 |
4.66 |
| 5 |
Anglo American |
1.36 |
4.27 |
1.34 |
4.2 |
1.32 |
4.23 |
1.49 |
4.43 |
| 6 |
Teck Resources |
2.54 |
5.9 |
2.42 |
5.63 |
2.51 |
5.85 |
2.28 |
5.12 |
| 7 |
First Quantum |
2.12 |
5.64 |
2.11 |
5.63 |
2.1 |
5.62 |
3.06 |
9.53 |
| |
Average (excl outliers) |
1.85 |
5.31 |
1.83 |
5.22 |
1.83 |
5.25 |
1.92 |
5.64 |
| |
Min |
0.39 |
4.27 |
0.38 |
4.2 |
0.38 |
4.23 |
0.38 |
4.43 |
| |
Max |
2.99 |
5.9 |
2.99 |
5.63 |
3.02 |
5.85 |
3.06 |
9.53 |
| Source: S&P Capital IQ & FRC |
|
|
|
|
|
|
|
We are maintaining our metal price forecasts.
Updates from Resource Companies Under Coverage


